Published: November 20th, 2024
For the third day in a row, the GBPJPY cross rose, continuing its robust recovery from the 193.60–193.55 range, its lowest level since October 8.
Following remarks by US and Russian officials, market apprehensions over the possibility of a full-scale nuclear war have decreased, reducing risk aversion and weakening the safe-haven Japanese yen (JPY).
The yen has also been negatively impacted by continuous uncertainty about the tightening of the Bank of Japan's (BoJ) monetary policy. Simultaneously, predictions of inflationary pressures are bolstered by optimism surrounding the UK government's fiscal stimulus to promote domestic demand. This could postpone the Bank of England's (BoE) cycle of rate cuts, hence supporting the GBP.
However, aggressive bets on additional JPY decline are likely limited by broader geopolitical uncertainty and rumors that Japanese authorities may interfere in the FX market to protect the native currency.
Investors have seen the UK inflation report, released today, where an upbeat result has come, creating buying pressure on the GBPJPY price. However, the intraday gain needs to stabilize more before anticipating a long-term upward continuation.
Let's see the further aspect of this pair from the GBPJPY technical analysis:

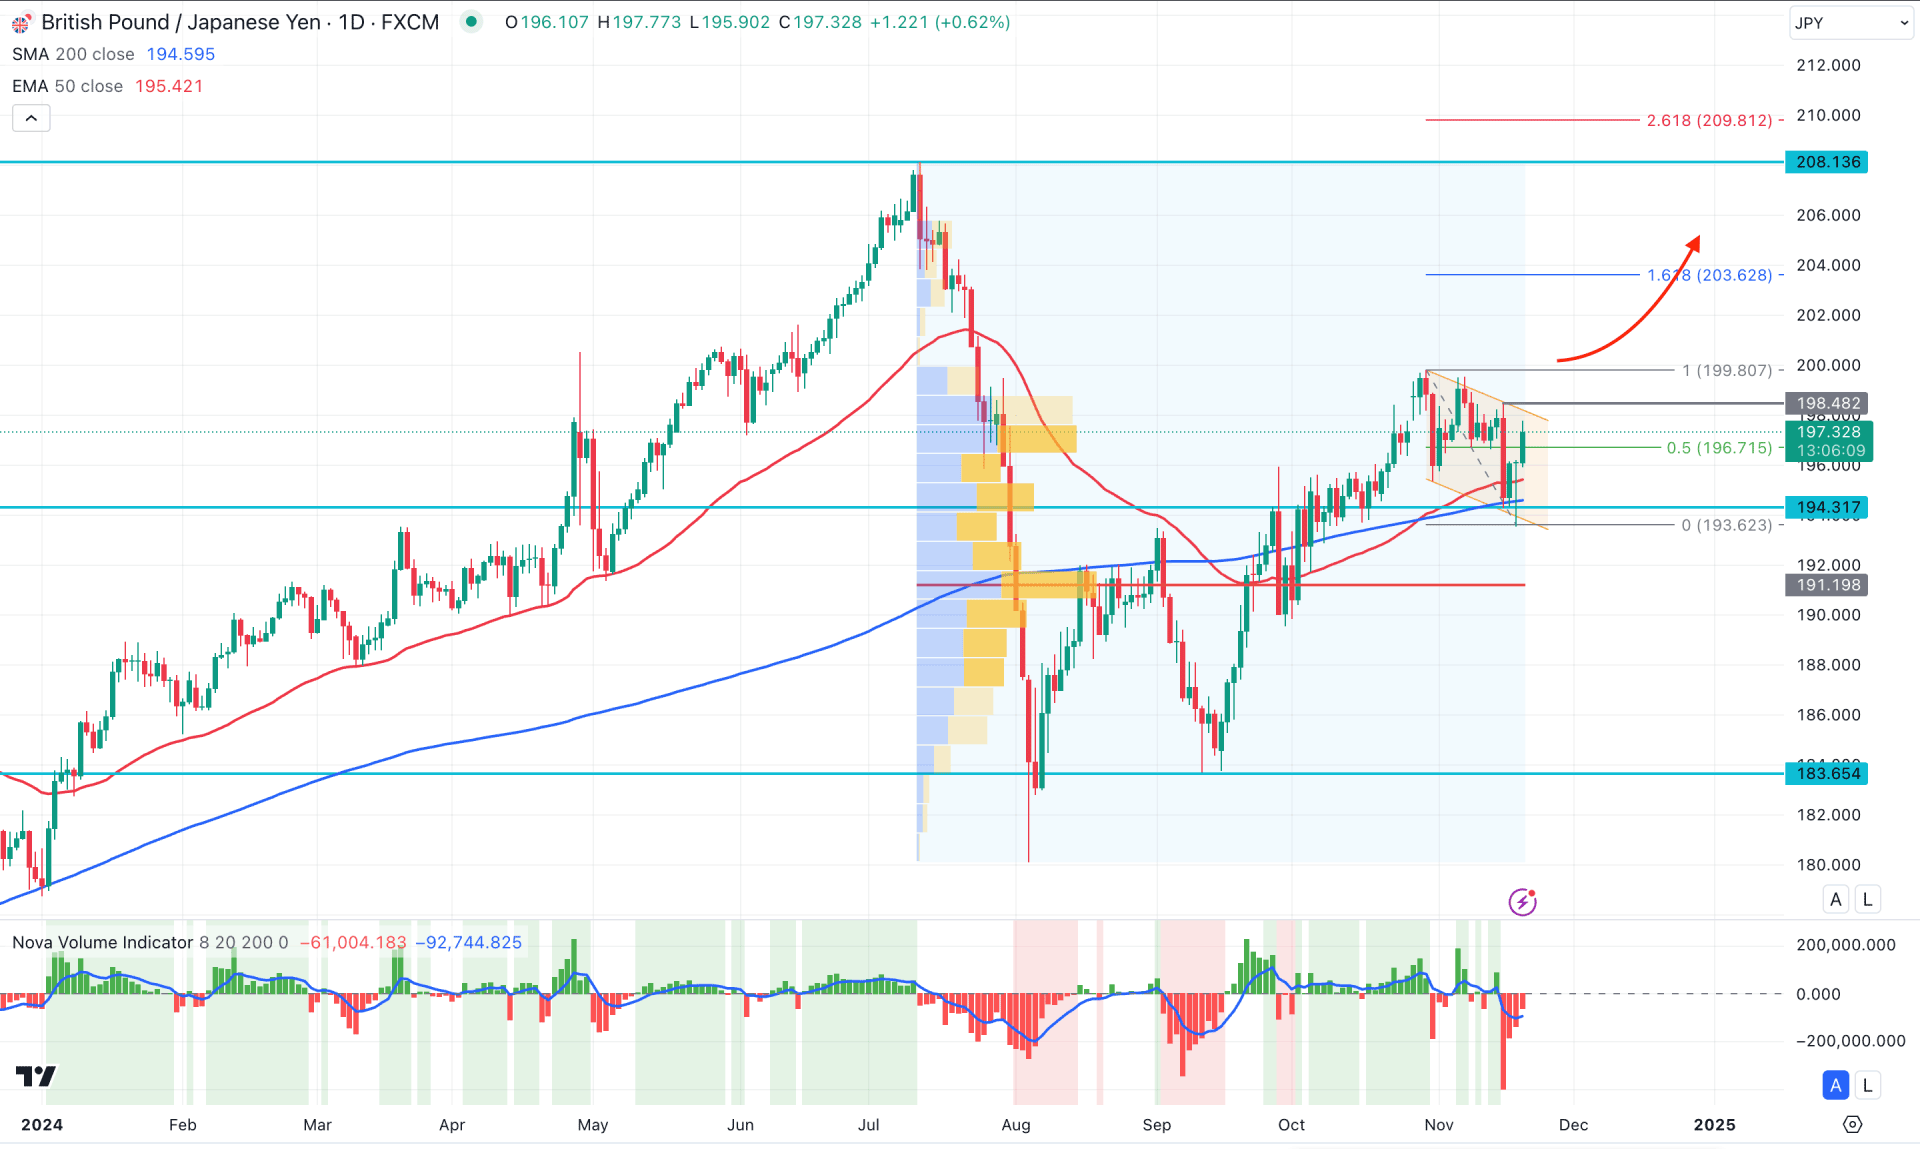
In the daily chart of GBPJPY, the ongoing market momentum is bullish, initiated from the exhaustion in August 2024. Although the price trades higher with a corrective momentum, the chance of a bullish continuation is potent as the price left some imbalances above the near-term swing high.
In the higher timeframe, a bullish continuation is clear from the Doji breakout, with a monthly close above the September high. Moreover, the current price is hovering above the October 2024 high, which might work as an additional bullish continuation signal.
In the volume structure, the largest activity level since July 2024 is below the current price, signaling institutional buyers' presence in the market. Moreover, the Volume indicator shows a weaker sell-side volume formation, signaling an early bullish sign. However, a valid upward signal might come once the Histogram overcomes the neutral line.
The main price chart shows a failed death cross as the 50-day EMA moved below the 200-day SMA but failed to hold the pressure. As a result, an immediate rebound with a bullish crossover signals a valid Golden Cross formation. In that case, investors should monitor how the price trades above the 50-day EMA line as a valid intraday bullish signal might offer a trend trading opportunity.
Based on the daily outlook of GBPJPY, the immediate bullish signal might come after having a daily close above the channel resistance. In that case, the upward pressure might extend, where the main aim is to test the 203.62 Fibonacci Extension level.
A descending channel continuation is possible on the bearish side, but a valid bearish signal might come after having a daily candle below the 200-day SMA line. A bearish daily close below the 194.31 static level could lower the price towards the 186.00 area.

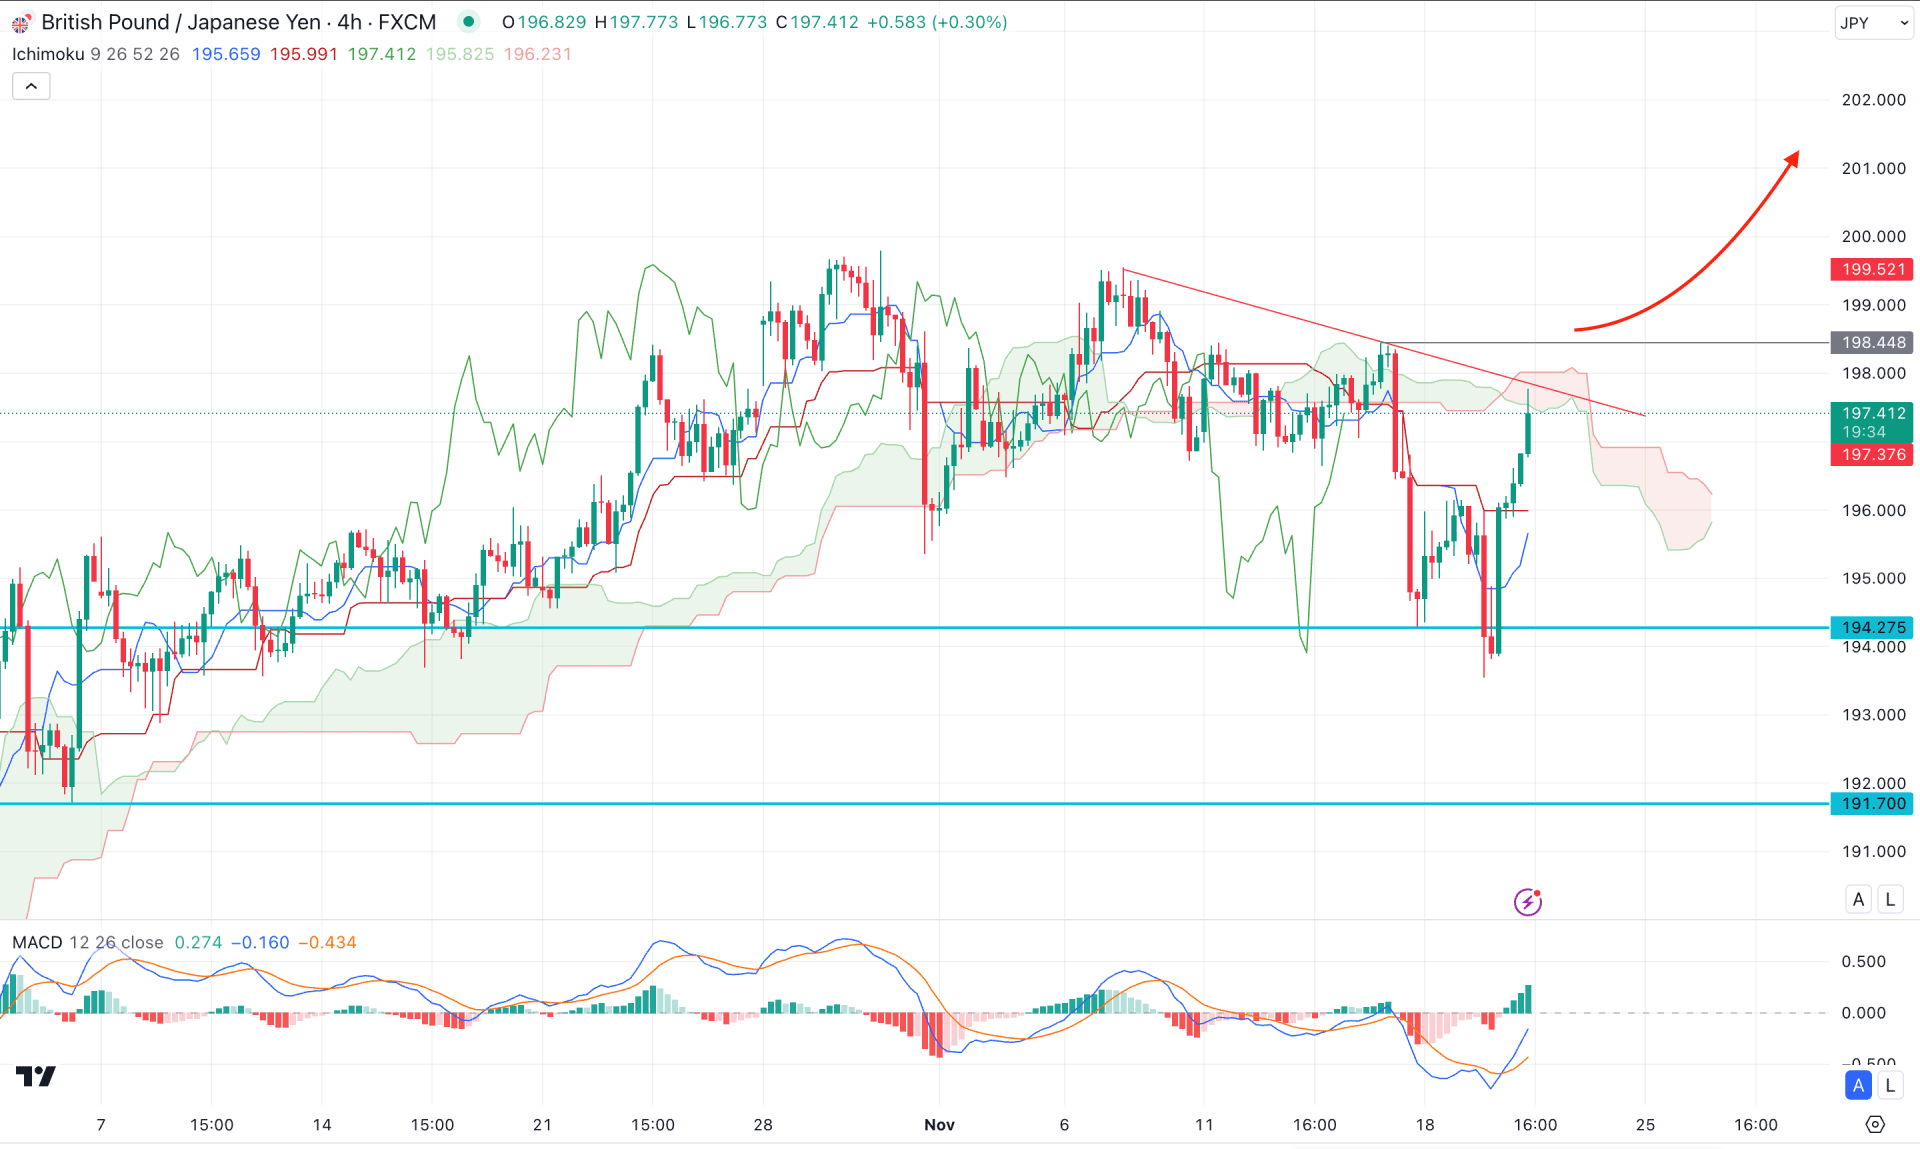
In the H4 timeframe, the recent price looks volatile as the H4 timeframe, as a strong bullish recovery is visible from the 194.27 key support level. However, the Ichimoku Cloud zone is working as a resistance, which needs to be overcome before forming a bull run.
In the indicator window, the MACD Histogram maintained the buying position by being stable above the neutral point. Moreover, the signal line formed a bullish crossover from the record low level, signaling an oversold condition.
Based on the H4 market outlook, an early bullish signal is visible in the GBPJPY price, even if the current price hovers below the cloud zone. A valid bullish breakout from the trendline resistance could provide an immediate long opportunity, aiming for the 202.00 level in the coming hours.
On the bearish side, a struggle to overcome the cloud zone could be a challenging factor to bulls. In that case, a valid selling pressure with an H4 candle below the Kijun Sen could open a short opportunity, aiming for the 191.70 support level.

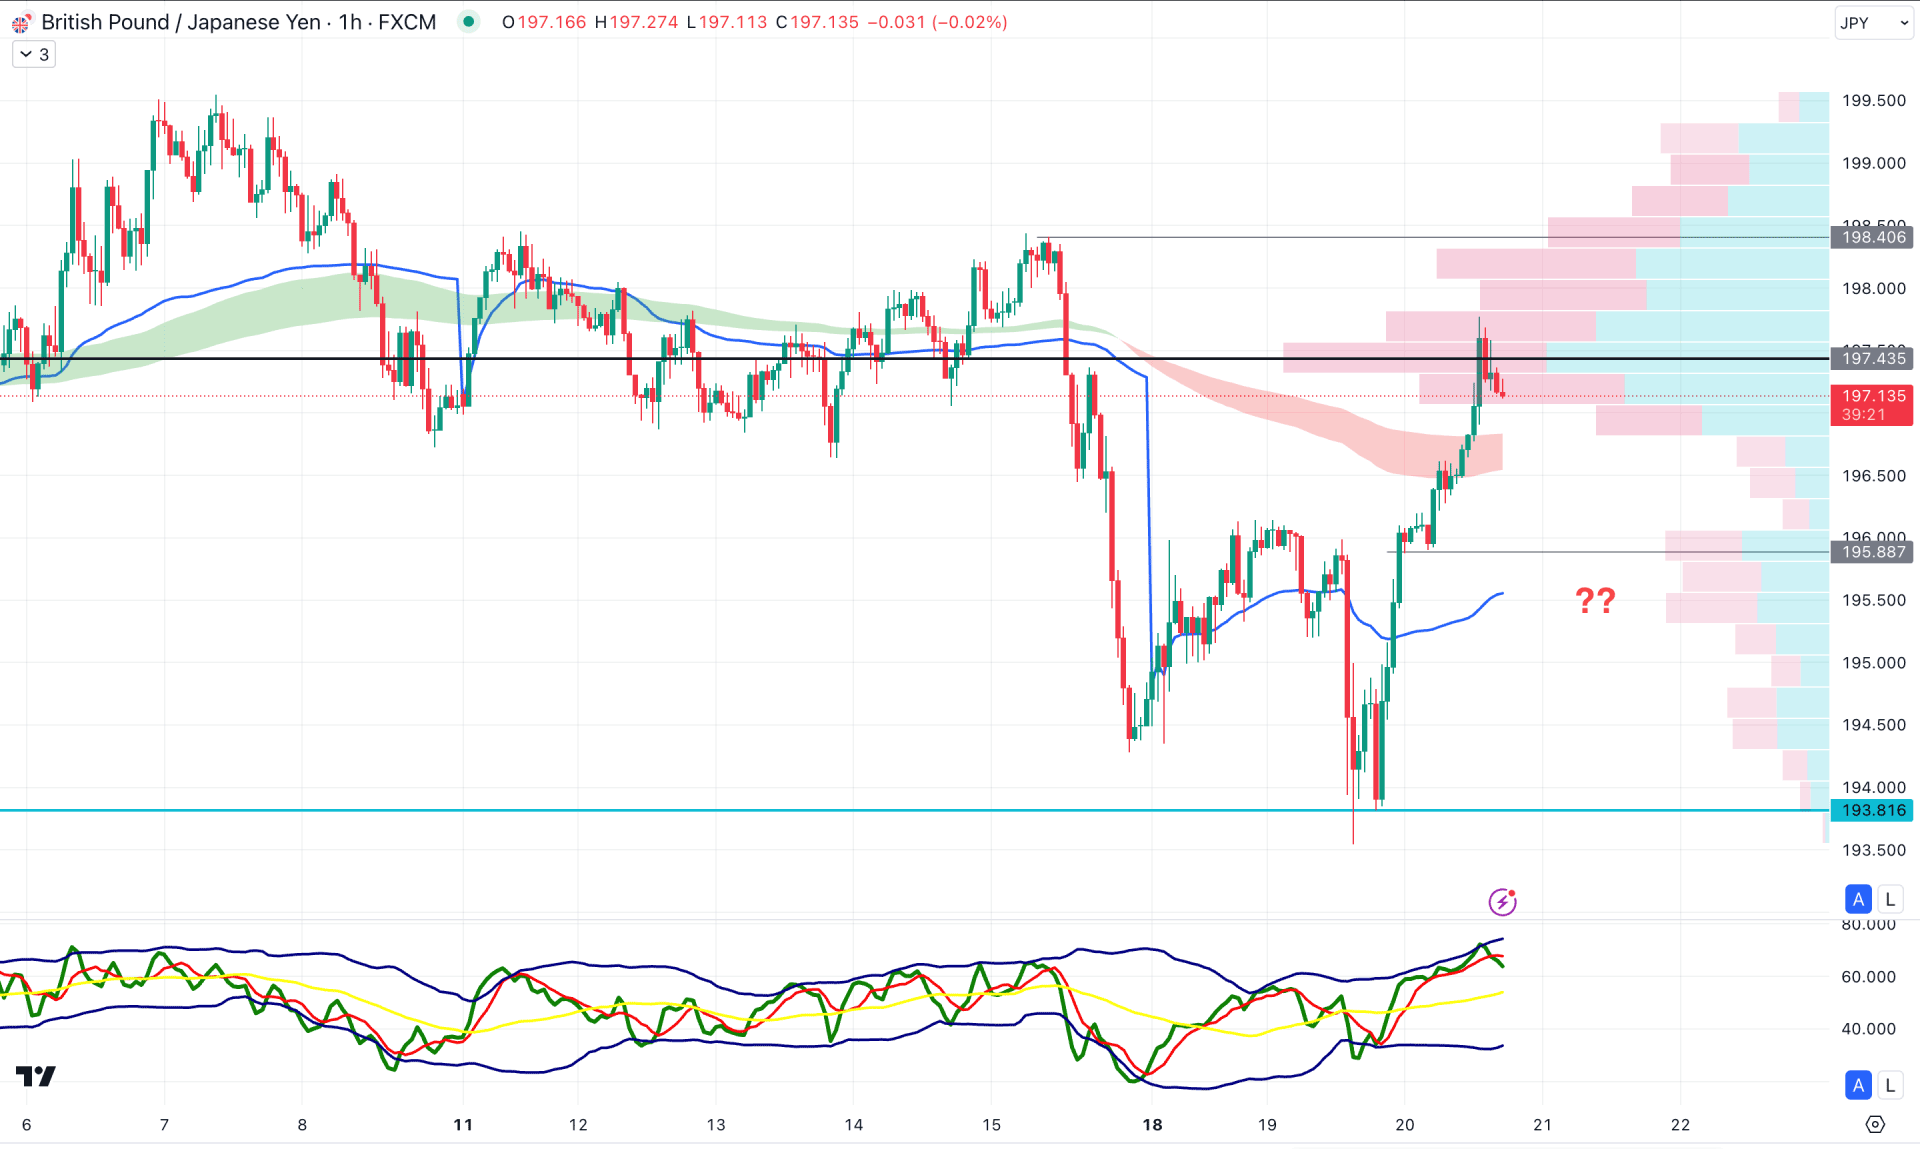
In the hourly time frame, the recent price showed a strong bullish reversal and bearish orders were eliminated with a bullish V-shape recovery. As a result, the bottom is confirmed at the 193.81 low, which could be the ultimate low in this structure.
In the indicator window, the Traders Dynamic Index (TDI) aimed higher and reached the highest level in a month, suggesting extreme buying pressure. However, the overbought TDI might signal a possible selling pressure in the main price chart as a profit-taking.
Considering the current high volume line, a valid bullish break is needed before anticipating a long move ahead. A bullish H1 candle above the 198.40 resistance level could validate the buying pressure, aiming for the 200.00 area.
The alternative approach is to seek short trades as long as the high volume line works as a resistance. In that case, a downside recovery below the weekly VWAP line might open a short opportunity, aiming for the 193.50 level.
Based on the ongoing market momentum, GBPJPY is more likely to extend the bullish trend after the channel breakout. As the intraday price is facing resistance, investors might expect a downside correction, from which a valid bullish reversal could come.