
Published: February 15th, 2023
The UK's macroeconomic data released this week was mixed, with unemployment remaining steady at 3.7% while average wages fell slightly to 5.9%. January also saw a decline in unemployment claims, dropping by 12.9 thousand, against forecasts of a 17.9 thousand increase. These figures failed to provide much support for the pound.
At the same time, the number of vacancies in the labor market decreased by 76 thousand to 1.134 million, indicating that companies have started to make savings. This is not good news for the economy and the pound's value.
Meanwhile, Japan is struggling to revive its economy, with weak domestic demand and difficulties in its export sector causing problems. Inflation simulation efforts by the Bank of Japan have had limited success as households have not changed their spending habits. As long as the Japanese interest rate remains at -0.1% a year, the JPY will remain vulnerable.
This week, investors have seen the US CPI remain stable above the 10% area, which created an intraday selling pressure in the GBPJPY price.
Should you buy GBPJPY now? Let’s have a look at the complete price prediction from the GBPJPY technical analysis:
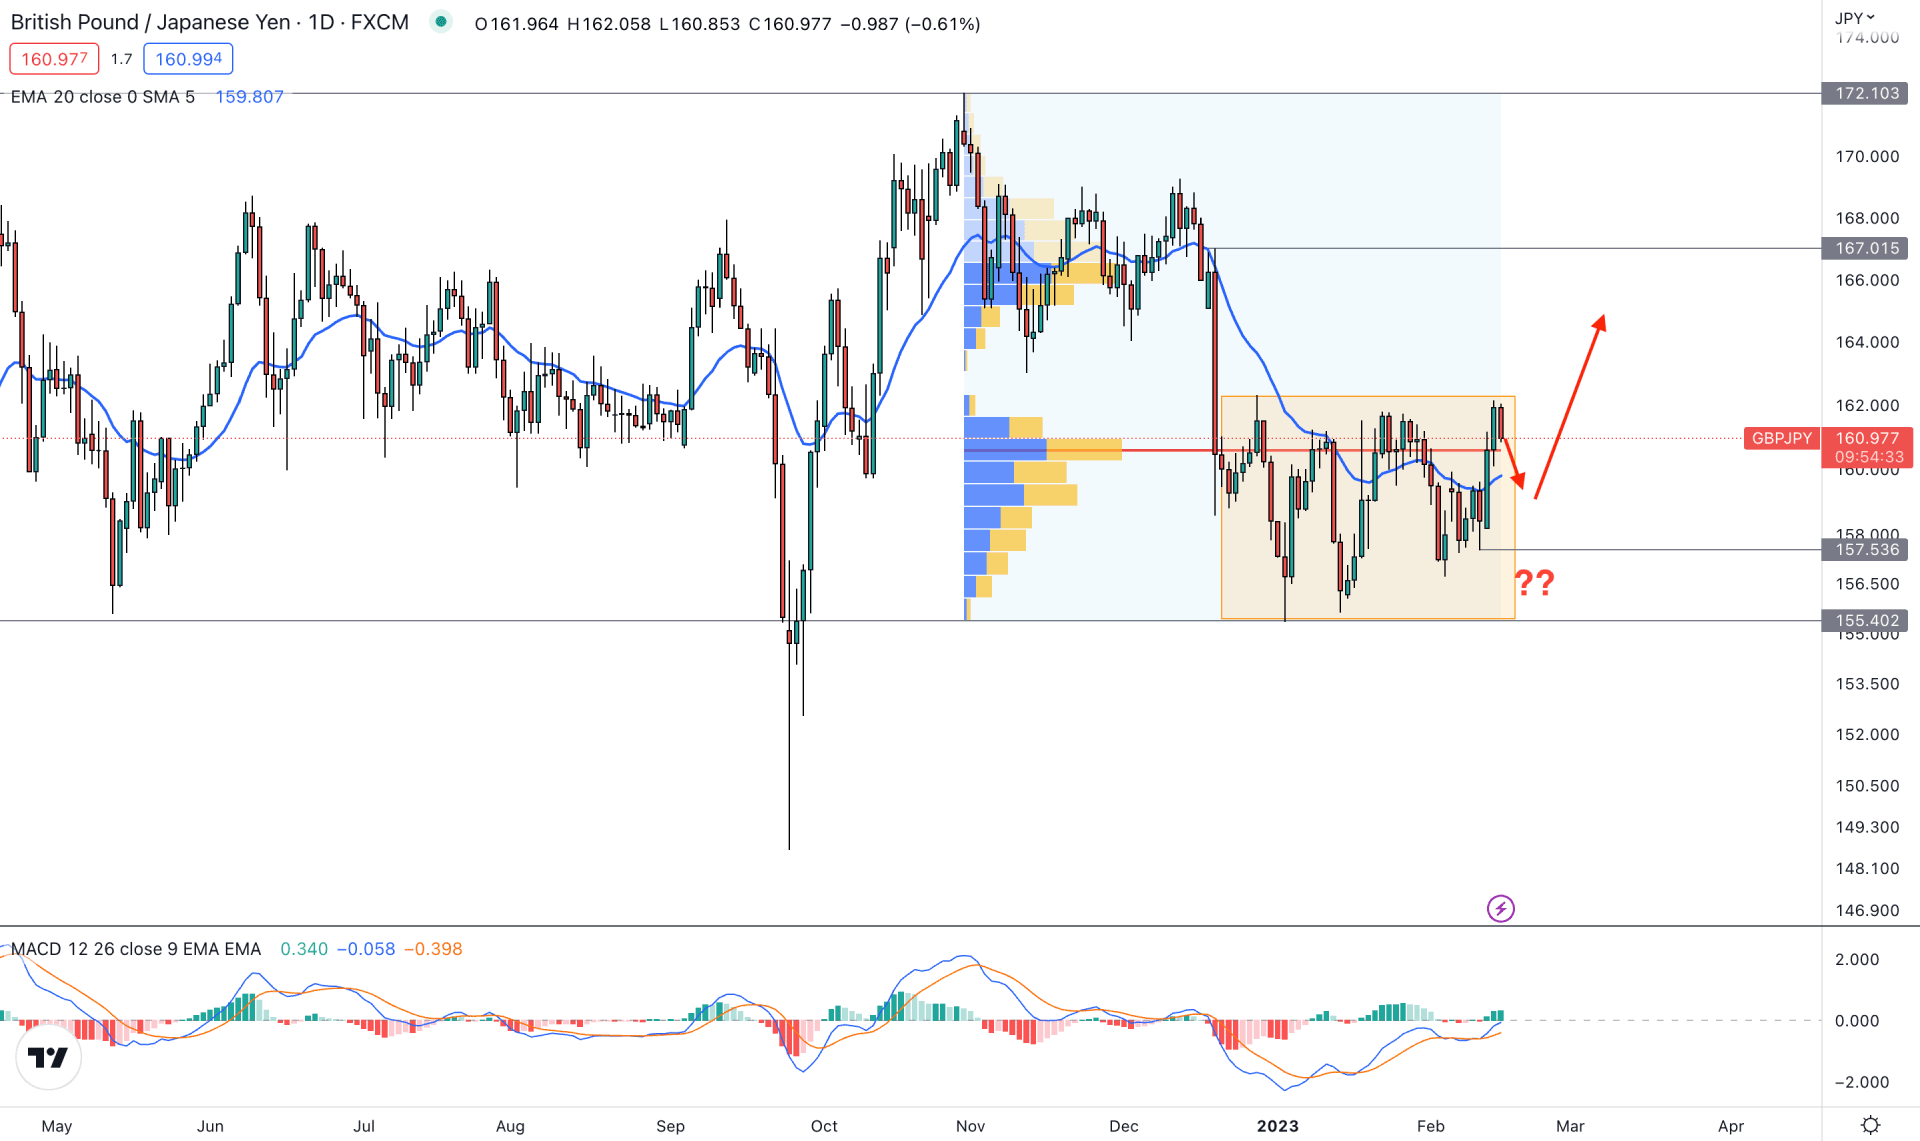
In the daily price, the broader outlook of the GBPJPY is corrective. A new swing high is visible after the Covid-19 crash, but the recent price is extremely corrective within a rectangle pattern.
In the higher timeframe price action, it is the first buying momentum after two consecutive bearish weeks, where no sell-side liquidity grab is seen. Investors should wait for a proper breakout above the current rectangle pattern before opening any long-term buying position.
The current price seems interesting to institutional investors as the range indicates a proper accumulation. The current visible range high volume level from November to February is spotted at 160.79, below yesterday’s daily candle close. As the current price is above the high volume level, it is safer to look for long opportunities only. However, the correction and the rectangle pattern formation indicate that investors need more confirmations before opening any long position.
In the main chart, the dynamic 20 EMA is closer to the price with multiple violations, while the current MACD EMA’s are pushing higher at the neutral zone.
Based on the daily price structure, a valid bullish breakout with a daily candle above the 162.30 level could offer a long opportunity, targeting the 167.00 level.
However, an extension to the range is possible, which may open another buying opportunity at the 157.53 support level with a proper candlestick formation.
On the other hand, breaking below the 155.40 swing low would invalidate the buying possibility, whereas a strong bearish D1 candle below this level could lower the price towards the 148.00 area.
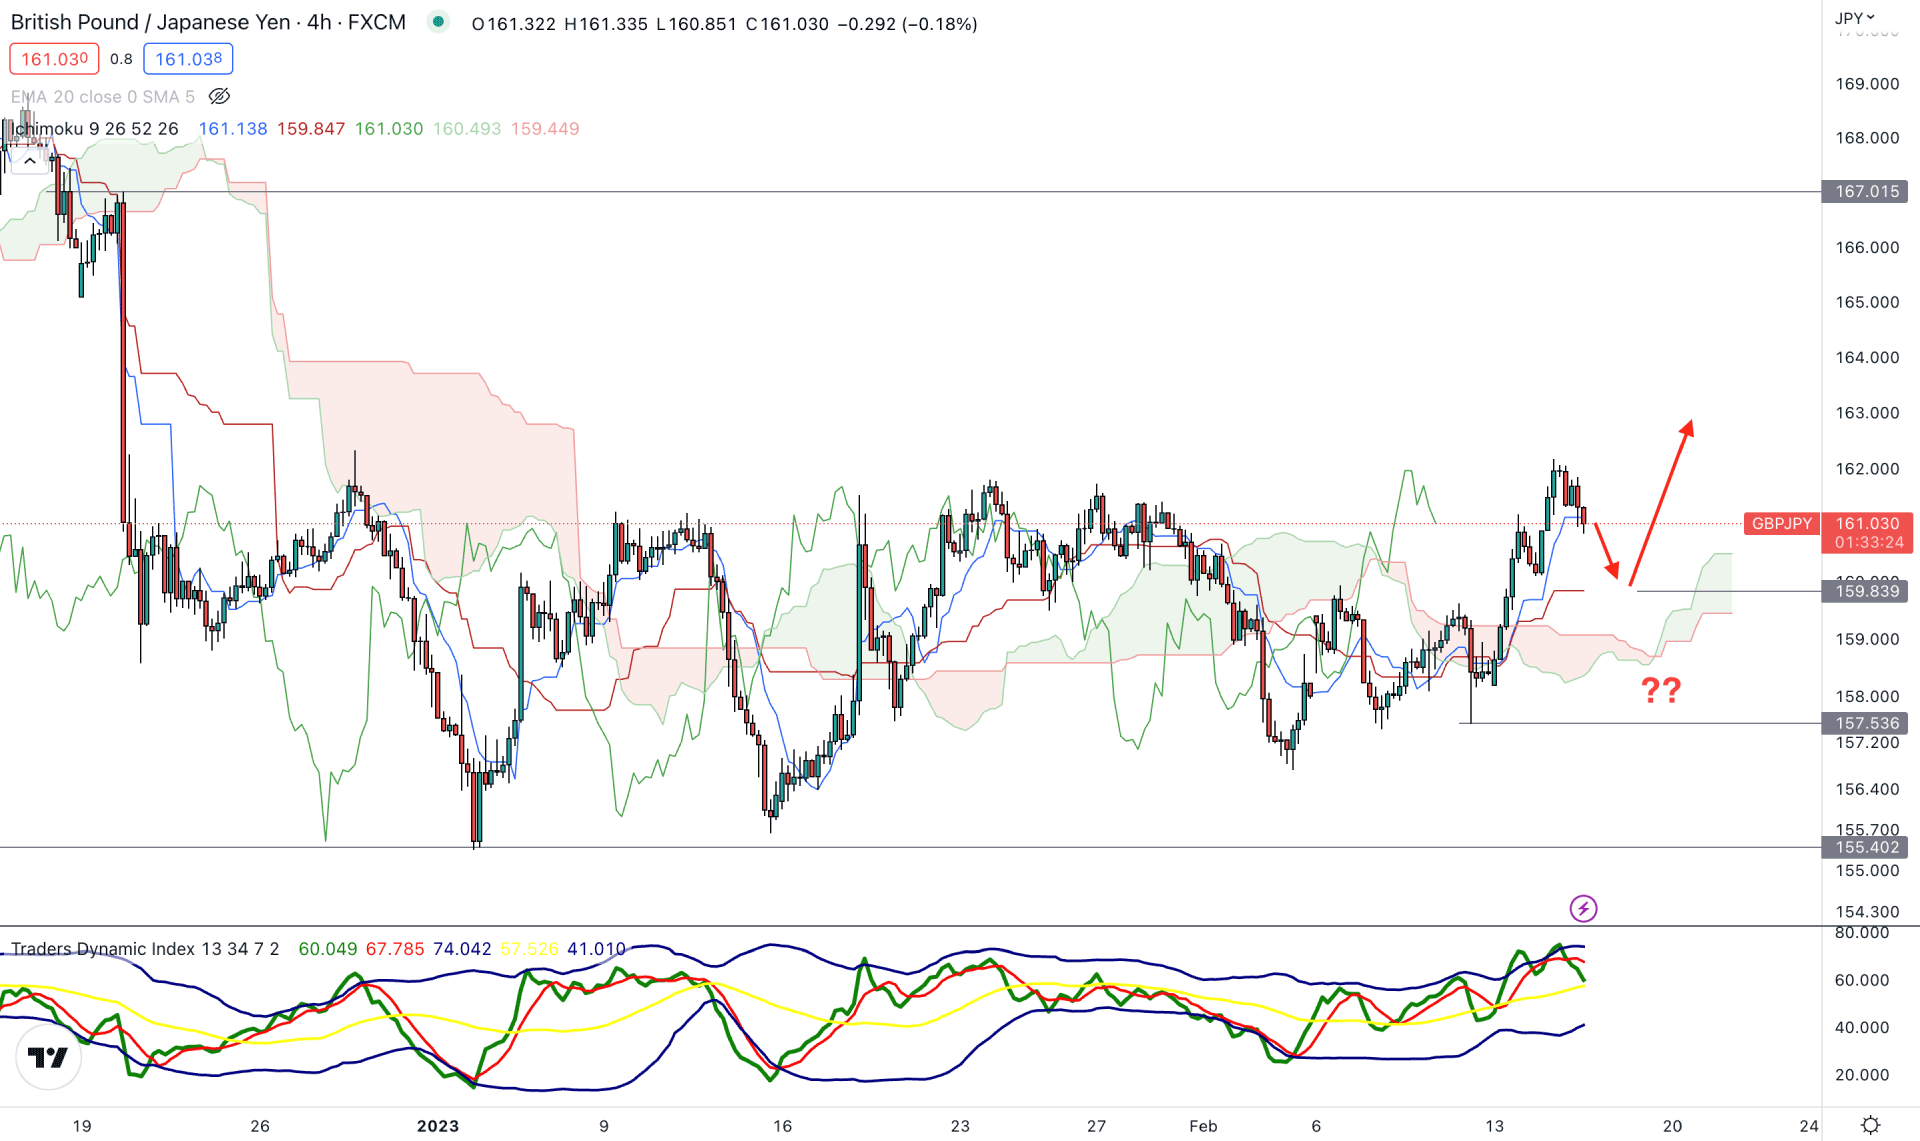
In the intraday chart, the corrective price action is visible with multiple violations of the Kumo Cloud. However, the current price seems stable above the cloud support, while the future cloud is bullish.
In the future cloud, the Senkou Span A is above B, while the gap between these levels indicates buying pressure. The Kijun Sen is below the price but above the cloud support with a flat pattern, while the current price is below the Tenkan Sen support.
The Traders Dynamic Index shows strong buying pressure as the current TDI level is stable above the 50% area.
Based on the current H4 price structure, a downside correction is pending in that pair, but any bullish rejection from the 159.83 Kijun Sen support or 158.57 Cloud support could offer a long opportunity. In both cases, the primary target is to reach the 165.00 key psychological level.
On the other hand, breaking below the 157.50 level with an H4 close could lower the price towards the 155.00 area.
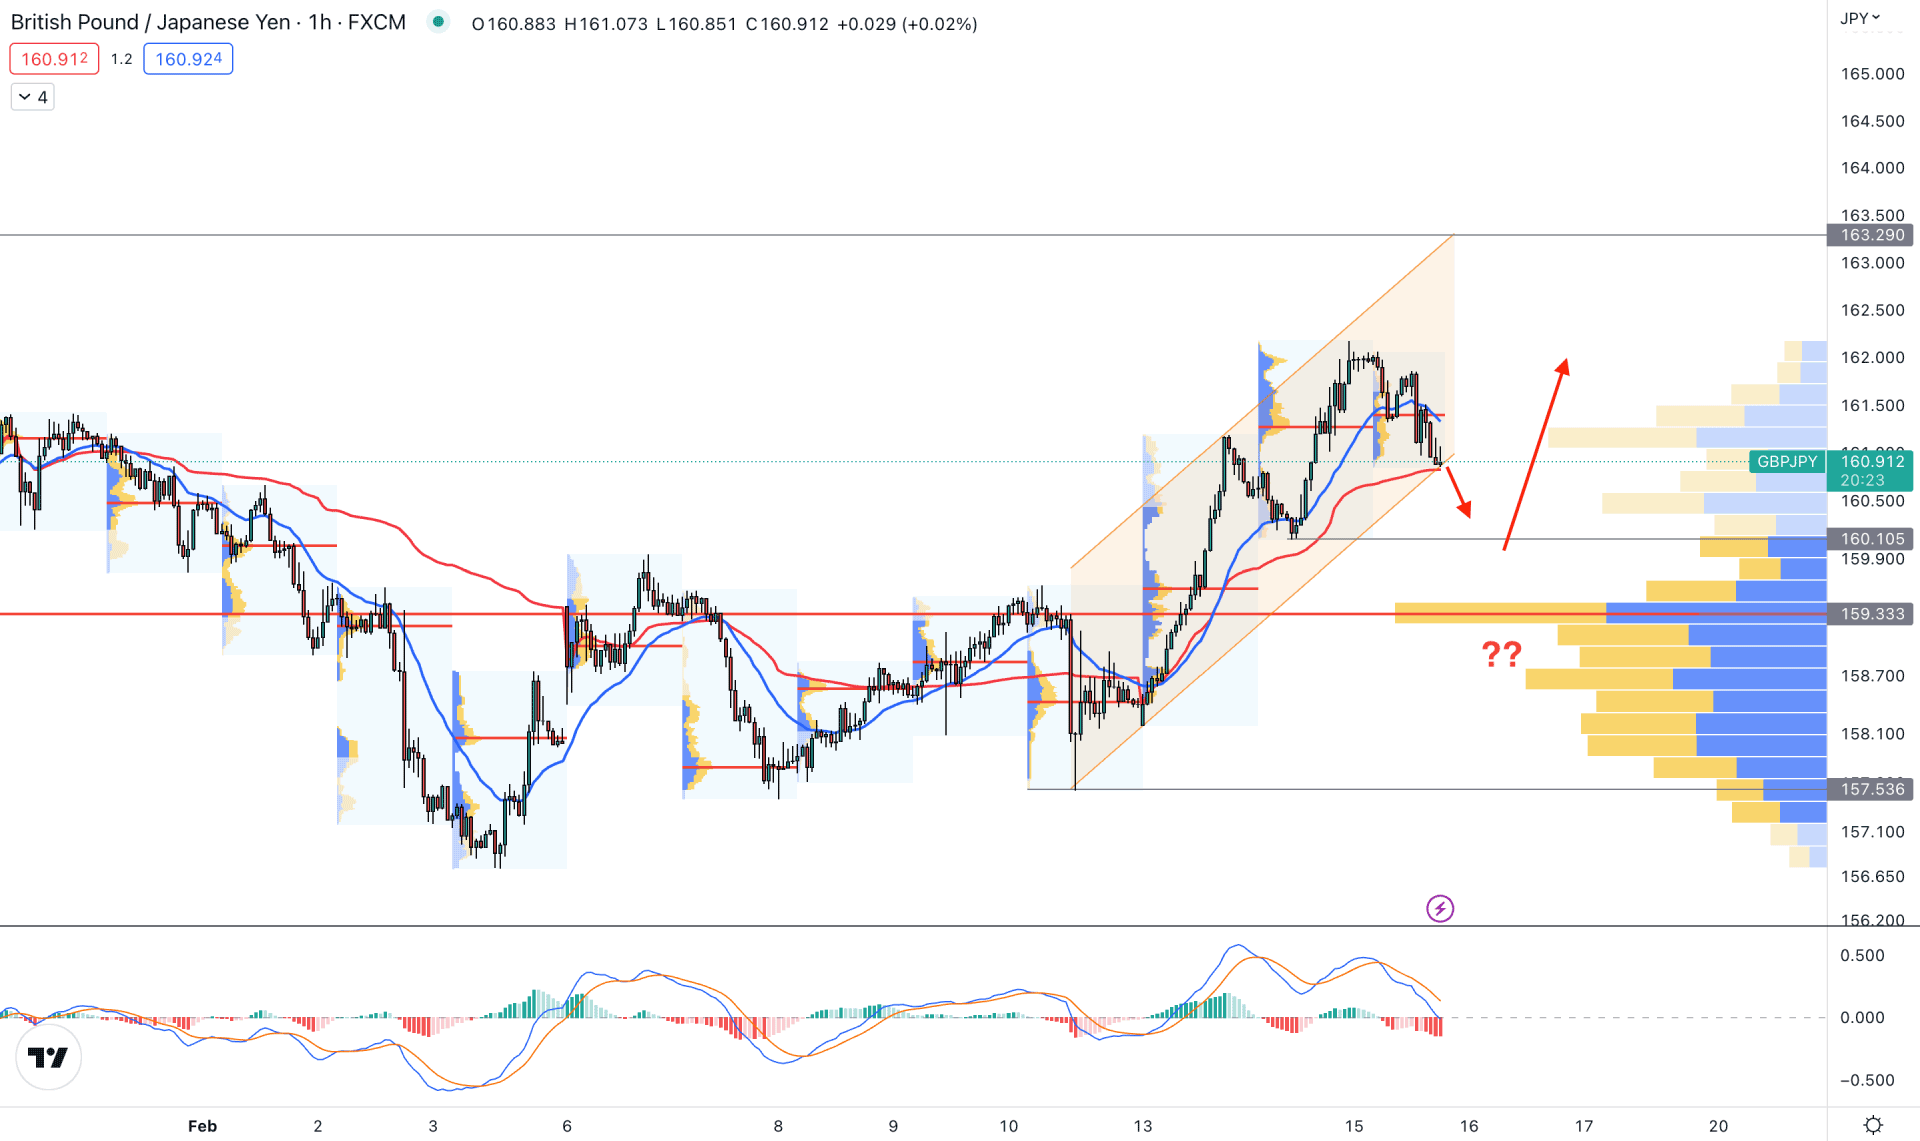
In the GBPJPY hourly chart, the current price is trading above the 159.33 high volume level. Therefore, any bullish opportunity from this price context could be a profitable option to make money.
An ascending channel formation is visible where the current price faces dynamic support from the VWAP. However, another dynamic level- 20 EMA is above the price while the near-term static support level is spotted at the 160.10 level.
The MACD Histogram is completely bearish, while MACD lines are ready to move down.
Based on this structure, the ideal buying approach may come from 161.00 to 159.33 area. Investors should closely monitor this zone to find a proper bullish rejection.
On the other hand, breaking below the 159.00 level with a candle close could increase the price volatility before forming another buying signal.
Based on the current price outlook, a proper bullish breakout from the rectangle pattern could resume the current bullish trend in the GBPJPY price. However, an early clue may come from the intraday chart, which may provide a buying opportunity with a pre-breakout structure.


