
Published: July 10th, 2025
The GBPJPY pair continued to rise for the third day of trading in a row. With the Japanese yen (JPY) still underperforming compared to its peers and US President Donald Trump imposing 25% tariffs on Japanese imports for not reaching an agreement during the 90-day tariff respite, the cross reaches a new annual high close to 199.85.
Japan, which has been continuously discussing bilateral arrangements with Washington for weeks. It has indicated that it is going to continue to do so, as one of the major countries that US President Trump sent letters to over the weekend specifying tariff rates.
Tokyo will continue talks with the United States to find a mutually advantageous trade agreement, Prime Minister of Japan, Shigeru Ishiba stated Tuesday, according to Reuters.
Tokyo's reluctance to embrace agricultural imports, particularly rice, has ruined progress in trade negotiations among the US and Japan.
Market projections that the Bank of Japan (BoJ) will increase interest rates this year are in jeopardy due to the increasing confusion surrounding the US-Japan trade pact.
Following the release of an increase in the welfare expenditure bill, the Pound Sterling is attempting to recover from a large decline last week caused by a strong increase in UK gilt yields. The yield on a ten-year UK gilt has risen to around 4.63%, which is the third-highest among wealthy countries.
Let's see the further outlook from the GBPJPY technical analysis:
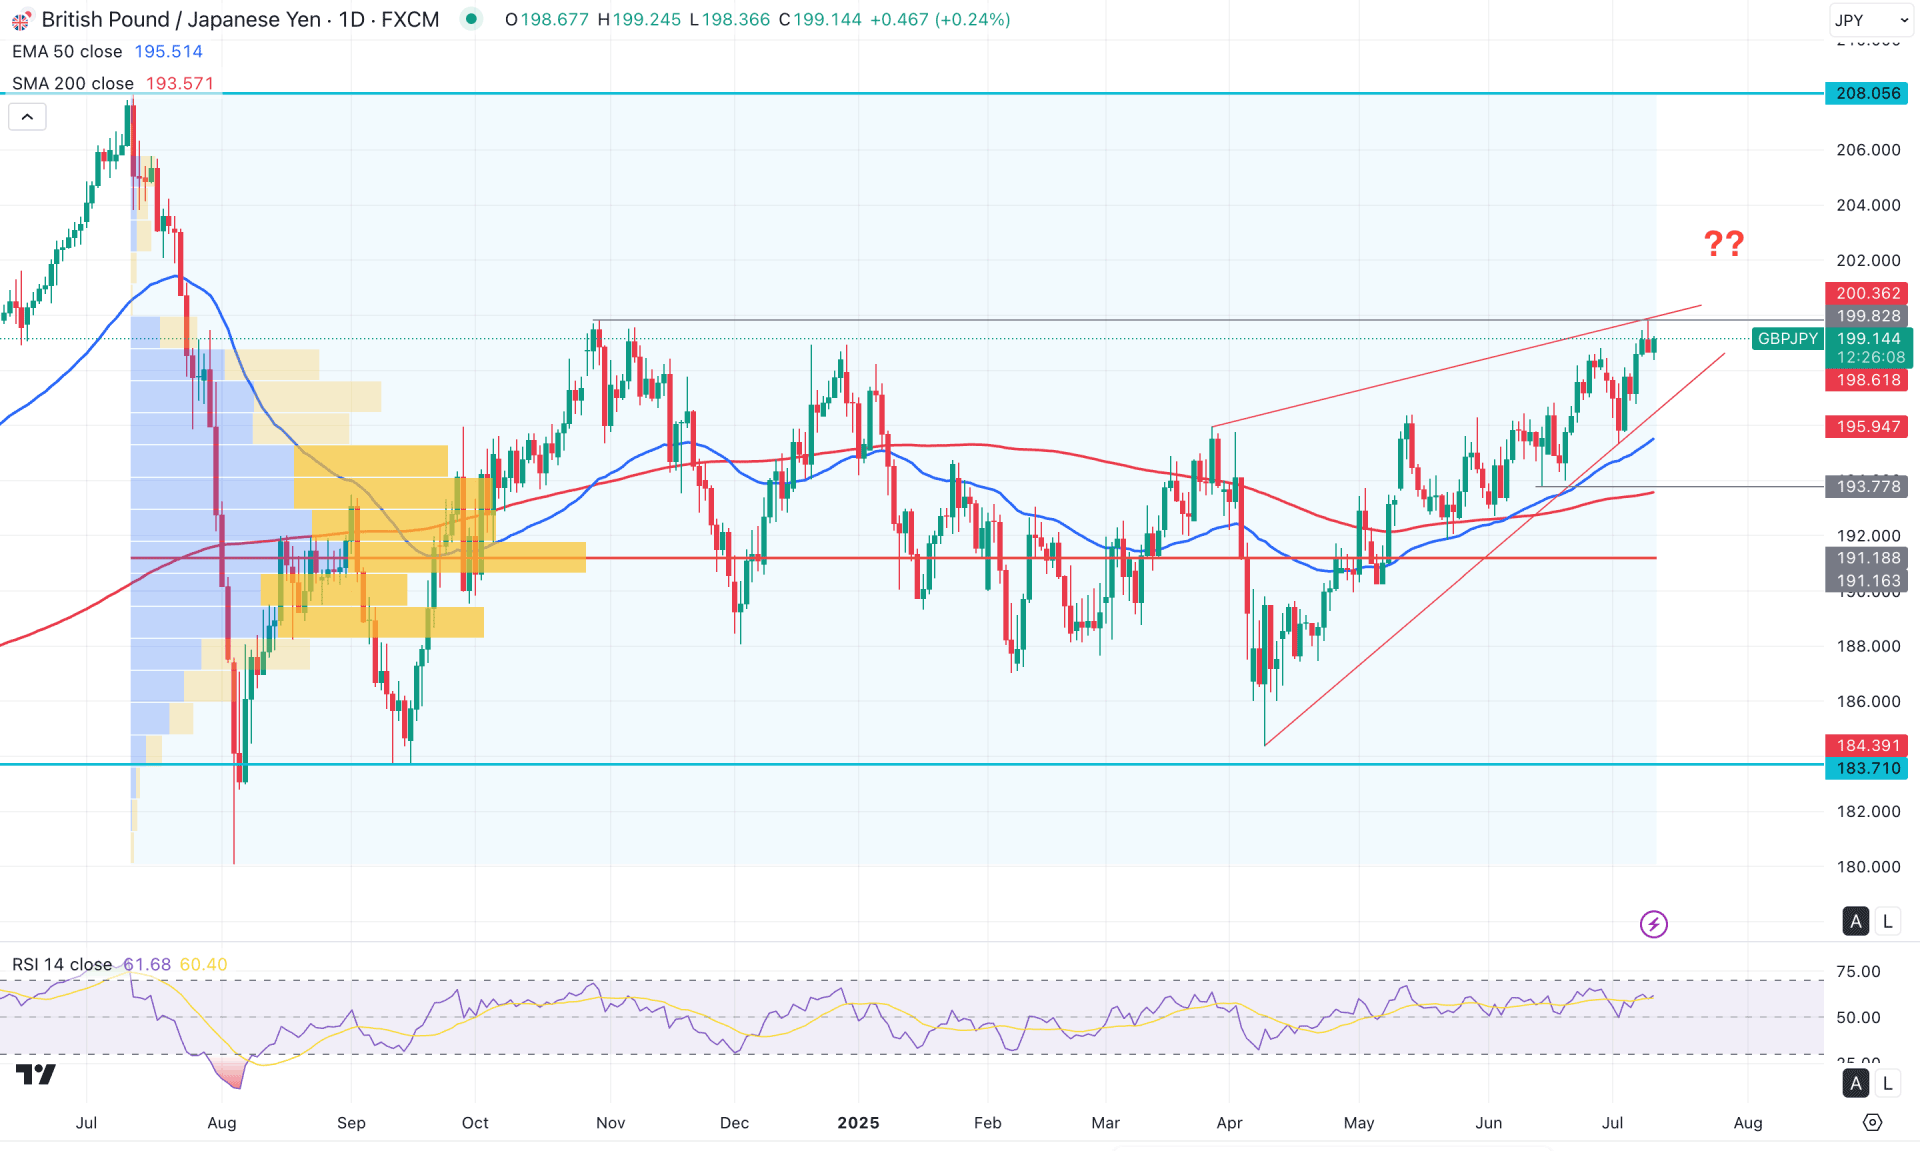
In the daily chart of GBPJPY, the ongoing price action is bullish with a sideways momentum. The price is moving within a rising wedge pattern, from which a potential downside correction may occur.
In the higher timeframe, ongoing buying pressure has been evident since the expansion in April 2025. The price reversed from a bearish phase and continued higher, breaking above the three-month consolidation range. The weekly price action also remains bullish, with consecutive bullish inside bar breakouts. However, the current structure since the April 2025 bottom appears sideways. In this context, investors should monitor how the price reacts as it approaches the crucial weekly resistance at the 199.85 level.
Looking at the volume structure, the price is trading within a long-term consolidation zone. No significant price change has been observed since January 2025. However, the most recent price action reached higher levels and found resistance at the October 2024 high, forming a double top pattern.
Although the high-volume level remains below the current price, investors should remain cautious about expecting continued upward pressure. The sideways momentum at the top, combined with a consolidation pattern, signals a high-probability bearish correction before a stable bullish trend can form.
In the main price chart, ongoing buying pressure is evident, as a bullish recovery is observed above the 200-day Simple Moving Average. Moreover, the 50-day Exponential Moving Average is also below the current price, acting as secondary support near the 196.75 swing low. As both dynamic support lines are positioned below the current price, the primary outlook favors long trades only.
On the other hand, the Relative Strength Index (RSI) has moved above the 50.00 level and is now moving sideways.
Based on the overall market outlook, a test of the 199.82 swing high, combined with a sideways RSI at the top, suggests a possible limitation to the ongoing buying pressure. However, the dynamic moving averages continue to support the bullish momentum, indicating indecision in the market.
Given this outlook, a strong bearish opportunity may emerge if the rising wedge pattern breaks down and the price stabilizes below the 193.77 level. In that scenario, a short opportunity could open, targeting the 186.00 psychological level.
Conversely, the price is currently trading near a crucial resistance, and any immediate bullish breakout above the 199.80 level, coupled with a liquidity sweep, could trigger a short-term recovery. In that case, a proper change-of-character formation could present an aggressive shorting opportunity, again targeting the 193.77 level.
On the bullish side, a correction is pending, and the wedge support suggests the presence of sell-side liquidity near the 50-day EMA area. Therefore, any downside move followed by a recovery from the 195.94–193.77 zone could offer a long opportunity, aiming once again for the 200.00 level.
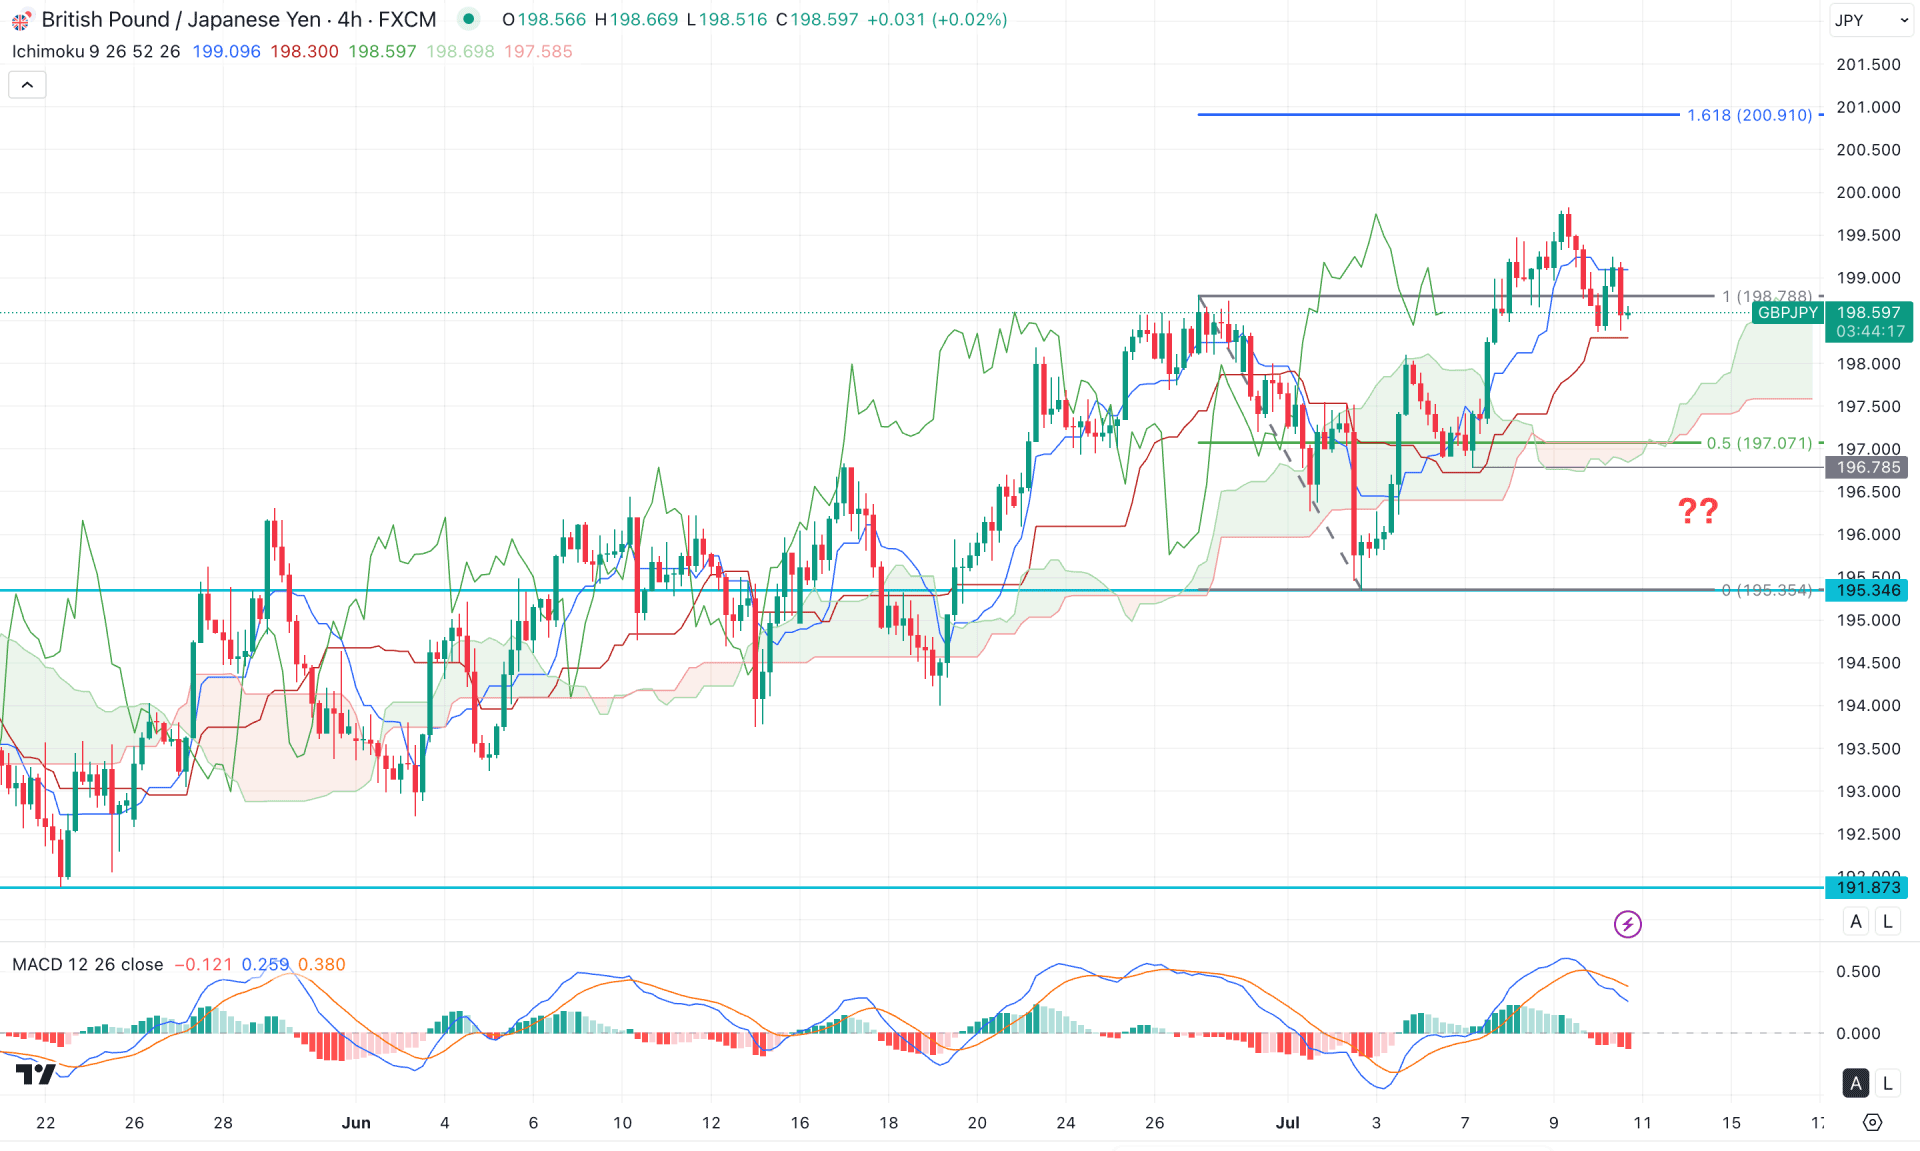
In the four-hour timeframe, a stable price is visible above the Kumo cloud area. Primarily, as long as the price trades above the 196.78 support level, a bullish continuation remains possible.
In the future cloud, both lines are pointing higher with strong thickness, indicating sustained bullish momentum. Meanwhile, the recent price is trading near the short-term dynamic lines, signaling a corrective phase in the price action. In the secondary indicator window, a bearish crossover has formed on the MACD signal line. Following the downside pressure, the MACD histogram continues to reflect bearish momentum by printing multiple negative bars below the neutral level.
Based on the overall market structure, a minor bearish correction is likely, where the price may dip below the dynamic support levels. However, a bullish recovery with a favorable candle formation above the Tenkan line may reintroduce buying pressure.
On the other hand, an extended selling pressure with a stable price below the 196.78 level may invalidate the bullish outlook and confirm a cloud breakout to the downside, potentially targeting the 191.87 level.
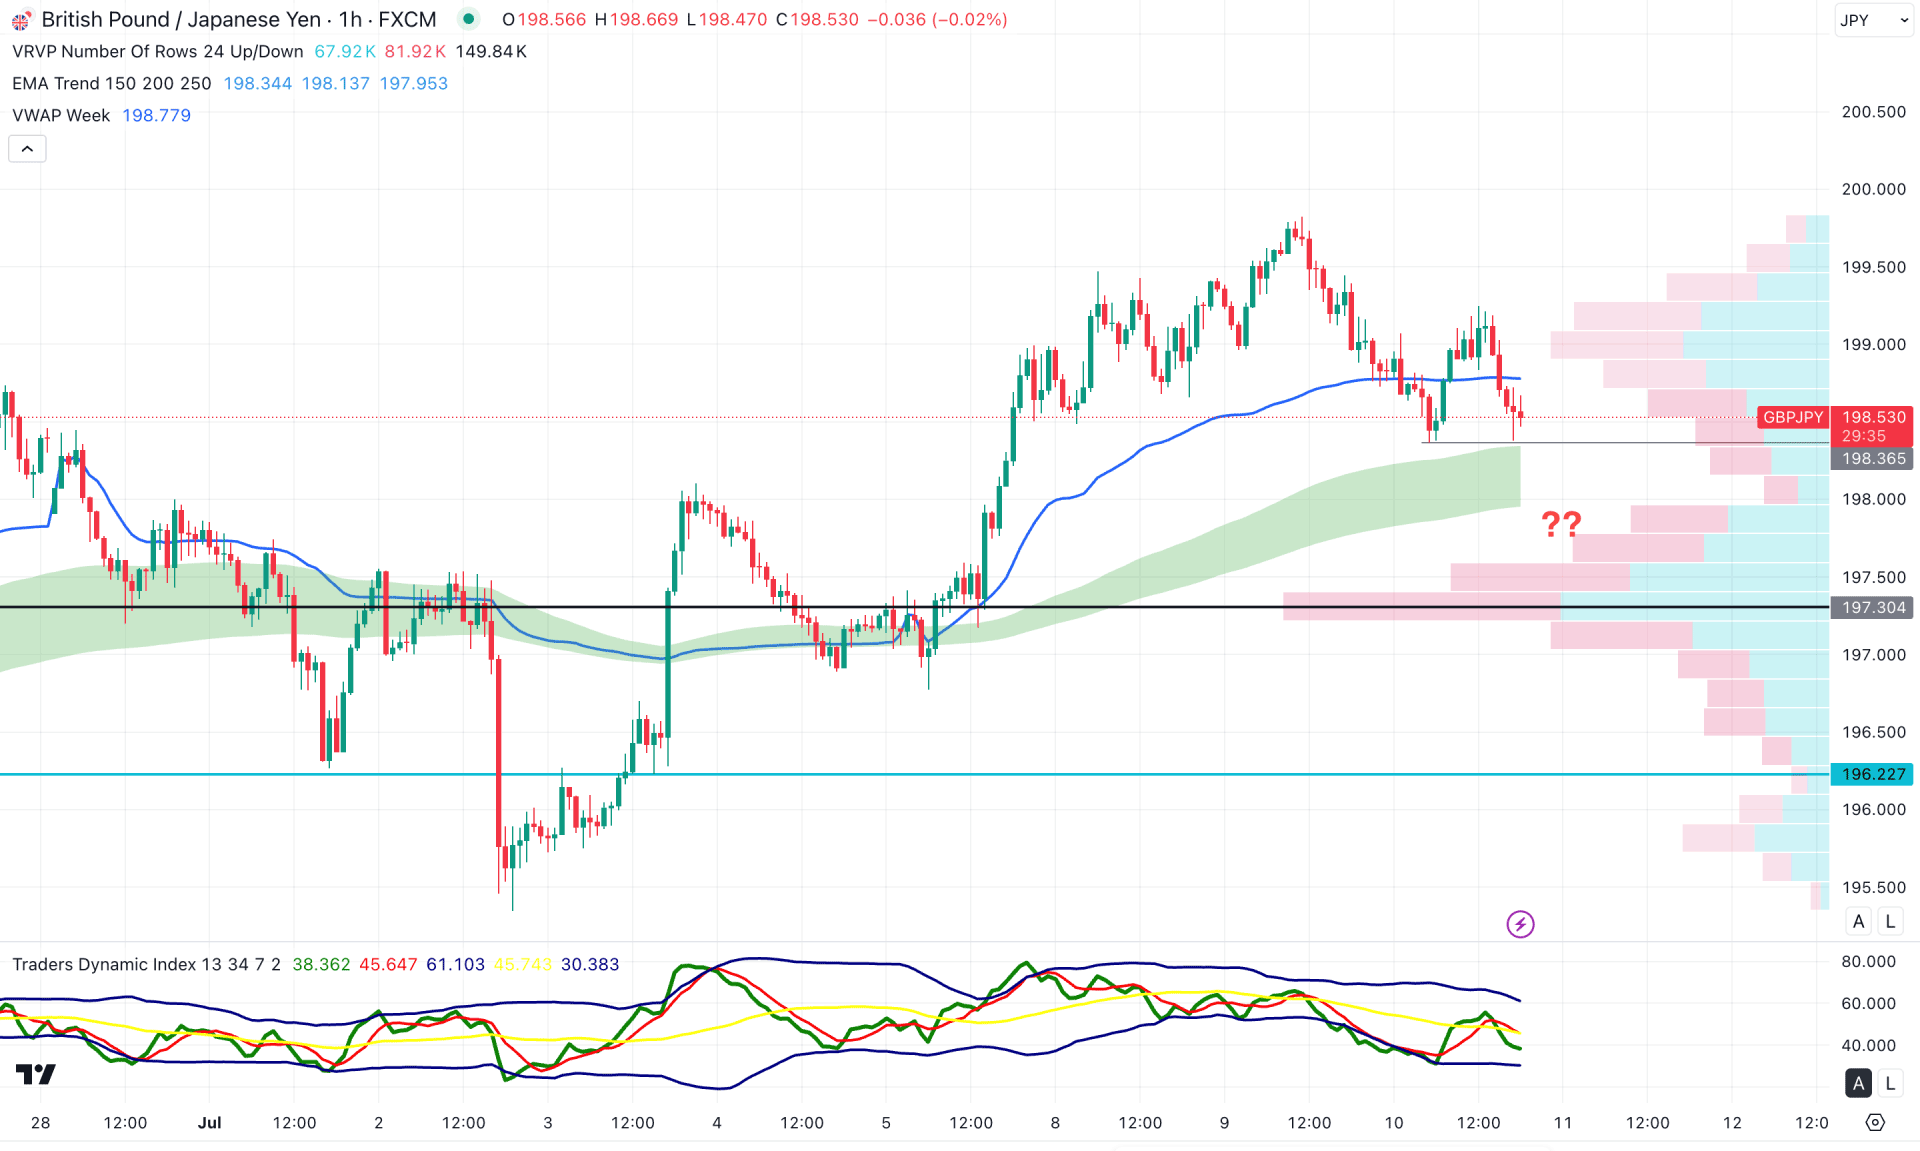
In the hourly chart of GBPJPY, the price is under selling pressure, as multiple hourly candles have formed below the weekly VWAP level. However, the high-volume line and the EMA wave are still below the current price, indicating underlying bullish traction.
In the secondary indicator window, the downside pressure is reflected in the Traders Dynamic Index. The midline of the indicator rebounded from the lower band but failed to sustain momentum above the 50.00 level. This indicates that buyers attempted to regain control, but failed.
Based on this outlook, the intraday market pressure remains bearish, with the 198.36 level acting as immediate support. A break below this near-term static level, confirmed by a strong bearish candle close, could push the price lower to test the 197.30 high-volume area.
Alternatively, if the market grabs sell-side liquidity from the 198.36 to 197.50 zone and shows a bullish recovery above the VWAP level, the upward continuation momentum may resume, potentially driving the price beyond the 200.00 psychological barrier.
Based on the overall market momentum, GBPJPY is currently experiencing intraday selling pressure, while the long-term trend is approaching a crucial resistance zone. In that case, any drop-base-drop formation on the intraday chart could offer a short-term selling opportunity. However, a longer-term bearish move might only materialize after a confirmed wedge breakout.


