
Published: January 25th, 2024
Early in January, the UK PMI data indicated a significant upswing in economic activity within the private sector. According to a prominent analyst, the Bank of England (BoE) may be dissuaded from expeditiously implementing expected interest rate reductions due to this strong performance.
Supply disruptions in the Red Sea have contributed to the resurgence of inflation in the manufacturing sector, further complicating the BoE's prospective decision-making.
On the other hand, the Japanese Yen (JPY) encountered a modest depreciation against its counterpart on Thursday, retracing from a peak of one week that had been observed the day prior. The additional monetary stimulus measures announced by the People's Bank of China (PBoC) on Wednesday enhanced global risk sentiment.
In the economic calendar, the Tokyo Core CPI Y/Y is expected to be released on Friday, where the current expectation is an increase of 1.9% from 2.1%.
Let’s see the upcoming price direction from the GBPJPY technical analysis:
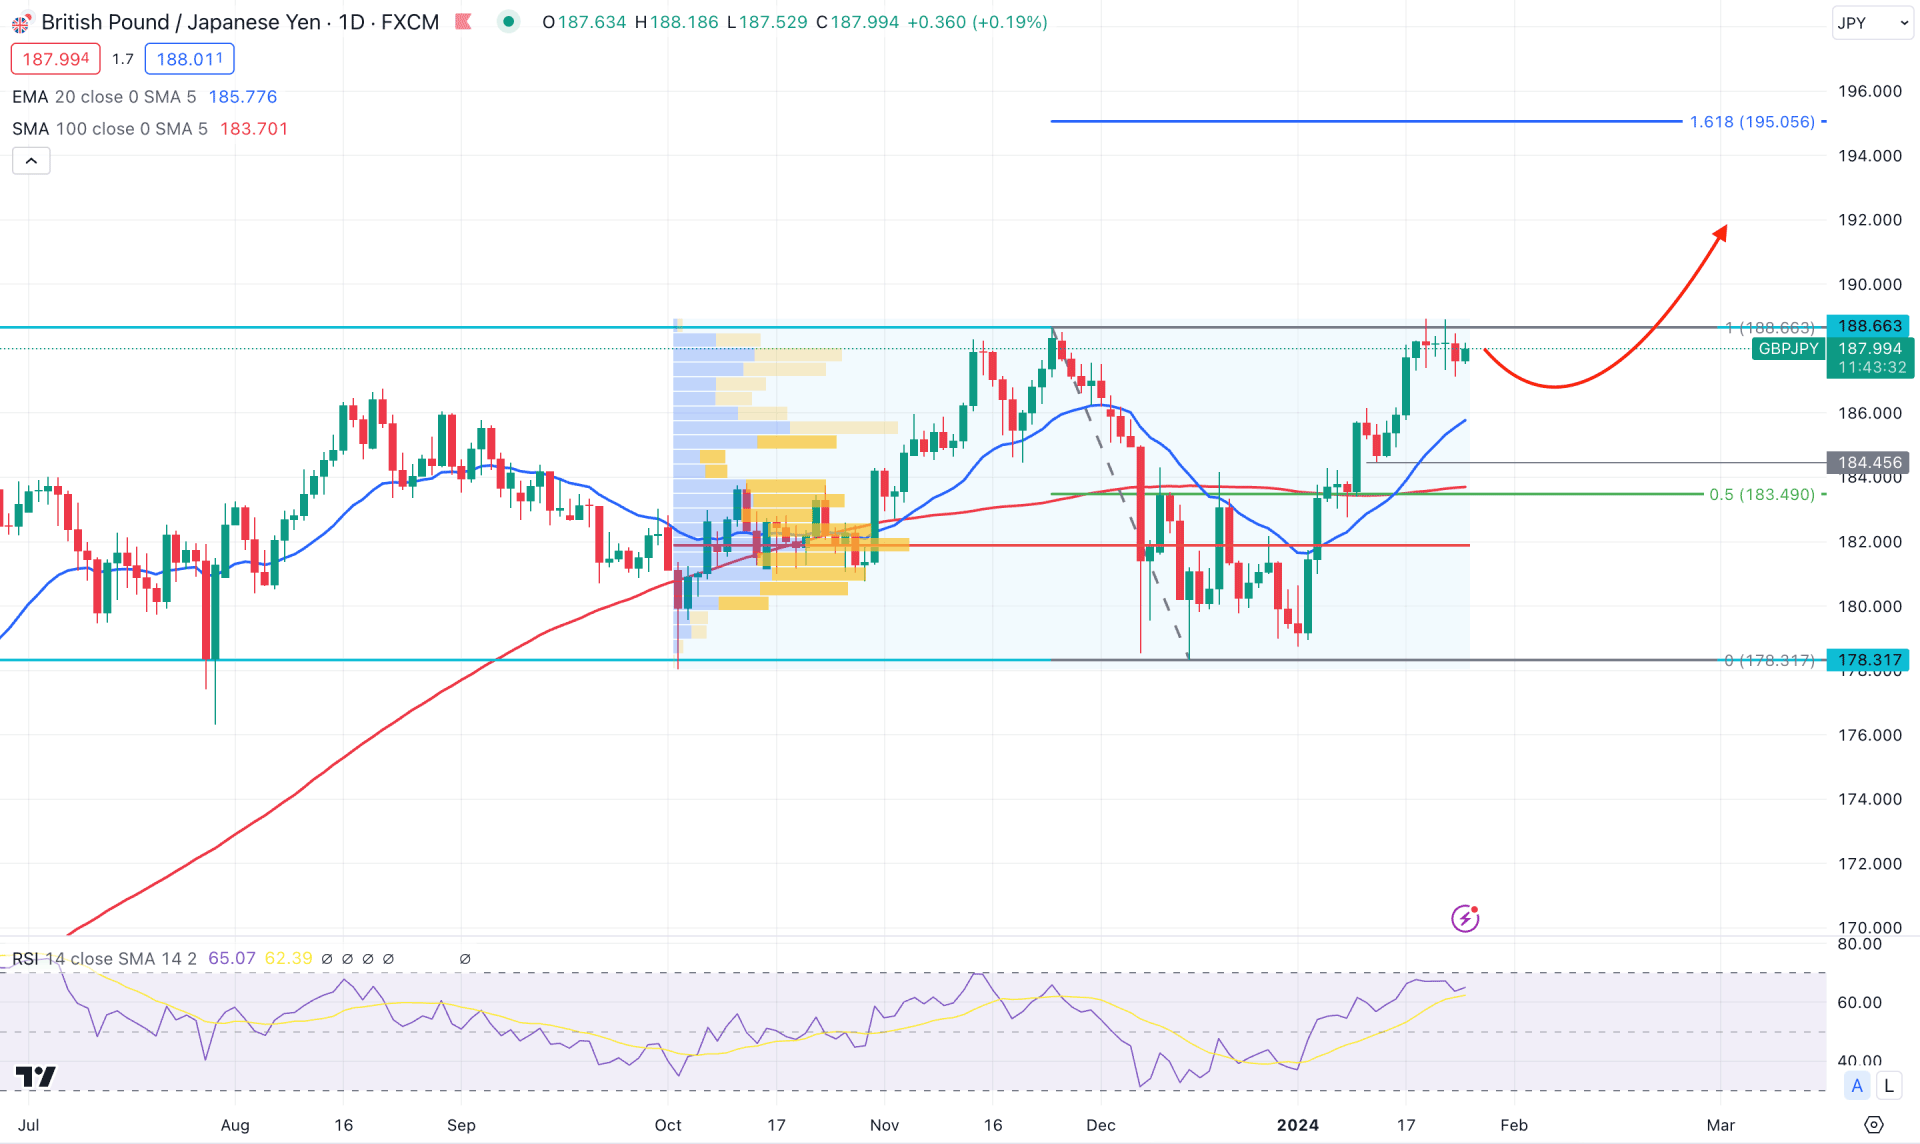
In the daily chart of GBPJPY, an ongoing bullish continuation is visible, where the current price is trading at the crucial resistance level. In this structure, the ideal trading approach is to look for a long opportunity from the near-term support area.
In the monthly chart, the selling pressure in December 2023 is completely eliminated in January with an ongoing bullish two-bar continuation. In that case, if the January close comes above the December high, we may expect a strong bullish continuation in the coming month. A similar market outlook is visible in the weekly chart, where an ongoing buying possibility is visible from the 178.31 bottom.
In the volume structure, the most active level since October 2023 is at the 181.92 level, which is below the current price. As per the market outlook from the volume structure, an ongoing buyers’ accumulation is visible, suggesting additional bullish opportunities.
In the main chart, the rising 20-day EMA and 100-day SMA formed a bullish crossover, suggesting a long opportunity. Moreover, the 14-day RSI shows an ongoing long signal as it remains steady above the 50.00 line.
Based on the daily outlook of GBPJPY, investors should monitor how the price trades at the 188.66 resistance level. As the recent price consolidates at the critical resistance level, we may expect a strong bullish signal after overcoming the 189.00 psychological level. In that case, the next resistance could be found at the 192.00 area.
On the bearish side, a downside continuation with a bearish daily close below the 184.45 support level could signal sellers’ presence in the market. In that case, a short opportunity could come, aiming for the 182.00 area.
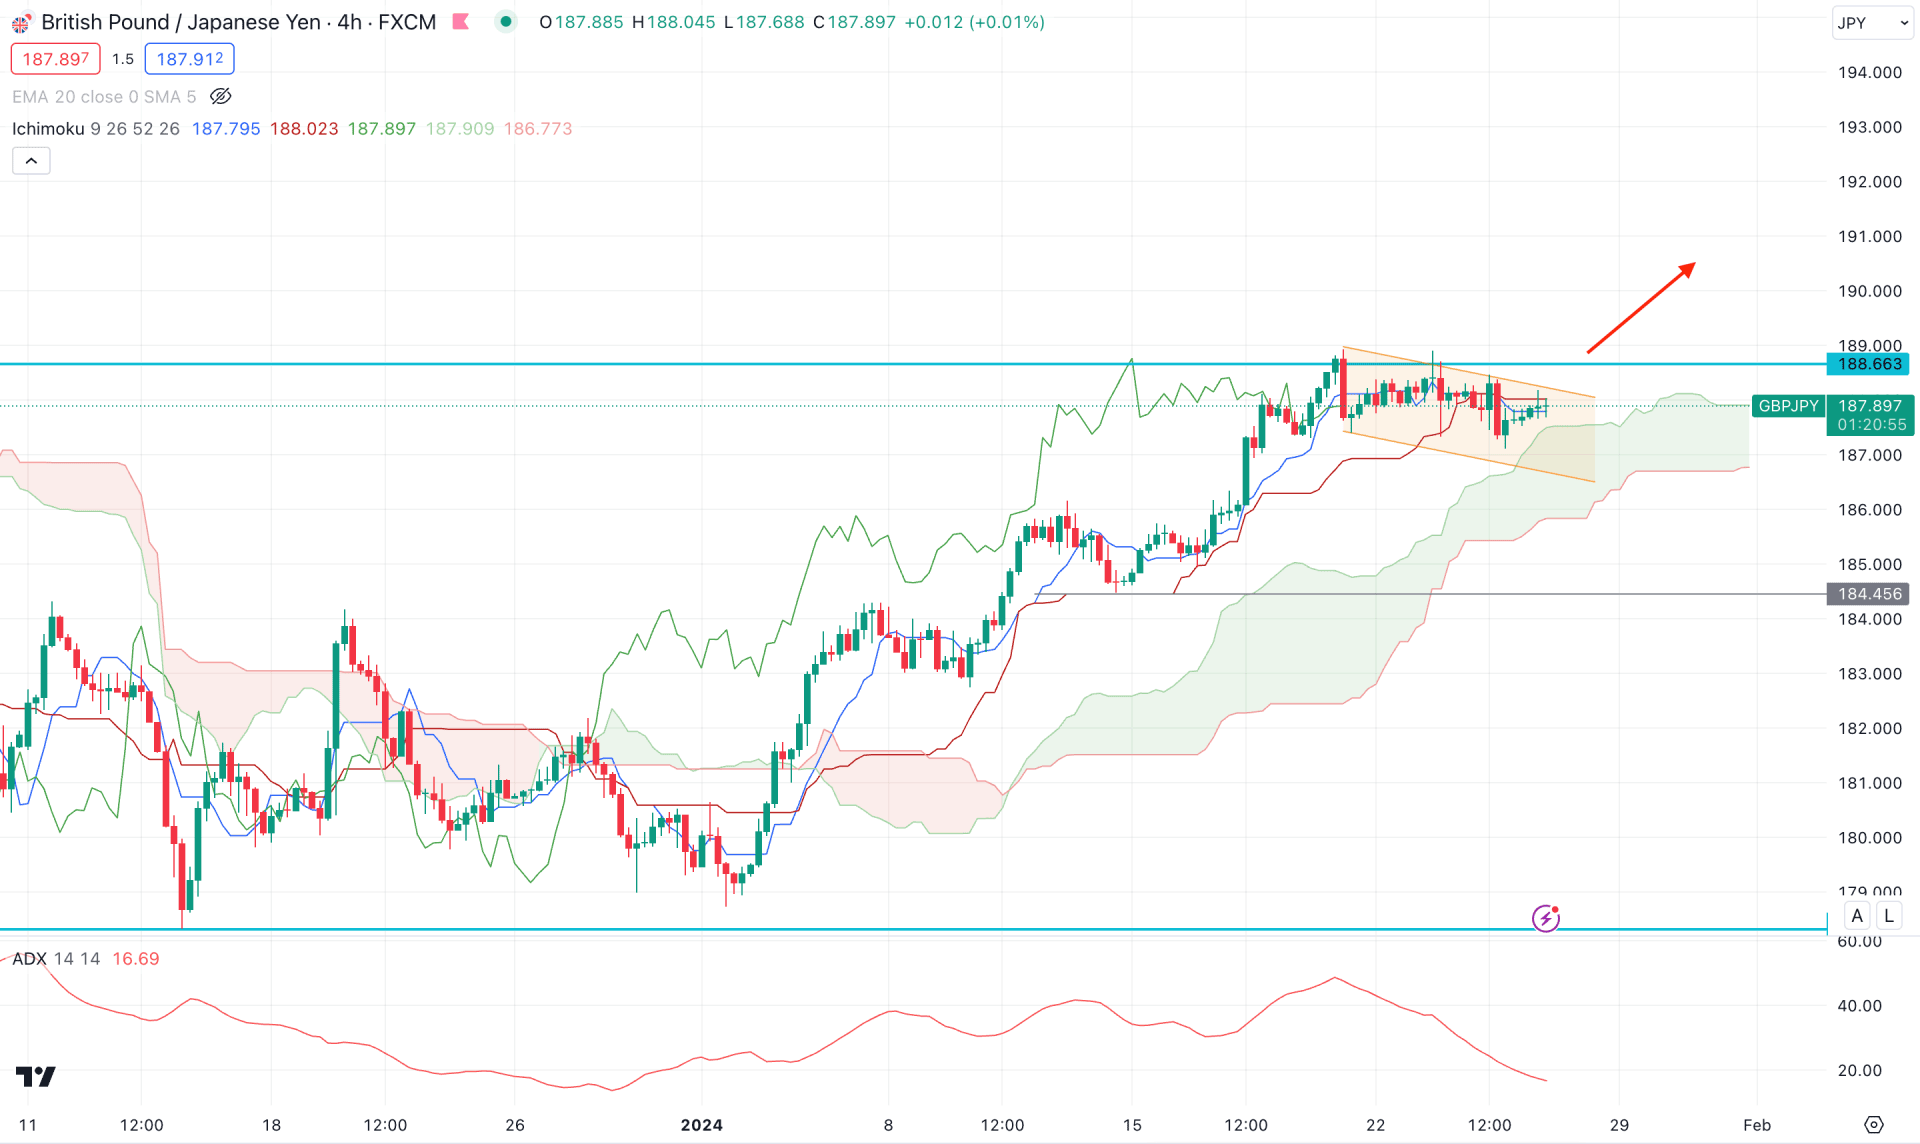
In the H4 timeframe, the ongoing buying pressure is potent as the recent price trades sideways above the Ichimoku Cloud zone. Moreover, the future cloud has an upward slope in both lines, supporting the bullish continuation.
In the secondary window, the Average Directional Index (ADX) moved below the 20.00 line suggesting a corrective trend. Moreover, the dynamic Kijun Sen is working as a support as it remains below the current price area.
Based on the H4 structure, a bullish continuation might come after the descending channel breakout. Therefore, the ideal long signal might come after an H4 close above the 188.66 resistance level.
On the other hand, a downside continuation might come from the dynamic Senkou Span B support but an H4 close below the 186.00 level could lower the price in the coming days.
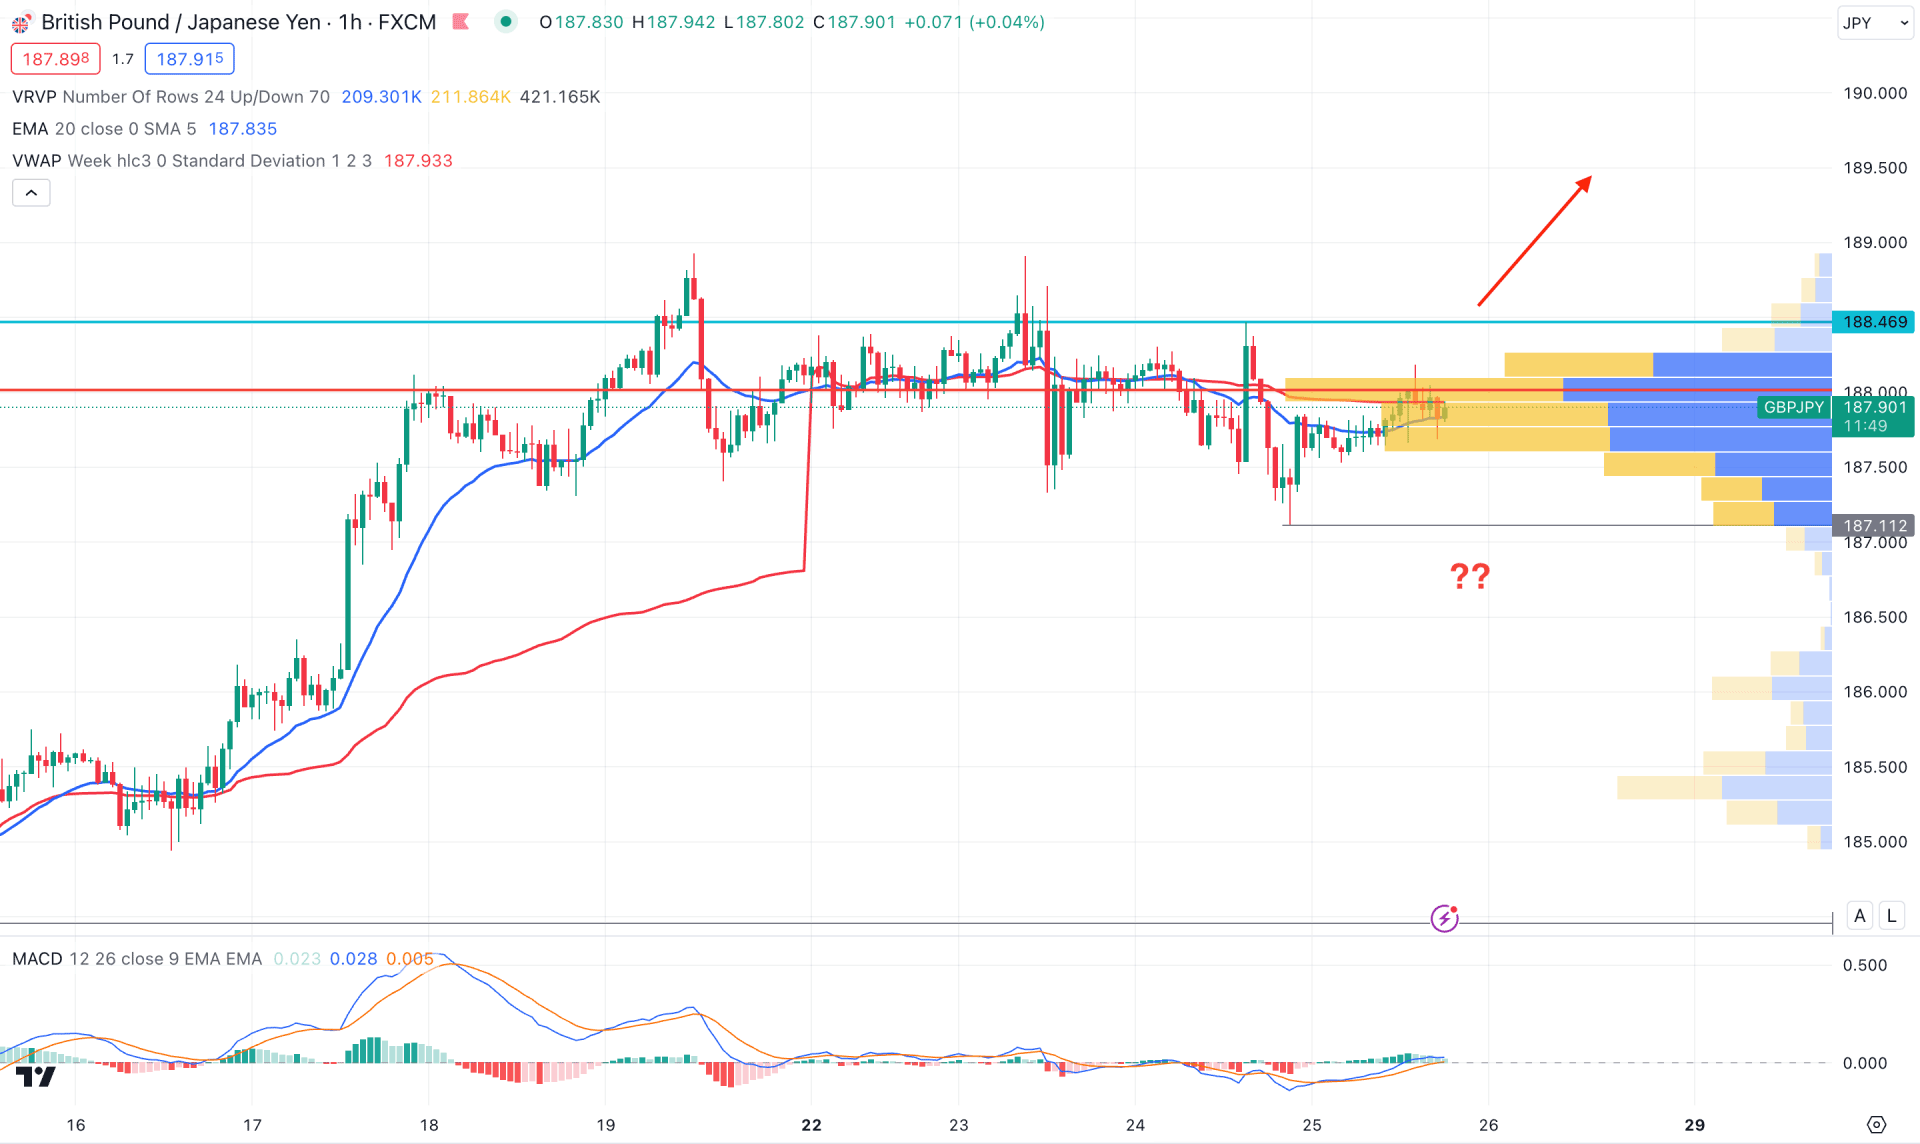
In the hourly chart, the GBPJPY price is trading below the visible range high volume level suggesting that sellers are active in the intraday chart. Moreover, the dynamic 20 EMA and weekly VWAP are closer to the current price, indicating a corrective price action.
In the secondary window, the MACD Histogram remained bullish, while the signal line formed a bullish slope above the neutral area.
Based on this structure a highly probable bullish opportunity might come after having an hourly close above the 186.46 high. However, ongoing selling pressure might extend at the 187.11 support level below forming another long opportunity.
Based on the current multi-timeframe analysis of GBPJPY, the broader market trend is bullish and investors might expect a trend continuation in the higher timeframe. However, an early trading opportunity might come from the intraday chart, depending on the price action at the support area.


