

Published: October 8th, 2026
In the UK, markets are currently pricing in roughly 30 basis points of Bank of England rate hikes by the end of this year, with expectations for around 90 basis points of tightening by the end of 2027.
Recent comments from BoE officials, including Governor Andrew Bailey, suggest a growing willingness to consider further rate increases should elevated energy prices persist. The concern is that prolonged energy costs could keep inflation above the central bank's target for an extended period.
Sterling also received a boost from Prime Minister Andy Burnham's support for strengthening the UK's relationship with the European Union ahead of a summit reportedly expected around 20 November. Discussion has even emerged around the possibility of revisiting EU membership ahead of the next general election.
Meanwhile, the Yen remains under pressure as Brent crude continues to hold above the $100-per-barrel level. A survey found that oil-market volatility is the biggest risk facing Japanese companies, with 37% of respondents citing it as their primary concern. Currency fluctuations were cited by 21%, while 19% pointed to the impact of higher Bank of Japan interest rates.
However, the Yen has found some support as investors reassess which currencies are most attractive for carry trades. The euro is increasingly being used as a funding currency, while France's fiscal difficulties are triggering capital outflows and weighing on the single currency.
Let's see the further aspect of the GBPJPY technical analysis:
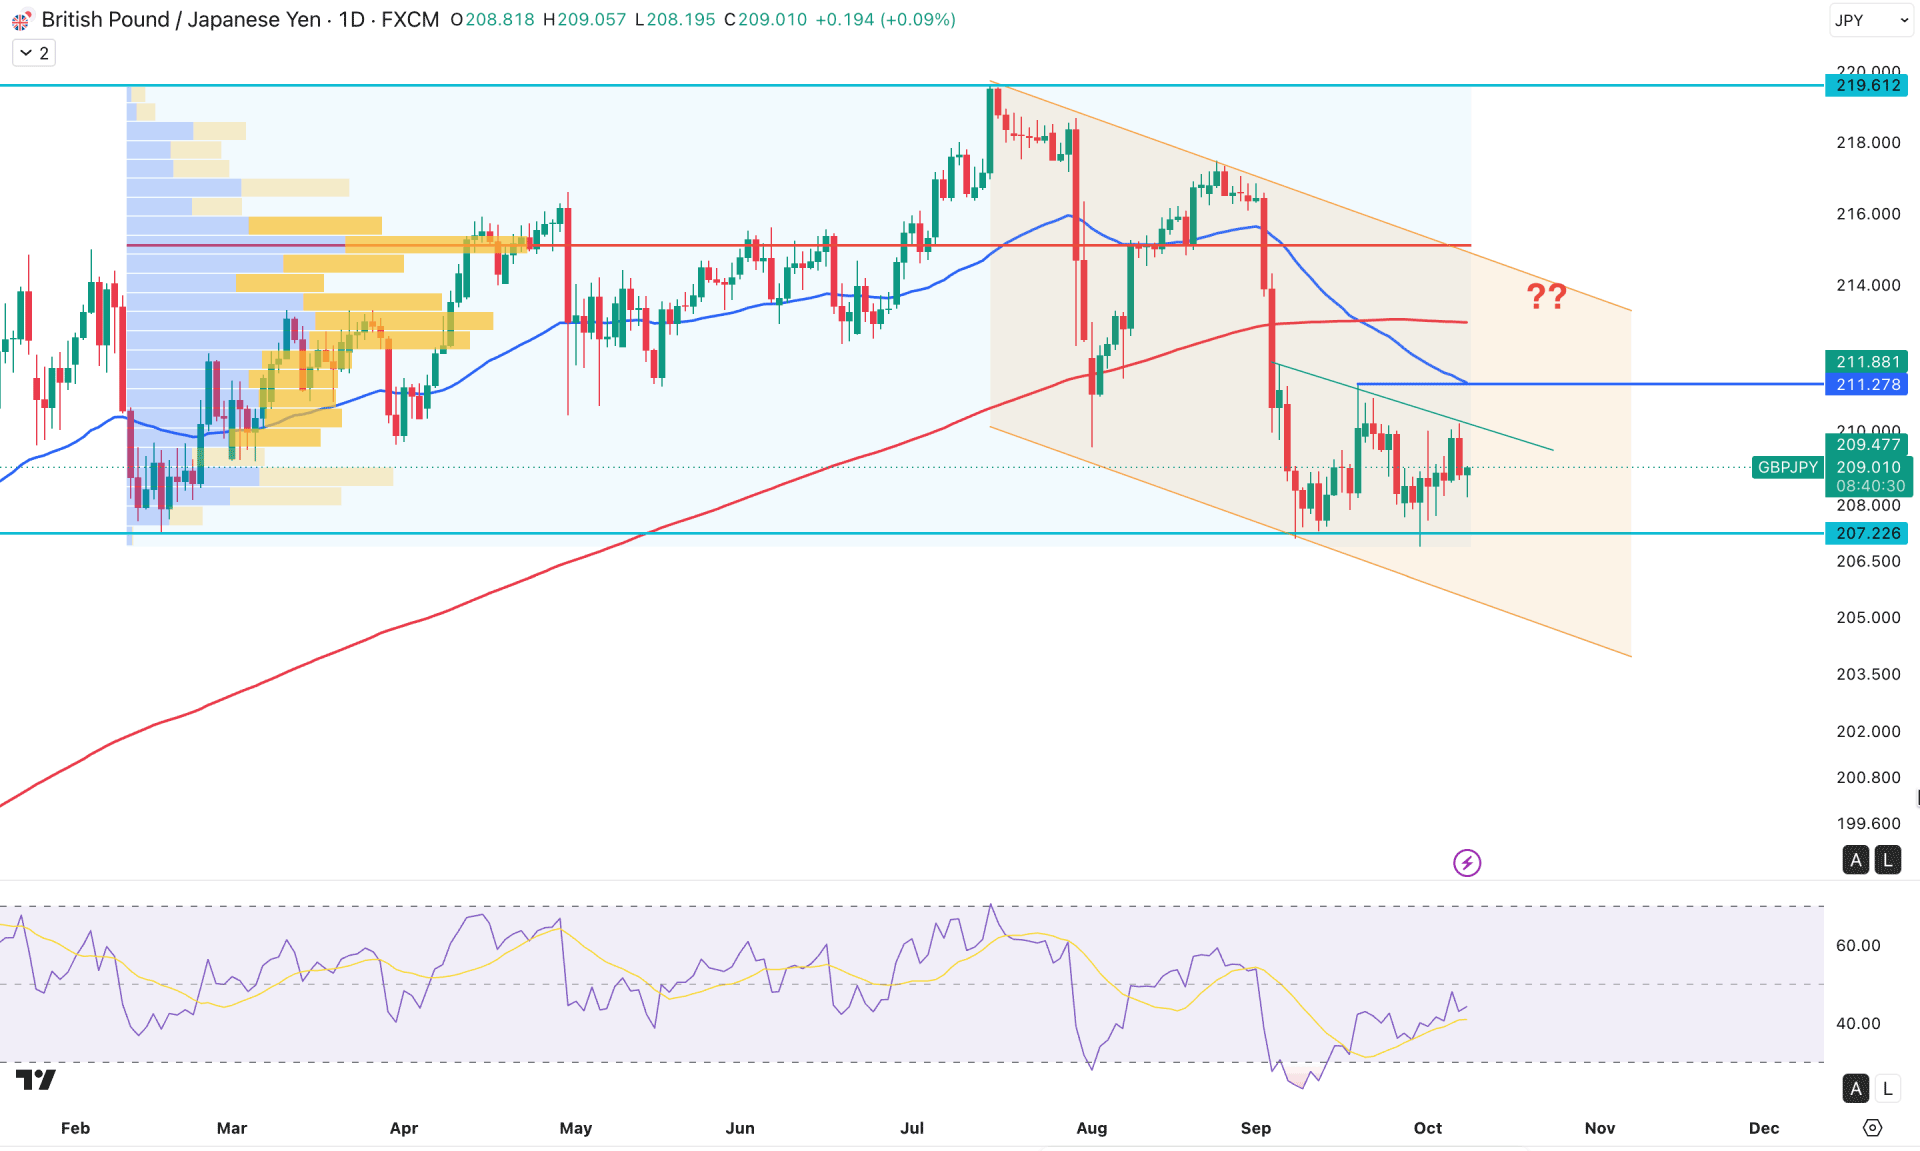
In the daily chart of GBPJPY, the recent price is sideways at the top from where a valid downside correction is visible. As the price approaches key support levels, investors are keen to know whether it is the right time to open a long position in line with trend continuation momentum.
Looking at the higher timeframe, the monthly candle suggests extreme bearish pressure as a bearish engulfing candlestick is visible, eliminating gains from the last five months. The weekly timeframe is also trading at the bottom that came after valid bearish pressure. It is a sign of no significant bullish activity from the discount area, signaling heavy selling pressure in the market.
In terms of the volume outlook, sellers are still favored, as the largest volume activity level since February 2026 is above the current price. Moreover, the recent price approached a crucial yearly low from where no significant buying activity is seen.
On the main price chart, a death cross formation is clear as the 50 EMA is having a bearish crossover with the 200 SMA. Following consecutive bearish drops, the price is trading sideways at the bottom, which signals ongoing selling pressure.
In the indicator window, the Relative Strength Index (RSI) has reached the 30.00 oversold line and is currently hovering at the 50.00 neutral area.
Based on this technical outlook, a downside continuation or a new trend resumption is possible following a valid bearish breakout.
Primary bullish continuation is possible as long as price maintains buying pressure above the 207.22 key support level. In that case, a bullish recovery above the 201.27 swing high with a daily close above the 200 SMA could be a potential long opportunity targeting the 219.61 resistance level.
Meanwhile, the price is already trading sideways below the 50 EMA level. In that case, a sell-side liquidity grab from the descending trendline resistance, with a failure to hold momentum above the 50-day EMA, could be a potential short opportunity.
Although the failure to overcome the 50-day EMA could be a short opportunity, a more confirmed bearish signal might come after breaking below the 207.22 support level. In that case, the downside continuation momentum might open with the aim of testing the 200.00 psychological level.
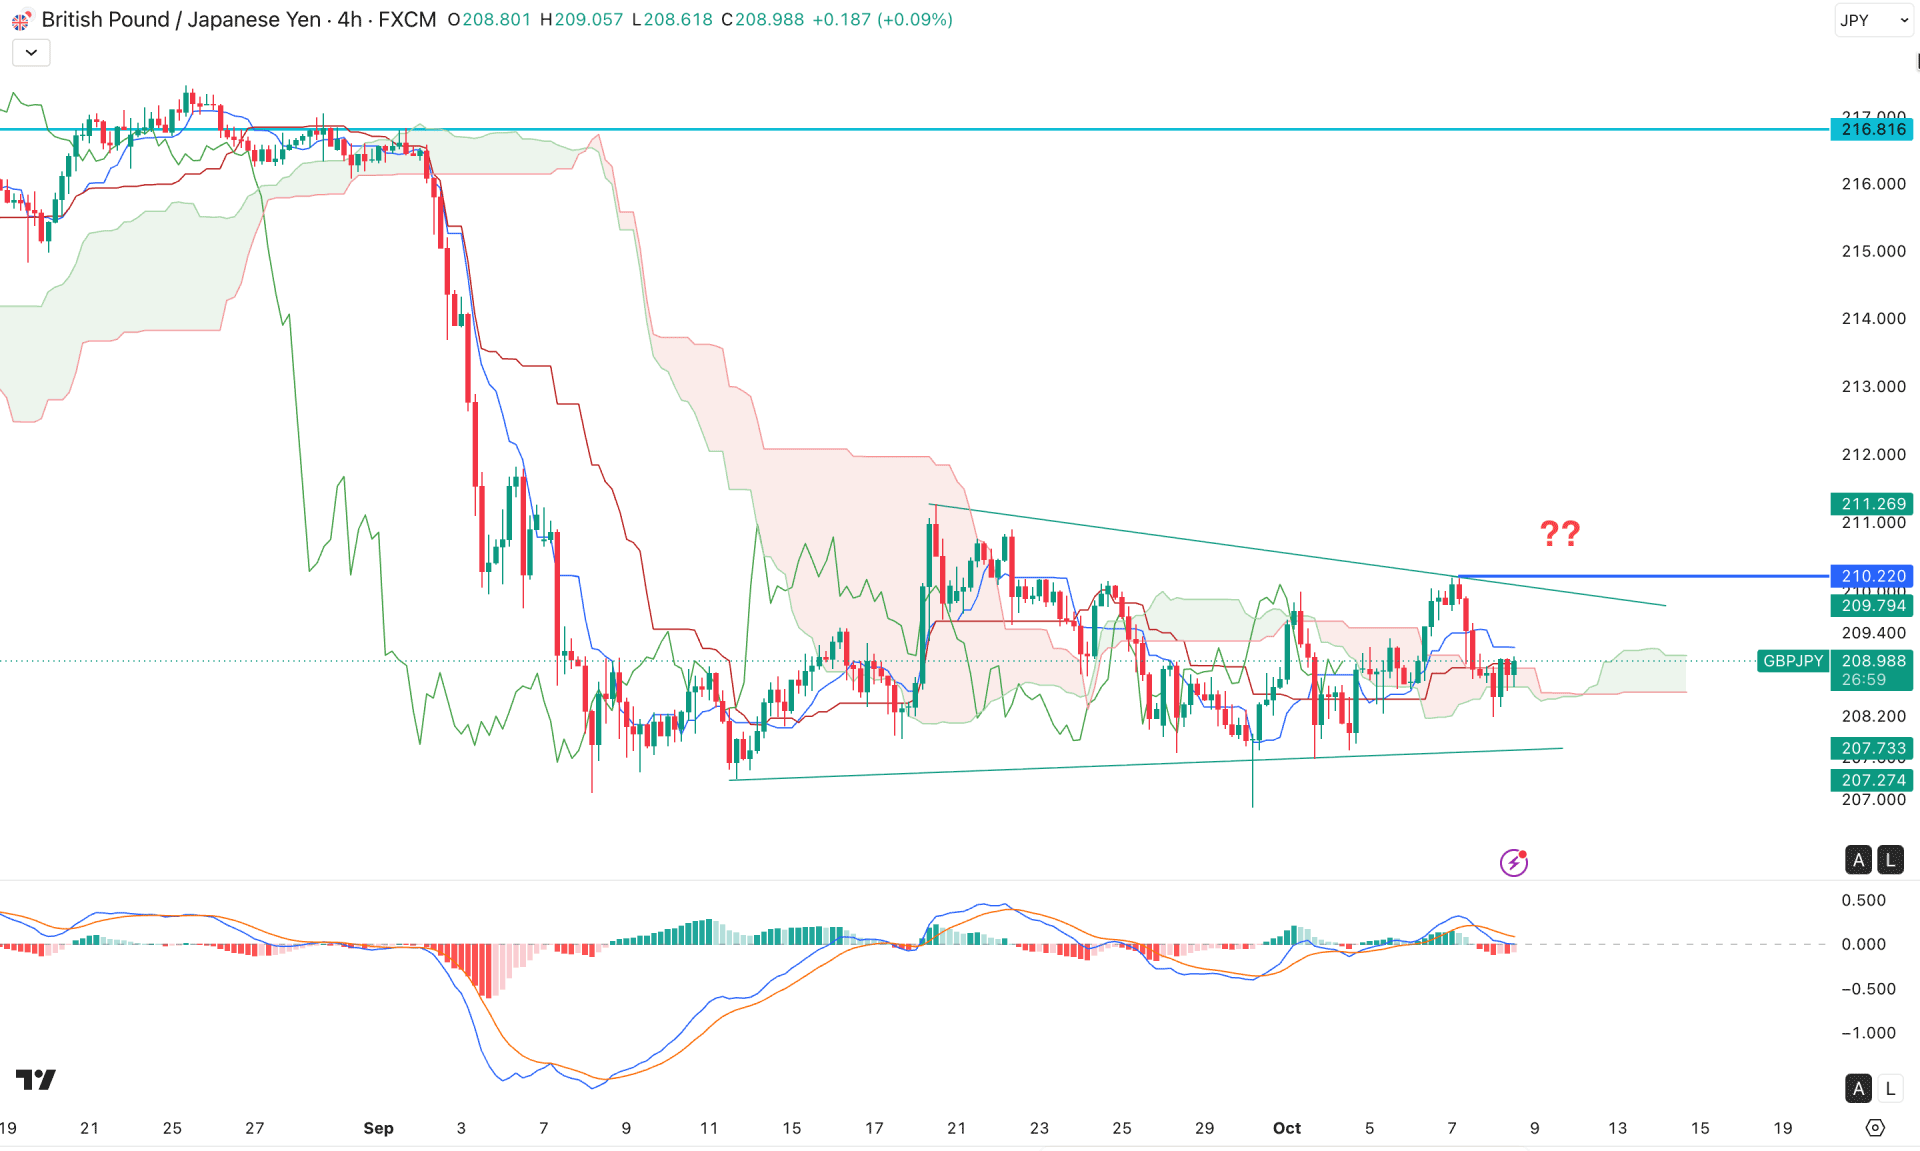
In the four-hour timeframe, GBPJPY is trading within sideways momentum as multiple rejections are seen at the Kumo Cloud area. However, the market momentum is bearish and impulsive. In this context, the ongoing sideways momentum after massive selling pressure signals a possible bearish continuation as a drop-base-drop pattern.
In the secondary indicator window, the MACD signal line formed a bearish crossover in the positive area, signaling downward pressure on the main price chart. Moreover, the histogram failed to hold the selling pressure and is currently reaching the neutral area, signaling a corrective market structure.
Based on the four-hour market outlook, a bullish breakout with a consolidation above the 210.220 resistance level could be a long opportunity targeting the 216.816 level.
On the other hand, the downside pressure is valid as long as the price remains below the descending trendline resistance. In that case, a new swing low with a bearish rejection from the dynamic Kijun-sen line could increase the possibility of creating a new swing low below the 207.00 area.
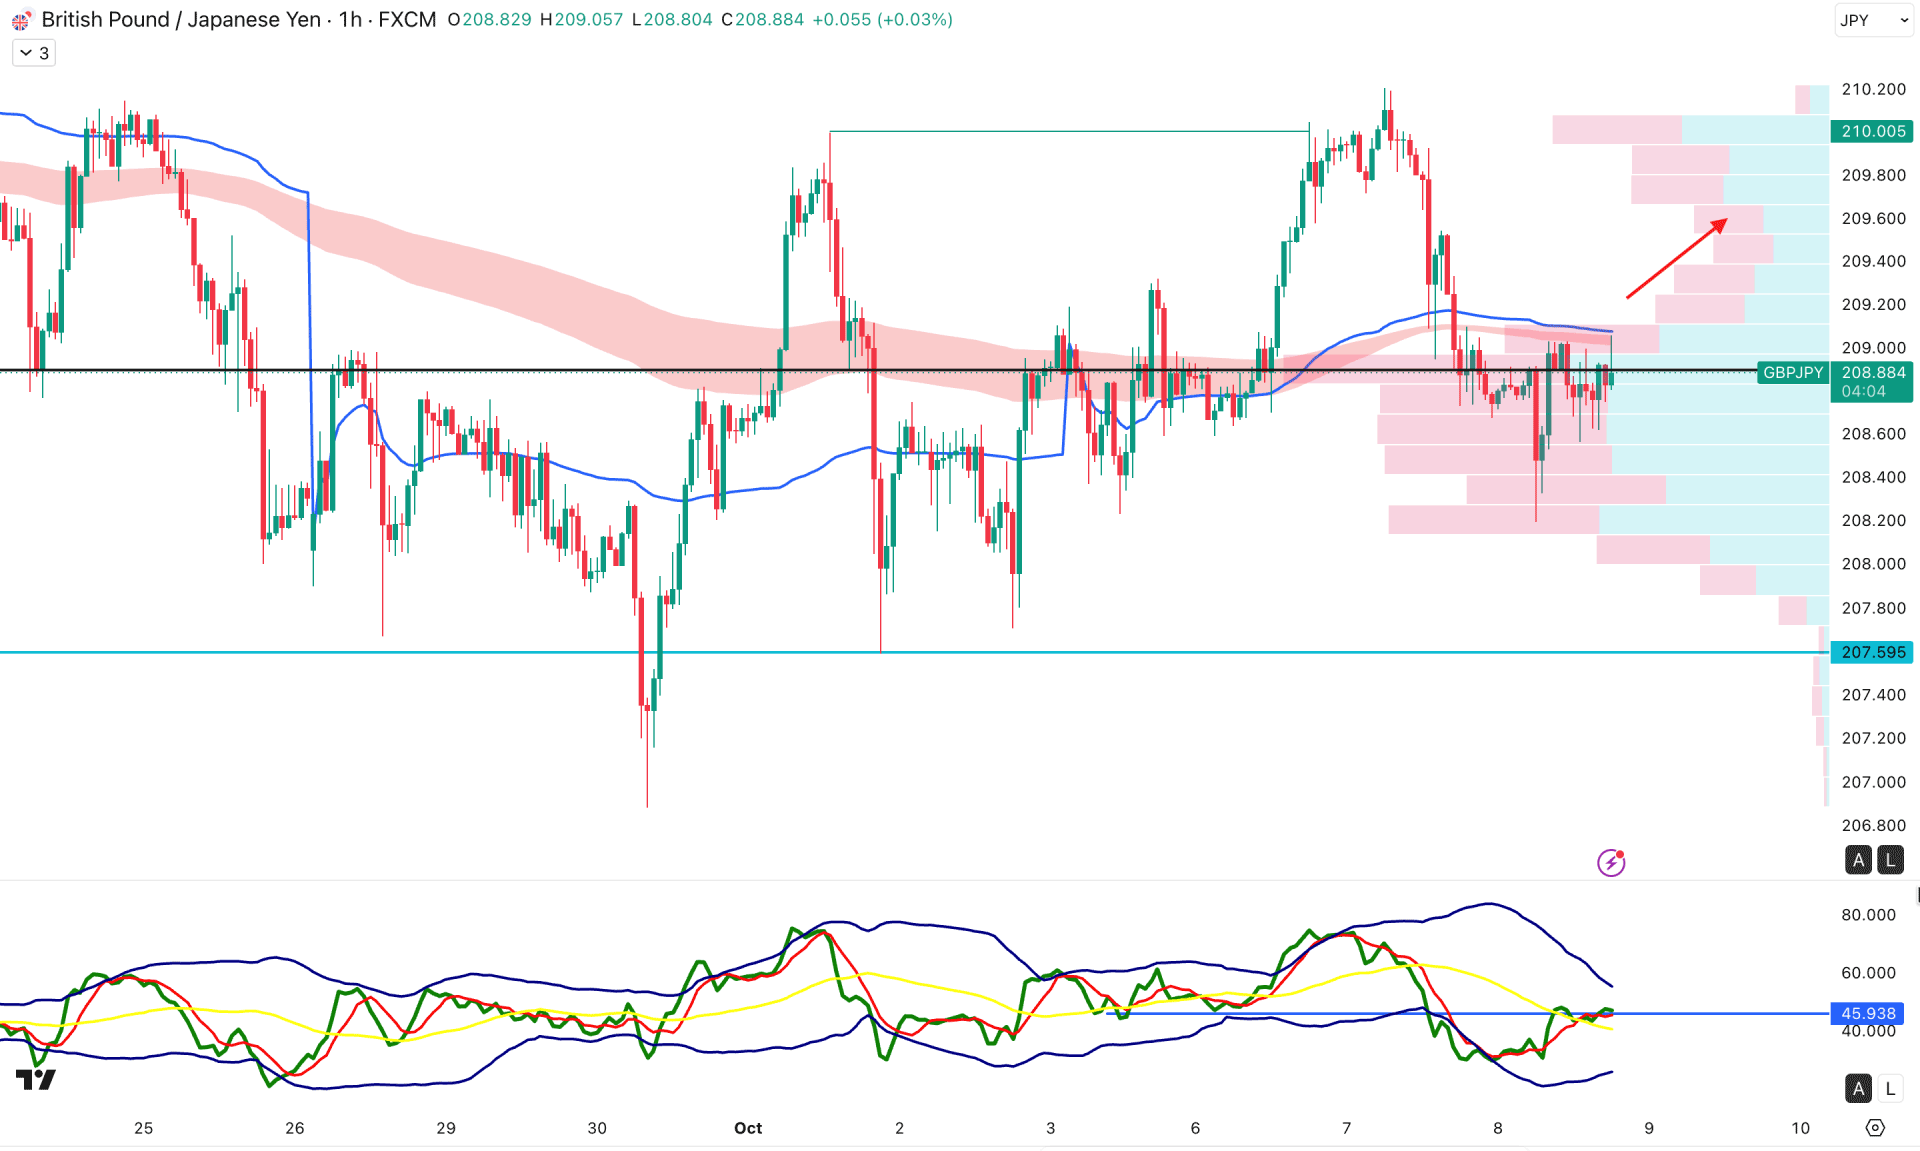
In the hourly timeframe, GBPJPY is trading within sideways momentum. The current price is volatile around the weekly VWAP level. Moreover, the exponential moving average is in line with the VWAP level, but the thickness is not solid enough to consider it a strong resistance zone.
In the secondary indicator window, the Traders Dynamic Index hovers at the 45.93 level, which sits in the neutral area.
Based on this outlook, the recent bullish V-shaped recovery at the weekly VWAP level signals a potential breakout opportunity. In that case, overcoming the 209.10 level could be a valid long opportunity targeting the 211.00 area first.
On the other hand, a sideways market below the trendline is valid, where a false break above the VWAP resistance could increase the possibility of testing the 207.59 level.
Overall, GBPJPY is trading with sideways momentum after strong selling pressure. As price still holds crucial daily support, a potential bullish recovery is pending. Investors should closely monitor how the price trades at the daily resistance area, as a valid buy-side liquidity grab could be the first sign of a bearish trend reversal.


