
Published: September 11th, 2025
The GBPCHF pair remains stable as the UK's RICS Housing Market Balance dropped to -19% in August, from -13% in July, the lowest level in almost two years.
As traders anticipate that the Bank of England (BoE) will maintain interest rates at 4% during its fiscal policy meeting in September, the pound's value (GBP) may continue to support its ground against its rivals. Following a 0.4% gain in June, the UK GDP data, due on Friday, is expected to show static monthly growth.
On the other hand, the Swiss National Bank (SNB) Chairman Martin Schlegel stated that the Federal Reserve would "not hesitate" to lower rates again if circumstances warranted it. Effective as of the September 25 session, he also announced new transparency policies, including the SNB's plan to release transcripts of its policy debates four weeks after each decision.
Let's see the further aspect of this pair from the GBPCHF technical analysis:
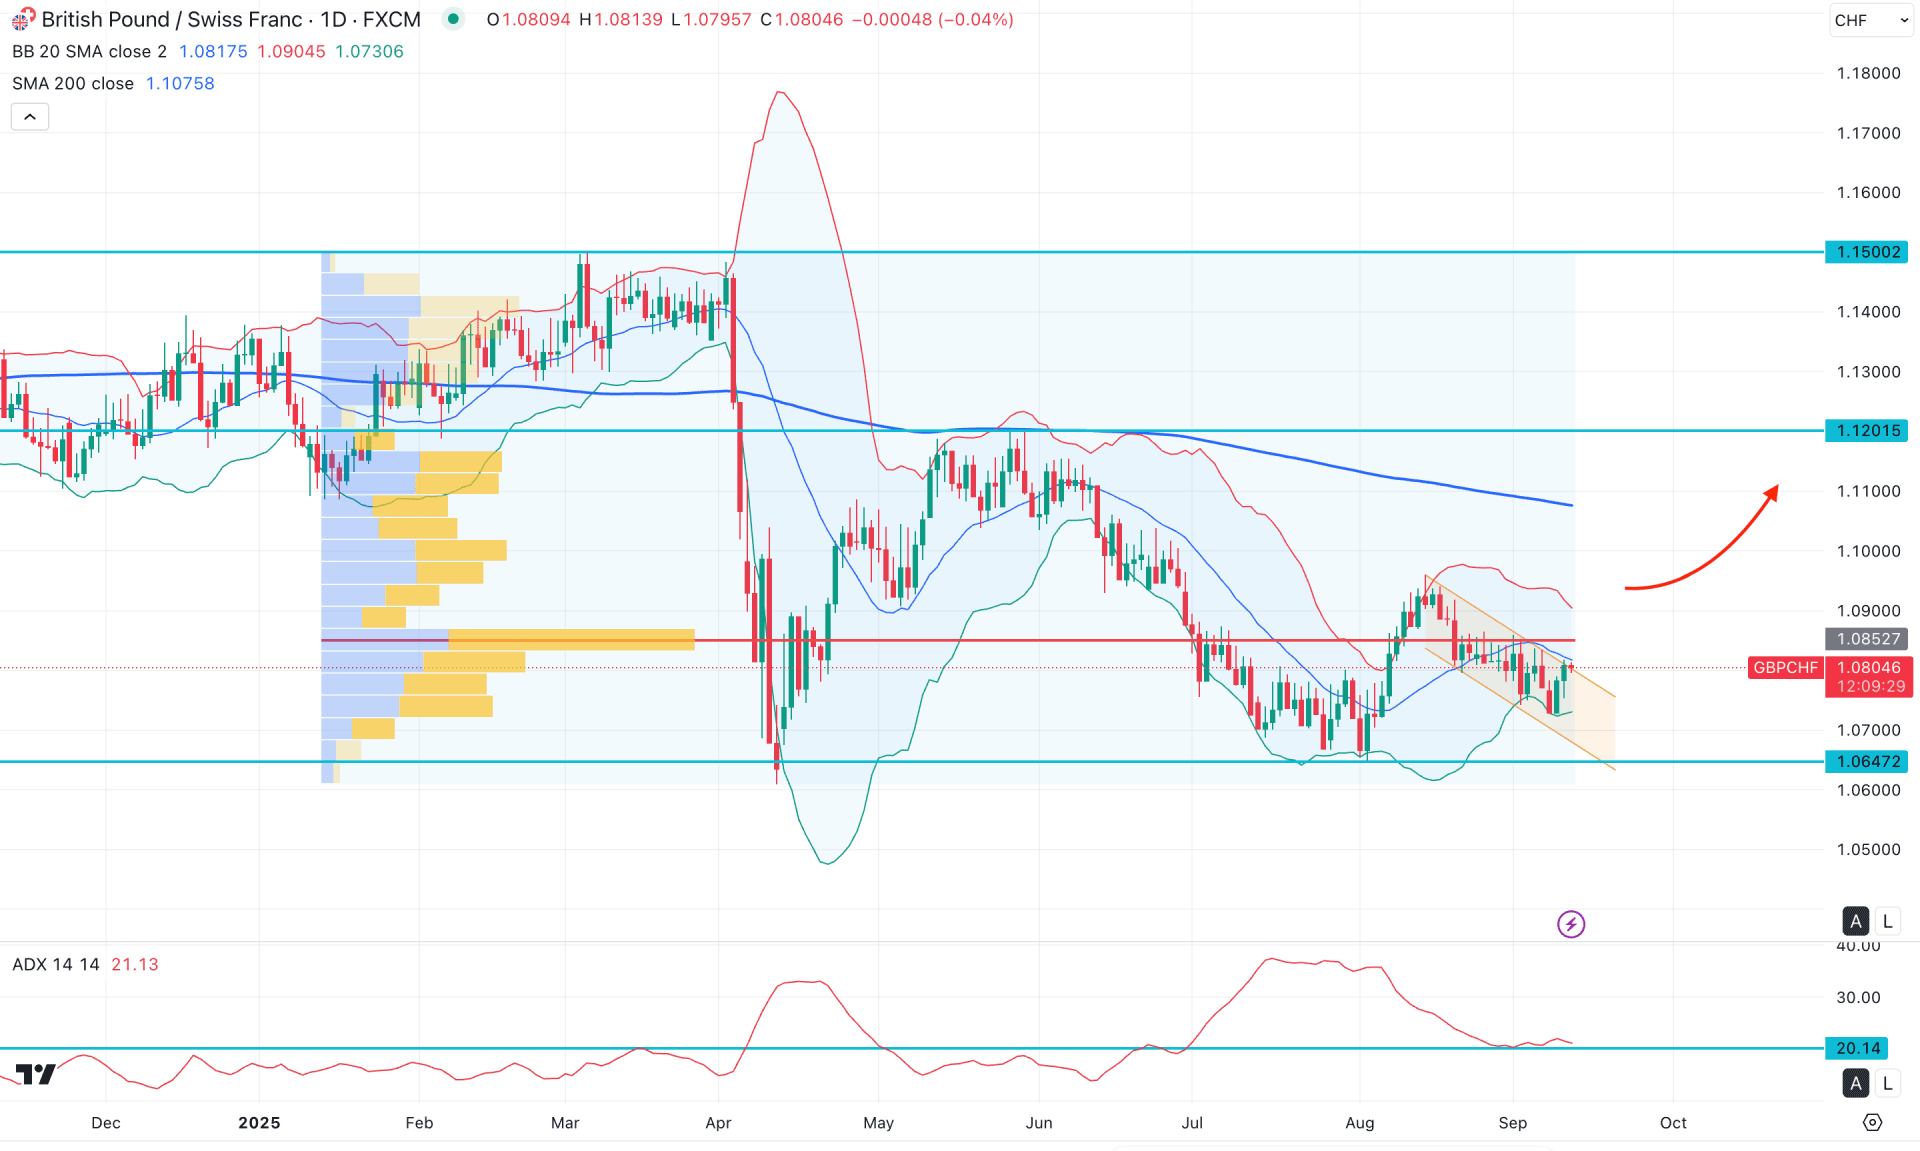
In the daily chart of GBPCHF, the overall market momentum is corrective, where the most recent price is trading within a descending channel. As an impulsive bullish wave backs the corrective downside pressure, a breakout could offer a decent trend trading opportunity.
Looking at the higher timeframe, downside pressure remains active, as the recent monthly candle was closed as a bearish inside bar. As the existing market momentum is bearish, investors should remain cautious before opening a long position. According to the weekly timeframe, high-volume selling pressure is active, with the weekly resistance located at the 1.1000 level. In that case, overcoming the crucial weekly resistance could result in a trend reversal at any time.
In the daily chart, the recent price is trading within a descending channel, while the lower Bollinger Bands line is working as an immediate support. Moreover, the 200-day Simple Moving Average is above the current structure and working as a major resistance.
Primarily, the downside pressure is visible from the Bollinger Band's position, where the mid-Bollinger Band level acts as immediate resistance.
On the other hand, the Average Directional Index (ADX) is showing signs of a downside correction, with the current level still hovering above the 20.00 benchmark line. As the price faces resistance, a bullish rebound from the 20.00 ADX level could indicate a potential continuation of the downside move in the main chart.
Based on the overall market structure, the price is trading within a broad trend, where the most recent price action is encountering resistance at the descending channel area. A failure to overcome the higher Williams resistance line could be a challenging factor for bulls. In that case, a bearish daily close within the channel area could extend the downside momentum below the 1.0700 level.
On the other hand, the price has failed to break below the lower Bollinger Band multiple times, and the most recent move is heading upwards with a bullish reversal attempt. In that case, extended buying pressure with a daily close above the 1.0852 level could open a long opportunity, targeting the 200-day Simple Moving Average (SMA). Furthermore, overcoming the mid-Bollinger Band with consolidation could extend the buying pressure toward the 1.1201 level.

In the H4 timeframe, the recent price is trading at the channel resistance, from where a stable trend might form. Moreover, the price is trading above the Ichimoku Kumo Cloud, suggesting a possible upward continuation.
In the secondary indicator window, the MACD Histogram maintained the buying pressure for a considerable time. Moreover, the MACD signal line showed a bullish crossover, signalling a confluence buying factor.
Based on the broader market outlook, the price is trading in a crucial premium zone, from which a failure to hold the price above the channel resistance could present a short-term opportunity. In that case, a bearish H4 candle below the dynamic Kijun Sen level could be a range extension opportunity, targeting the 1.0669 level.
The alternative trading approach is to wait for the price to extend higher above the 1.0837 level, which could open the room for reaching beyond the 1.0960 level.
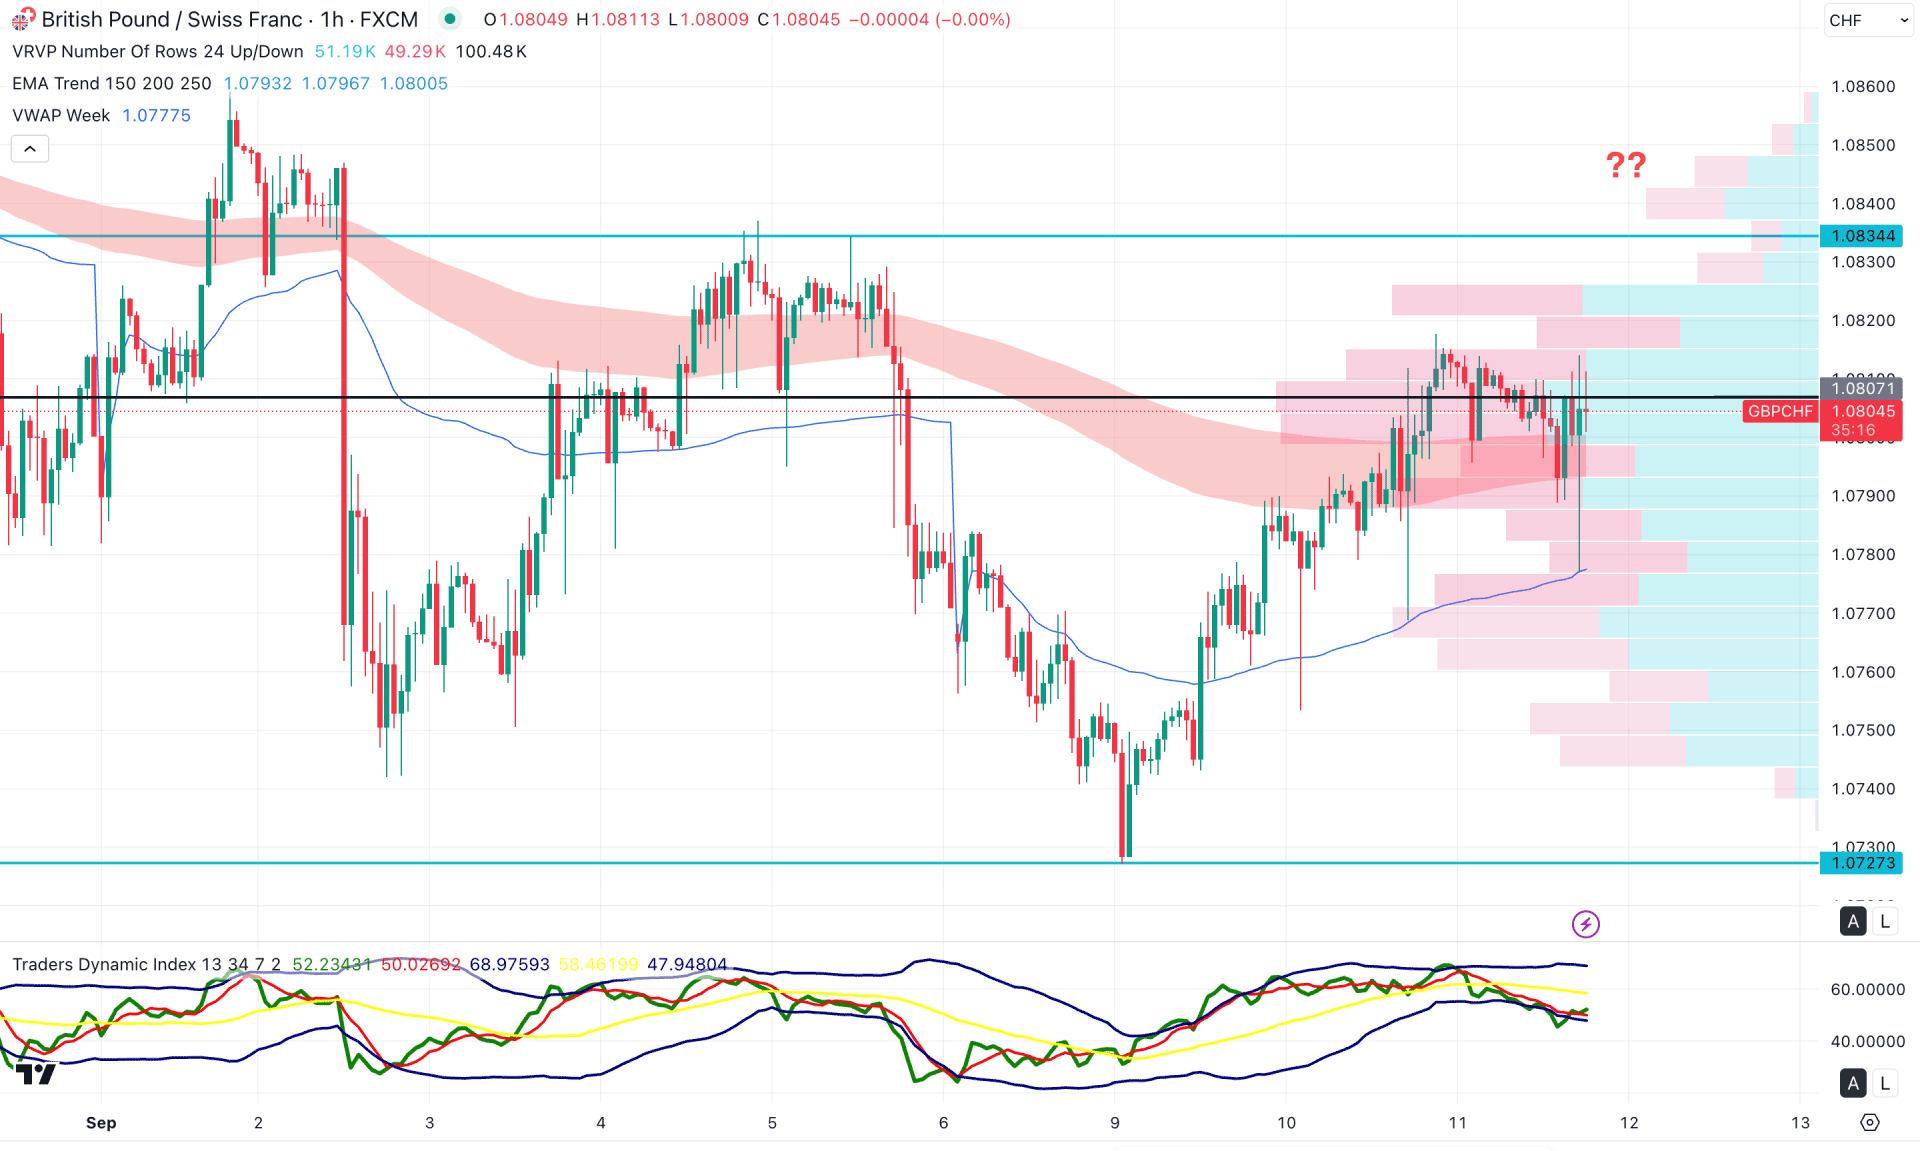
In the hourly timeframe, the price is trading near the resistance area. A breakout is needed before considering any long position. Based on technical indicators, buying pressure remains valid as the price struggles to maintain momentum below the EMA wave. Additionally, the weekly VWAP line is acting as immediate support, aligning with the EMA position.
However, the high-volume line is acting as immediate resistance, and the price needs to break above this level before it can move higher.
In the secondary indicator window, the Traders Dynamic Index (TDI) line has rebounded from the lower peak, suggesting a possible recovery in momentum.
Based on the overall market structure, a bullish continuation with an hourly close above the 1.0830 level could open a long opportunity, targeting the 1.0900 area. On the other hand, consolidation at the current price level with a liquidity sweep between 1.0820 and 1.0834 could present a potential short setup. In that case, a candle close below the VWAP line would be required before aiming for the 1.0727 support level.
Based on the broader market structure, GBPCHF is trading within a corrective bearish trend. A potential range breakout could trigger a bullish continuation opportunity. However, the price is still confined within the range, and another push to the downside is possible if it fails to break above the channel resistance.


