
Published: September 6th, 2022
According to the UK regulator (Ofgem), the cap on gas and electricity will be lifted by 80% to £3,549 on 1st October. It will have a dangerous effect on consumers as it will increase the cost of living and decrease spending. Moreover, the current inflation rate is overshooting the Bank of England’s target of 13%, while Goldman Sachs is talking about it going beyond 20% before Q1 of 2023.
On the other hand, the SNB President talked about the higher global inflation during the Jackson Hole Symposium, but there was no talk about its effect on the Swiss market. The total SNB sight deposit for the week ending 26 August 2022 came at CHF752.8bn, mostly unchanged from the previous week’s report.
Inflation in Switzerland ticked up to 3.5% year over year from 3.4% year over year in July. The core inflation remained unchanged at 2%. However, the SNB might not want to run rampant while other parts of the world are fighting with a rate hike in their September meeting.
In this context, the weaker GBP and comparatively stronger CHF would be the perfect condition to look at, where the recent test of intraday resistance level opened a bearish opportunity. Let’s see the future price direction of GBPCHF from the GBPCHF technical analysis.
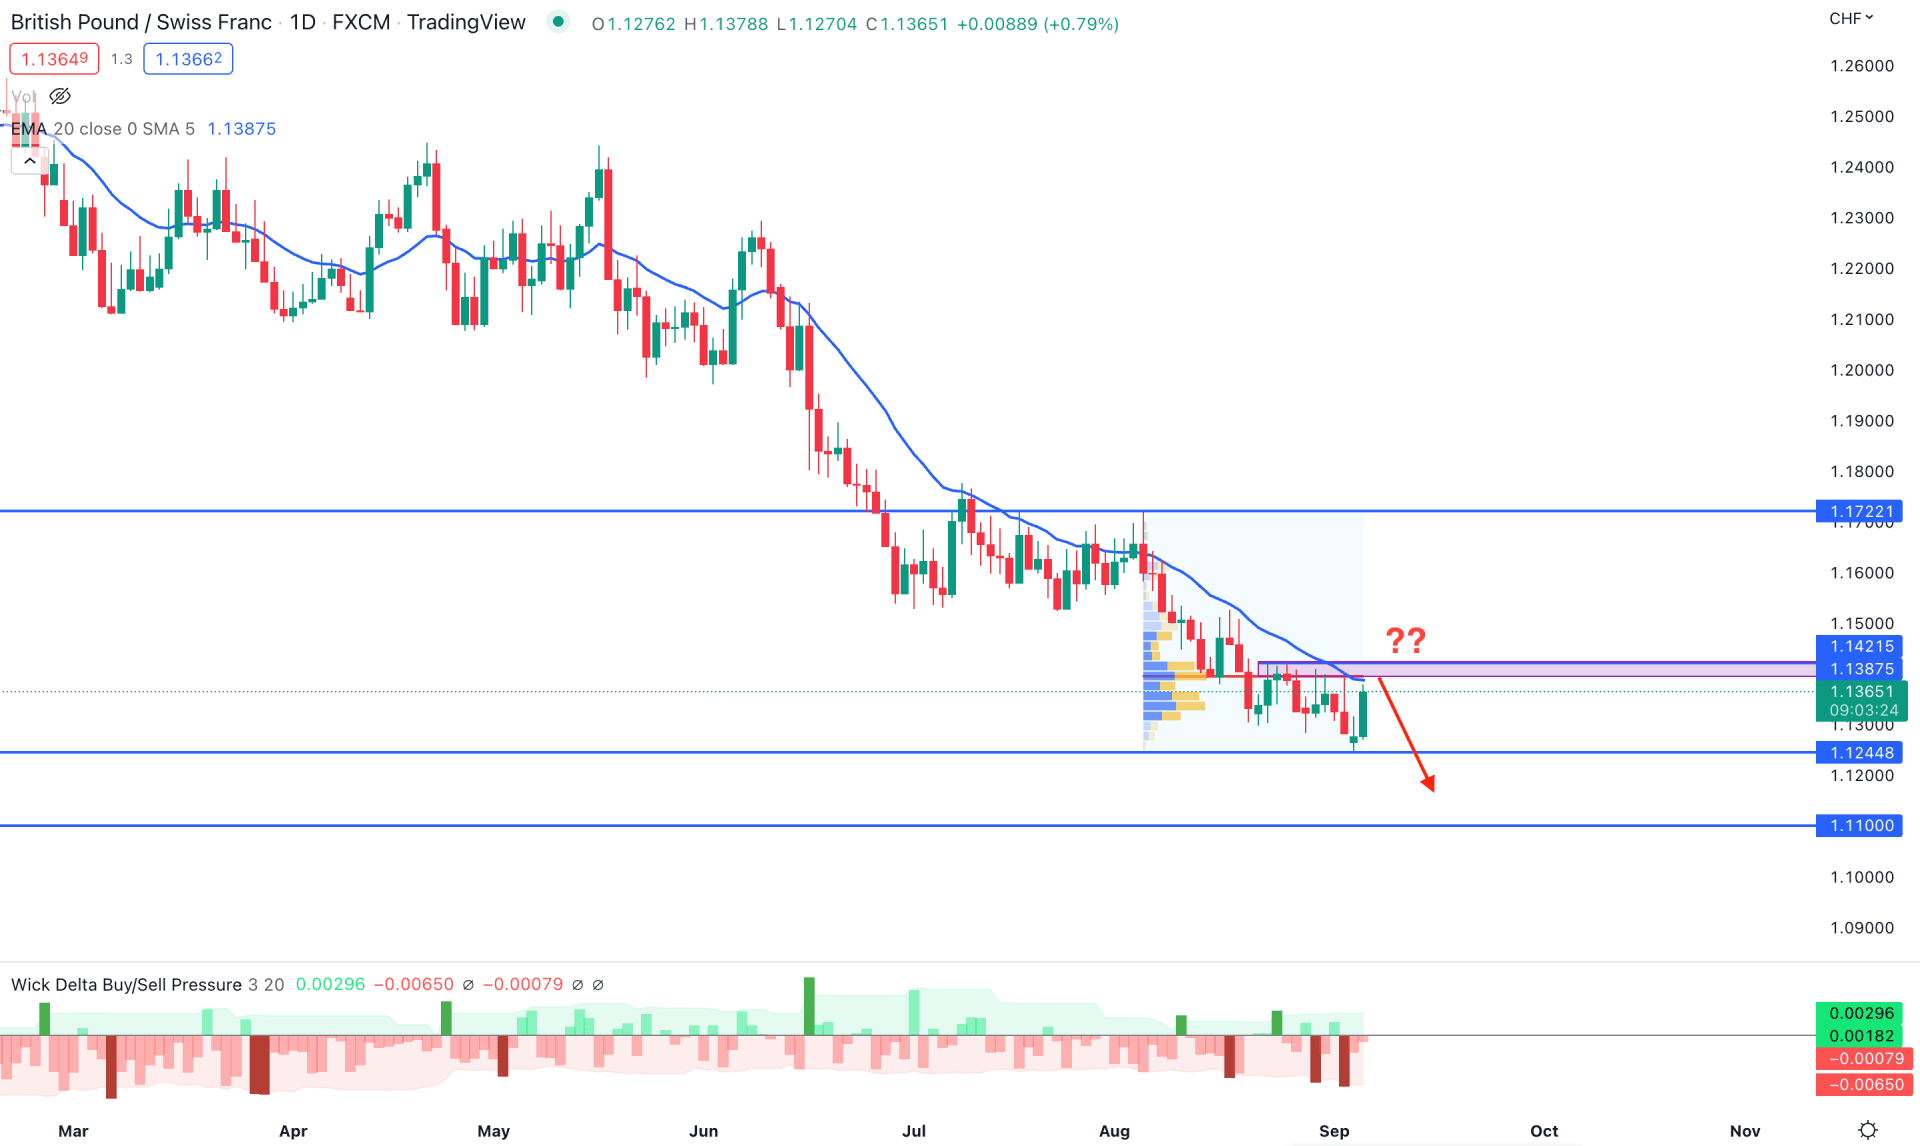
In the daily chart of GBPCHF, the market trend is clearly visible as bearish, where the price is moving down by creating lower lows. In the recent trading days, the selling pressure has become faded even while bulls failed to form a strong recovery.
Based on the fixed range trading volume indicator from August 2022 high to low, the highest activity level was seen at 1.1393 level from where multiple sellers’ attempts were seen. From the Monday close, bulls tried to recover the price but faced strong resistance at 1.1393 high volume level, while the dynamic 20-day Exponential Moving Average is acting as immediate resistance.
Based on the Wick Delta Buy/Sell pressure indicator, daily candles with selling pressure appeared on 30 August and 2 September, indicating bears’ activity in the market. Meanwhile, buyers' attempts in the market are weaker with a minor pressure on 24 August.
Based on the daily GBPCHF chart, the current price is facing critical resistance on the daily chart, where investors should closely monitor how the price closes. A bullish daily close above the 1.1420 level with a daily candle might open a bullish opportunity towards the 1.1700 area.
Conversely, any selling pressure on the intraday chart would extend the current selling pressure, where the primary aim is to test the 1.1244 support level.
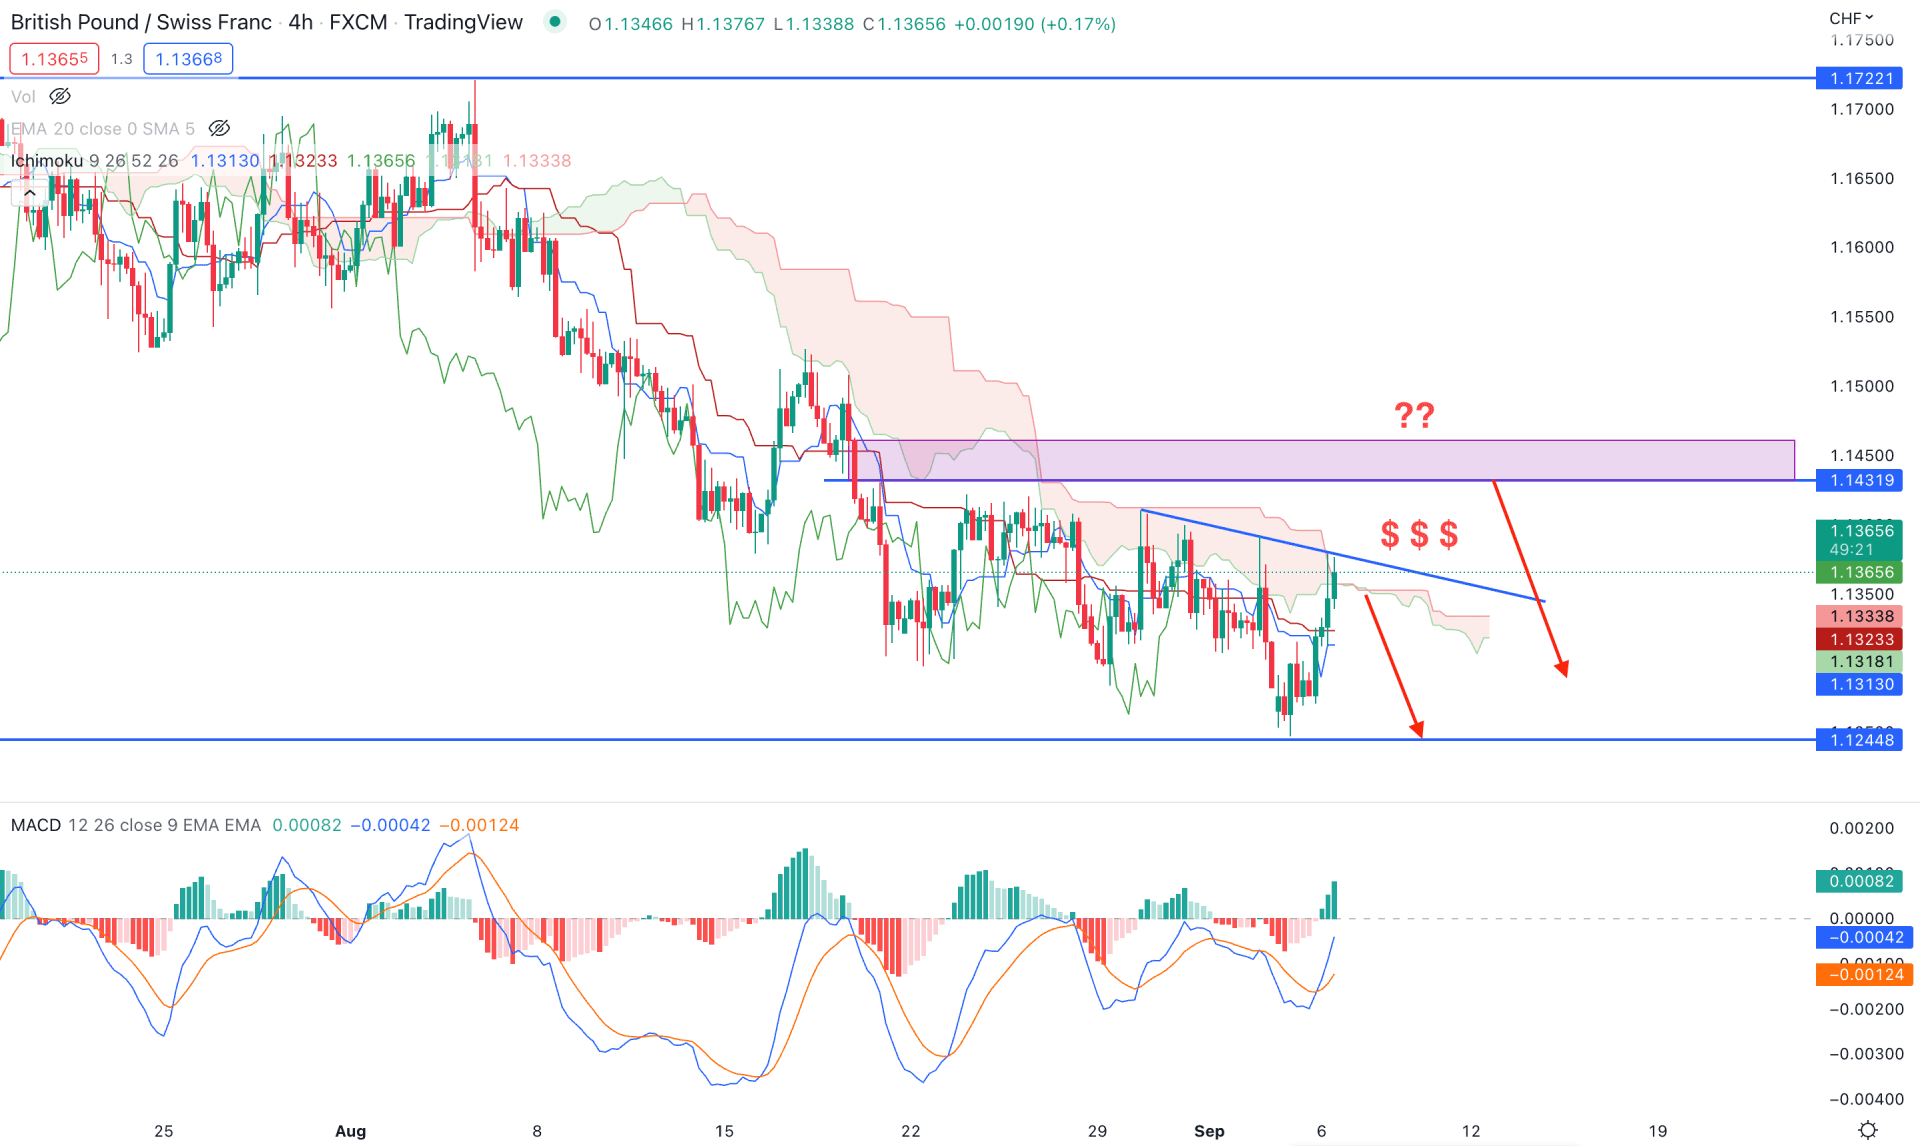
In the H4 timeframe, the selling pressure is still valid, although the current price is building trendline liquidity within the Ichimoku Kumo Cloud.
The selling pressure was initiated on 4 August 2022 with a strong bearish H4 candle below the Ichimoku Cloud that provided a fresh 373 pips of profit to bears. However, the buying pressure has become weaker in recent trading days, but it is not the right time to consider it invalid.
In the future cloud, the Senkou Span A is steady below the Senkou Span B, representing bears' presence in the market. Moreover, the MACD Histogram is bullish, but no significant buying momentum is seen.
Based on the H4 context, any immediate selling pressure with an H4 close below the trendline could resume the bearish trend towards the 1.1244 level. However, the bullish recovery and bearish rejection from 1.1431 to 1.1466 zone would be the strongest sellers point but above the 1.1470 level the bullish opprtunity may appear towards the 1.1700 area.
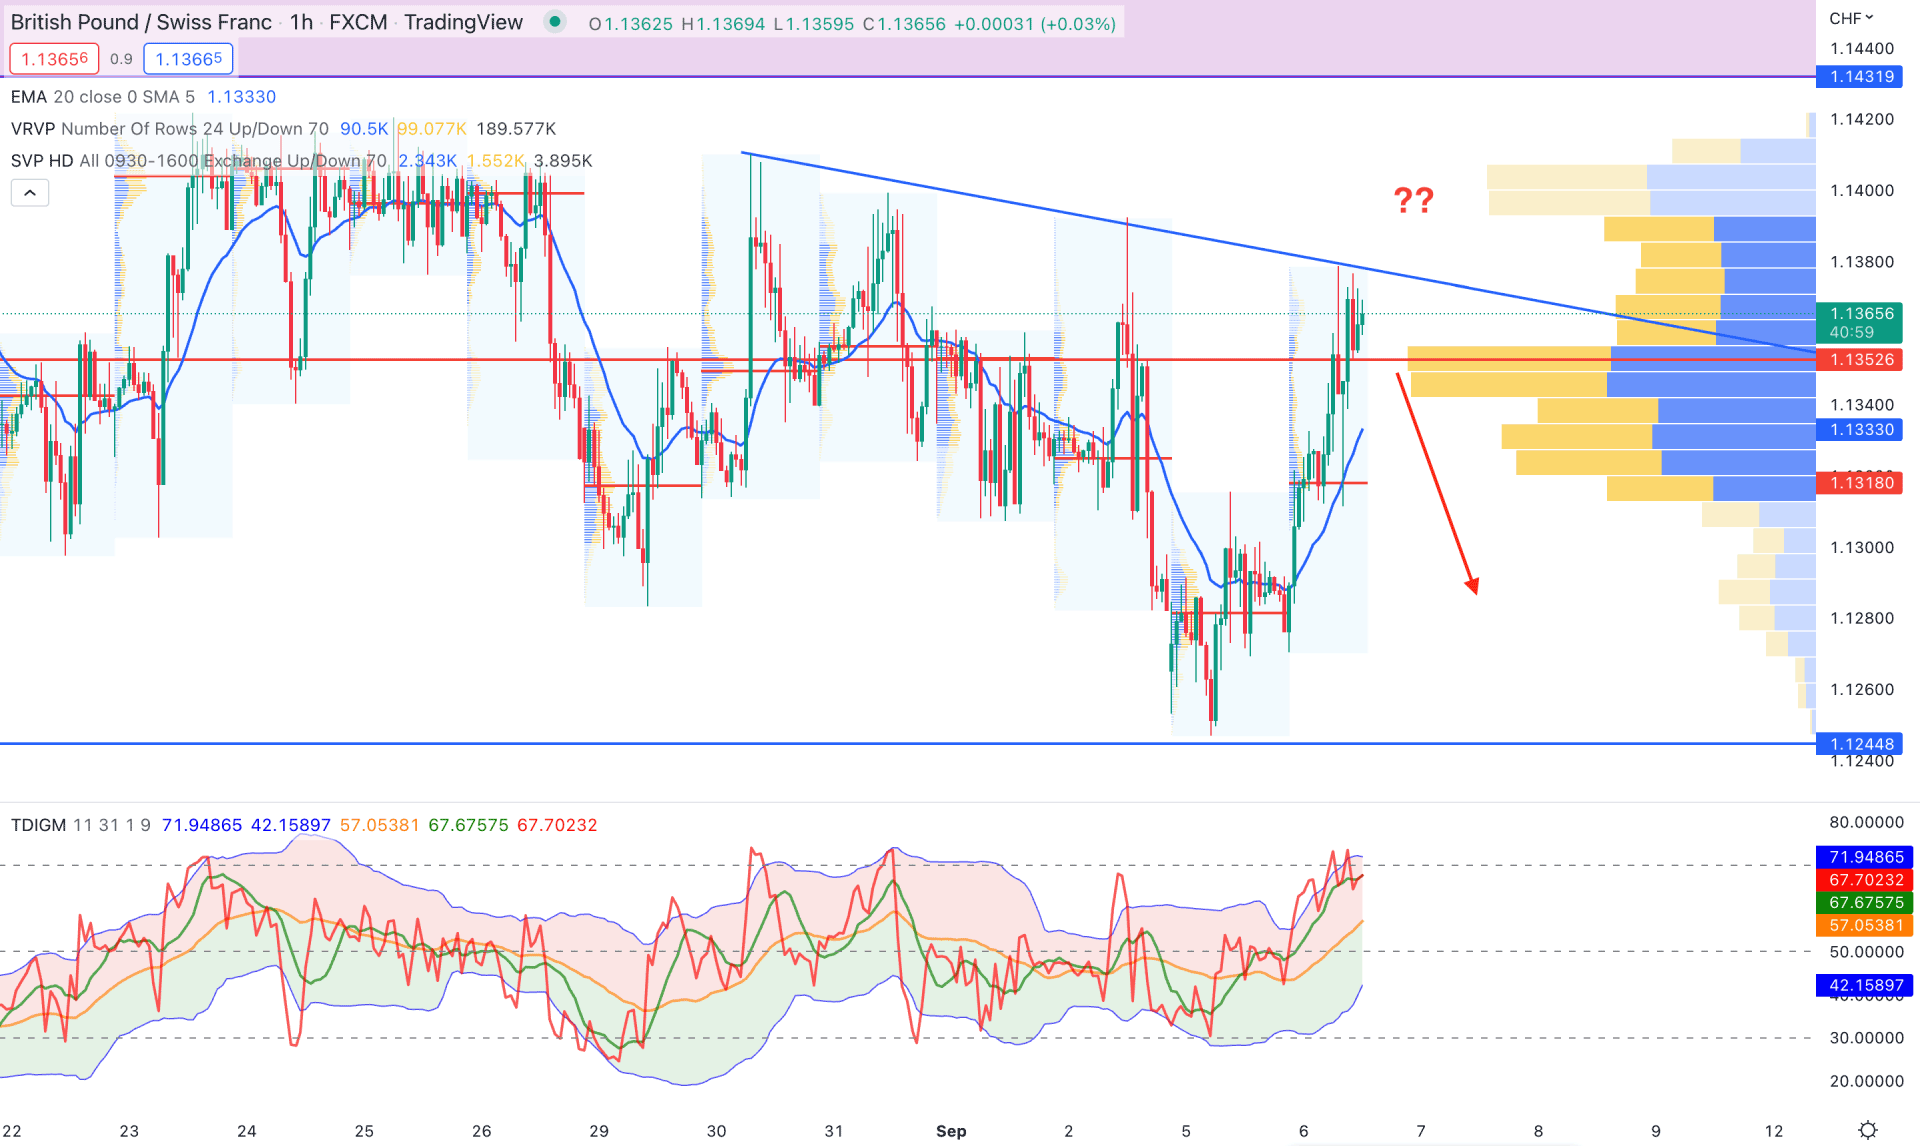
In the GBPCHF H1 chart, the current price trades above the visible range high volume level of 1.1352, which is the primary barrier for sellers. Although the current price is facing a minor trendline resistance, it is important to see how bears recover it below the 1.352 level.
The dynamic 20 EMA is below the price, while the Traders Dynamic Index showed an overbought price condition.
Based on the H1 price prediction, a new bearish H1 candle below the 1.1350 level would trigger the selling opportunity towards the 1.1244 level. On the other hand, the bullish break above the trendline resistance would increase the possibility of reaching the 1.1450 resistance level.
Based on the current multi-timeframe analysis, GBPCHF broader market trend is bearish where any intraday selling pressure would provide a decent bearish opportunity. However, the current price faces a strong resistance and investors should monitor how it trades below the level to avoid unexpected breakout.


