
Published: July 2nd, 2026
As currency markets fluctuated due to the price action for Japanese yen, the Pound surged against the Swiss Franc and reached the premium zone.
Although investors are awaiting further information regarding Burnham's policies, the U.S.-Iran agreement and the decline in oil prices have been the main drivers of UK assets.
Following the yen's unexpected surge on Thursday, currency markets saw significant movement and there was no exception for GBPCHF.
Switzerland's retail sales increased 3.5% year over year in May, surpassing market projections of 0.8% and rising from 1.7% in April. The Swiss CPI and the Swiss National Bank's (SNB) Statistical Stability Report, which are expected on Thursday, are now anticipated by traders.
Let's see the complete price projection from the GBPCHF market analysis:
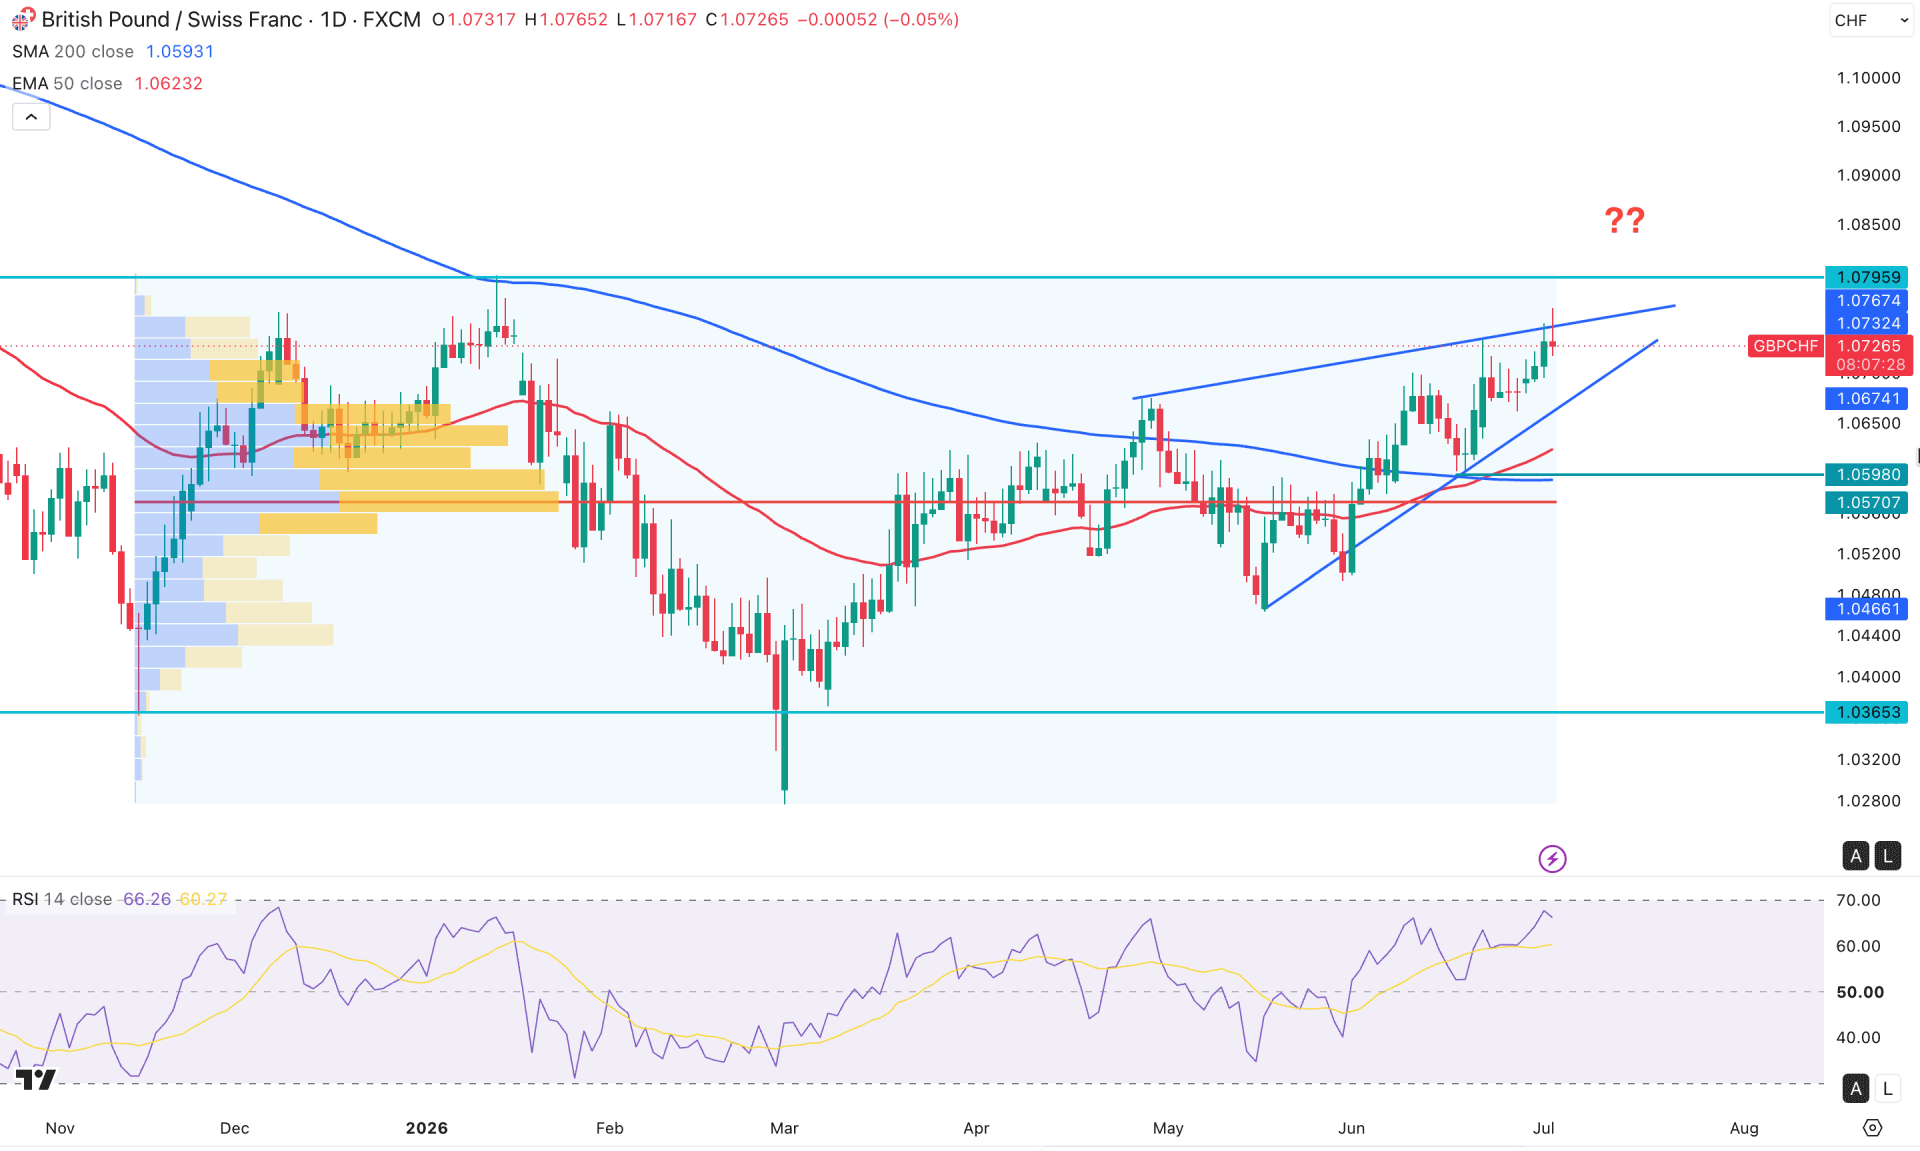
In the daily chart of GBPCHF, the recent price shows a strong bullish recovery from a valid inverse head and shoulders breakout. However, the price approaches the yearly high, where weakness to the buying pressure is visible. As the ongoing price section is within a rising wedge pattern, a bearish breakout could be a short opportunity.
Looking at the higher timeframe, the price is trading in an extreme bearish zone. The recent recovery is solid with an engulfing pattern breakout in the monthly chart. Moreover, the current price is hovering above the existing monthly support level, signaling ongoing buying pressure. The weekly timeframe shows a consolidation from where the near-term weekly resistance is a crucial price to look at. As long as the price remains below the 1.0767 weekly resistance, a correction is highly possible.
The volume structure shows buying pressure as the largest activity level since November 2025 is below the current price. However, the gap between the current price and the high volume line has expanded, creating a potential bearish correction as a mean reversion.
Looking at the main timeframe, the 200-day SMA and 50-day EMA are below the current price with a bullish slope. It is a sign of a valid bullish trend reversal with a golden cross formation.
After forming a bullish breakout, the price retested the 200 SMA before creating a new swing high, which is a valid sign of a bullish trend continuation. However, the price is facing selling pressure from the trendline resistance, from where a failure to overcome the resistance line could signal a potential reversal.
RSI is also on the buyers' side, where the current line is just below the 70.00 overbought level. As long as the RSI holds above the 50.00 level, we may expect the buying pressure to extend.
Based on the market structure, the price is trading within a rising pattern from where a minor downside correction is possible toward the 1.0650 support level. However, a strong barrier is located at the 1.0598 static support line, which could be tested before validating a long opportunity towards the 1.0795 level.
The alternative trading approach is to wait for a bearish break below the 1.0598 level, which could open the room for testing the 1.0466 bottom.
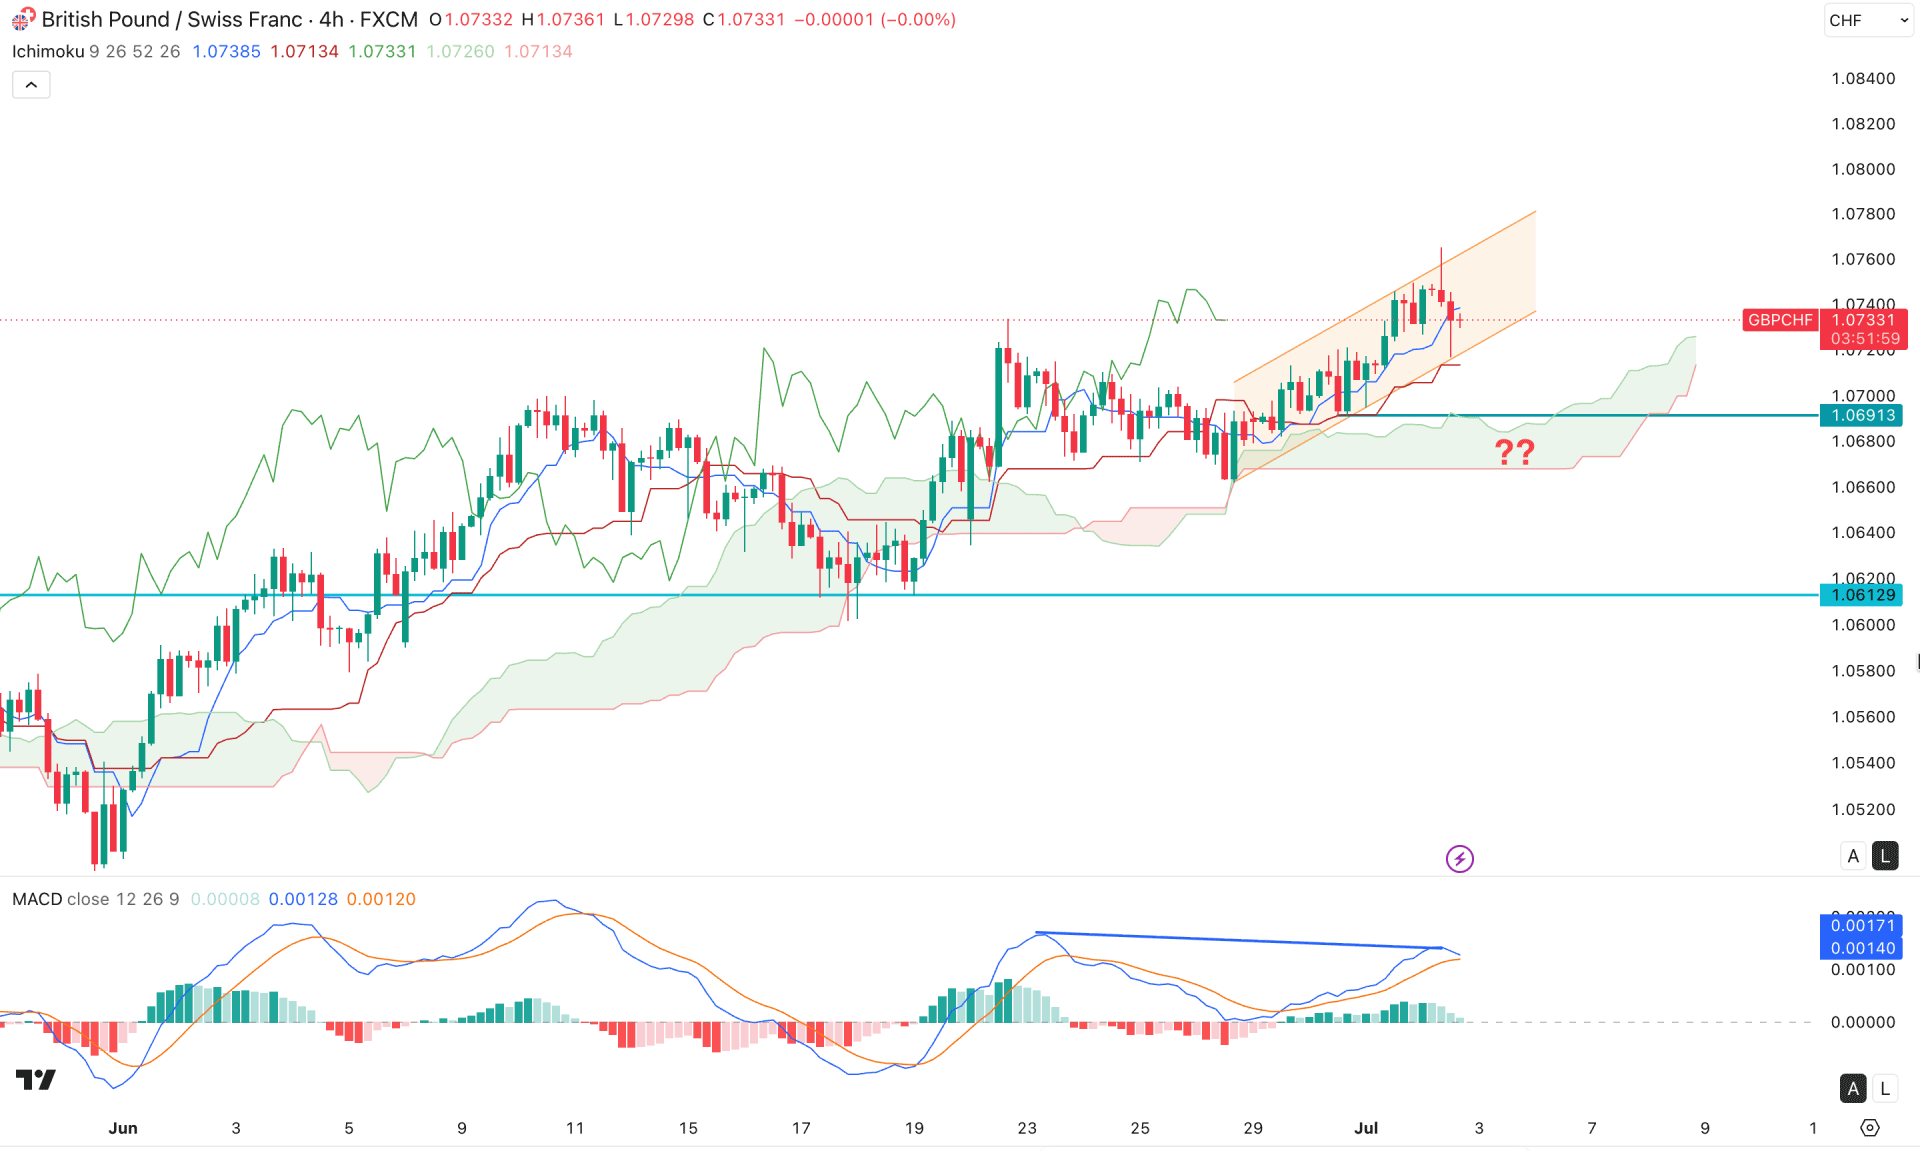
In the GBPCHF H4 chart, an ongoing bullish trend is visible as the current price is moving steadily above the cloud support. Moreover, the future cloud is solid as both lines are heading upwards, signaling a bullish continuation.
The intraday market remains volatile due to the non-farm payroll earnings release that pushed the price lower to the dynamic support. Moreover, a divergence has formed with the MACD signal line, with the histogram at the neutral point from the positive area. It is a sign of seller activity in the current price area, which needs more confirmation before validating the short opportunity.
Based on this market outlook, the bullish structure is active as long as the price remains above the 1.0691 support level. A valid bullish rebound from the 1.0691 support level with a recovery above the Kijun-sen level could resume the buying pressure towards the 1.0800 area.
On the other hand, a failure to hold the price at the channel support with a bearish break below the 1.0691 could increase the possibility of testing the 1.0612 key support level.
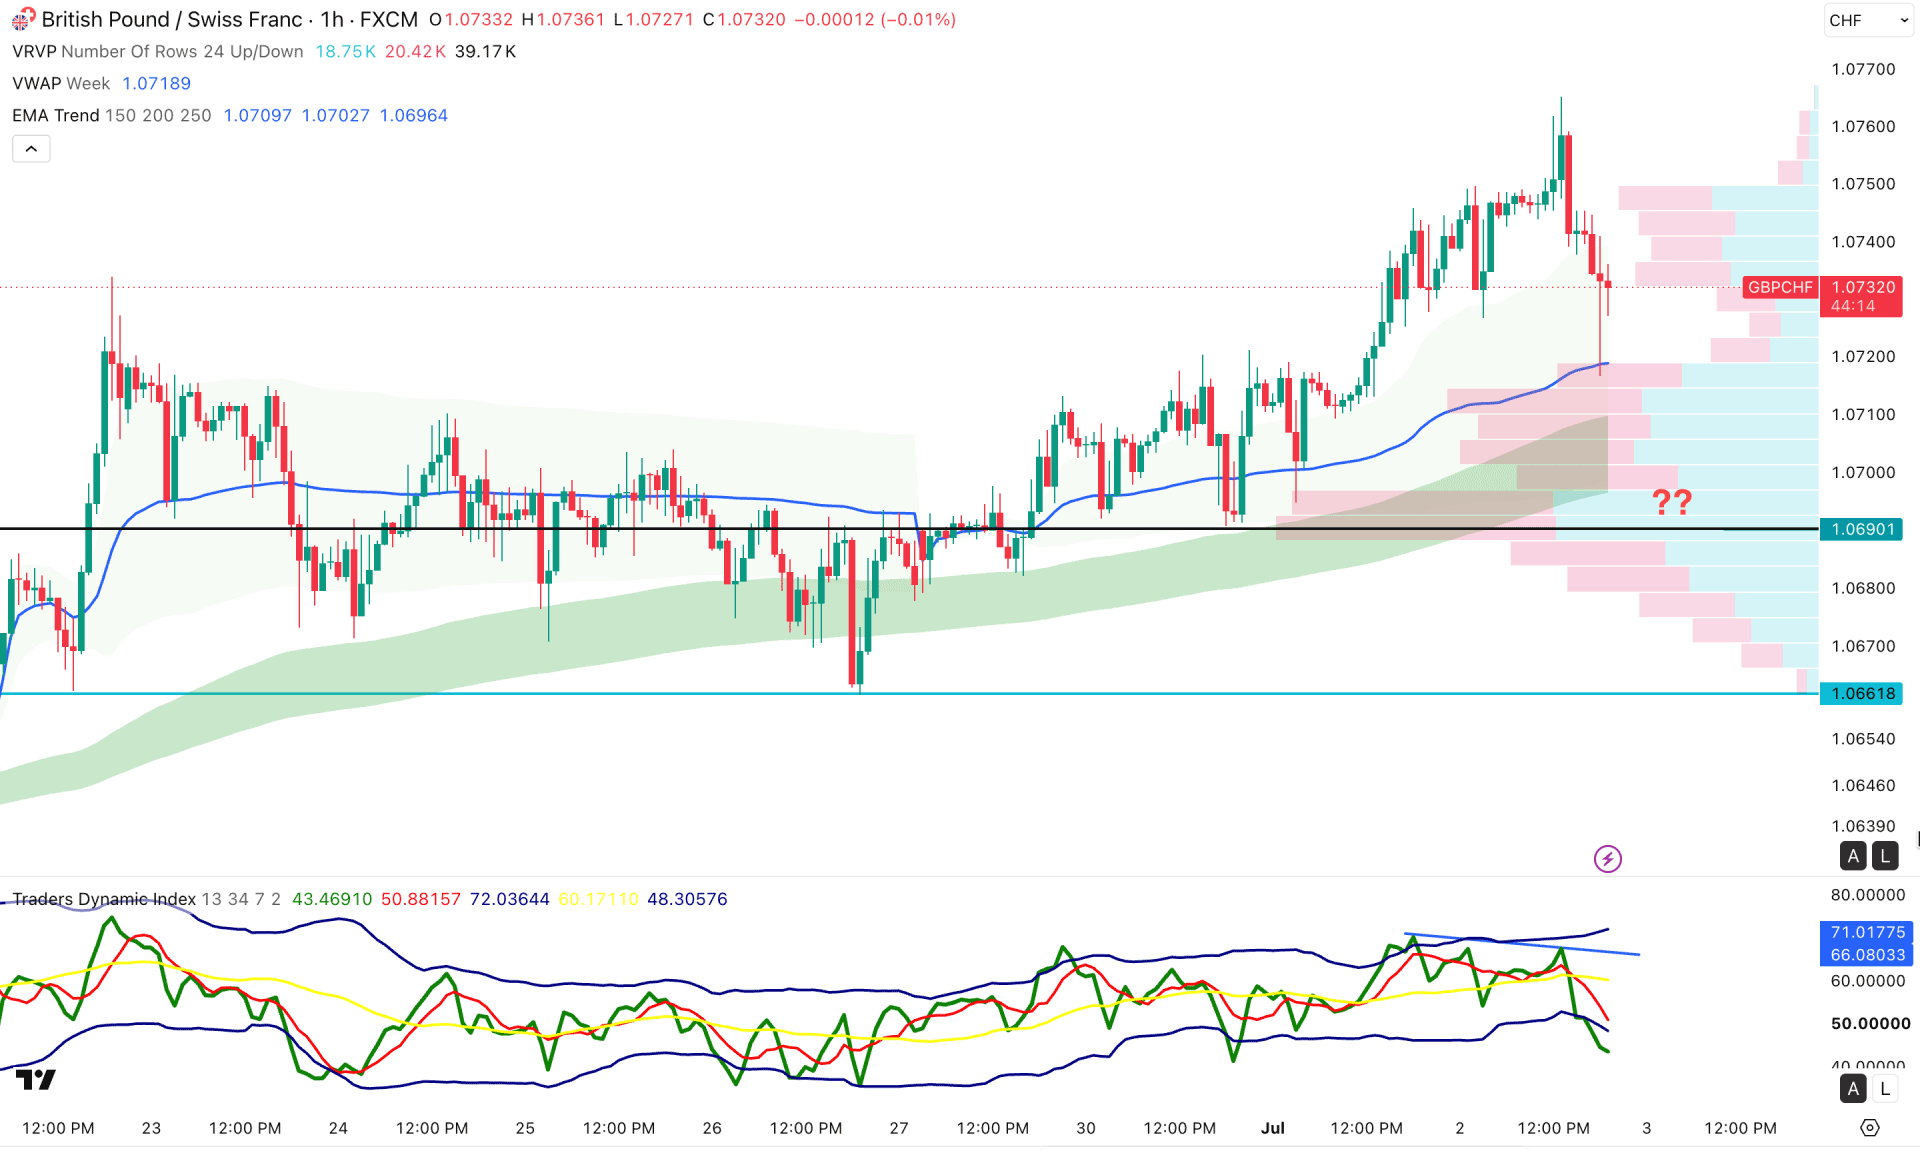
In the H1 timeframe, the price became volatile at the top level. Immediate bearish pressure is visible with a divergence with the Traders Dynamic Index indicator. Moreover, the TDI line moved below the neutral area, signaling selling pressure in the market.
On the other hand, the weekly VWAP level and exponential moving average are still below the current price, working as crucial support. The high volume support level is also below the current price, supporting buyers.
Based on this outlook, the bullish rebound is highly possible as long as the price remains above the 1.0690 high-volume support level. A break above the VWAP support level with immediate bullish momentum could be a potential opportunity targeting the 1.0800 area. On the other hand, a failure to hold the price at the 1.0690 level could lower the price below the 1.0661 area.
Based on the overall market structure, GBPCHF is trading in a premium zone, so opening long positions may require additional confirmation. As the ongoing price action is bullish, investors should closely monitor how the price reacts at the near-term support level, as a bearish break with a potential retest could be a short-term bearish opportunity.


