
Published: August 8th, 2023
Due to the Bank of England's (BoE) implementation of higher interest rates, the potential for a rise in the British pound (GBP) appears to be limited. This decision is exerting additional pressure on the housing market, employment trends, and manufacturing activities in the United Kingdom.
Consequently, the GBP/CHF pair is under pressure, as BoE policymakers have signaled a willingness to implement additional policy tightening to return inflation to the 2% target.
BoE's Pill expresses optimism regarding the likelihood of UK inflation falling to 5% within the current year to achieve the desired rate in the first half of 2025. However, the pursuit of 2% inflation could potentially cause a recession in the British economy. The second-quarter Gross Domestic Product (GDP) data will garner significant attention in the coming months.
Regarding the Swiss economy, a robust labor market will likely keep inflation above the target rate. With the unemployment rate for July hovering near historically low levels at 1.9%, the Swiss National Bank (SNB) may decide to raise interest rates further.
Is it the right time to invest in GBPCHF? Let’s see the upcoming price direction from the GBPCHF technical analysis:
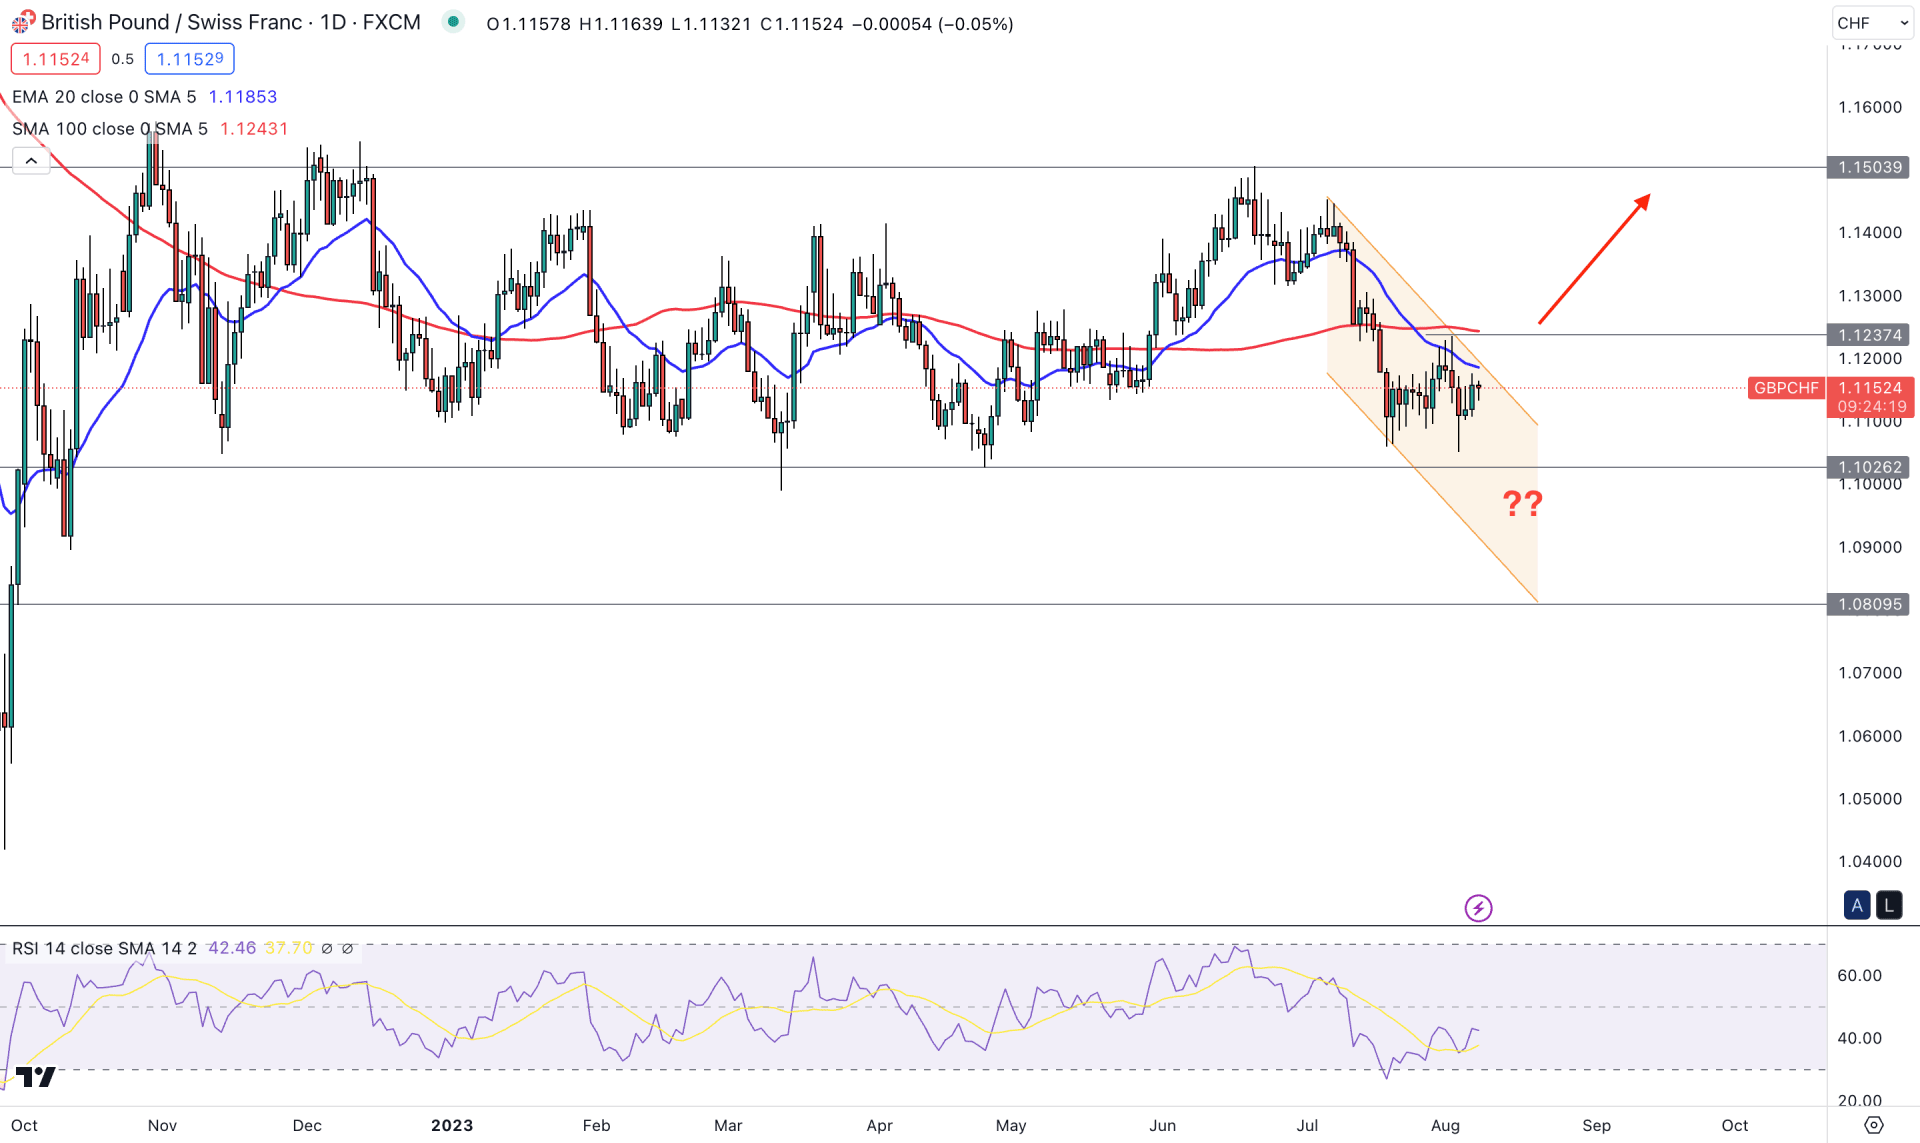
The broader market context is corrective in the daily price of GBPCHF, as the price has been trading in a tight range since the September 2022 crash. The corrective momentum is visible from dynamic levels as well. As per the current reading, the 100-day SMA has been almost flat for more than 10 months, indicating indecisive momentum.
In the higher timeframe price action, the July 2023 monthly candle close shows a strong bearish possibility, as it came after several indecisive months. Also, the recent weekly candlesticks show a strong buy-side liquidity sweep from the 1.1417 level before forming a new lower low. It is a sign that the current selling pressure is backed by larger orders, which can result in a bearish trend continuation.
In the daily price, the selling pressure could extend from the channel extension as the dynamic 20-day Exponential Moving Average works as a resistance. Currently, the 161.8% Fibonacci Extension level from 1.1501 high to 1.0274 is at the 1.0734 level, which could be a significant support level for this pair.
In the indicator window, the current 14-period Relative Strength Index (RSI) shows a downside possibility as it remains below the 50.00 line.
Based on the daily price outlook, the downside possibility is potent as long as the price trades below the 1.1237 resistance level. Moreover, selling pressure and a daily candle below the 1.1027 support could boost the downside momentum toward the 1.0809 support level.
On the other hand, a bullish recovery needs a channel breakout with a D1 candle above the 1.1240 level before aiming for the 1.1400 and 1.1501 levels.
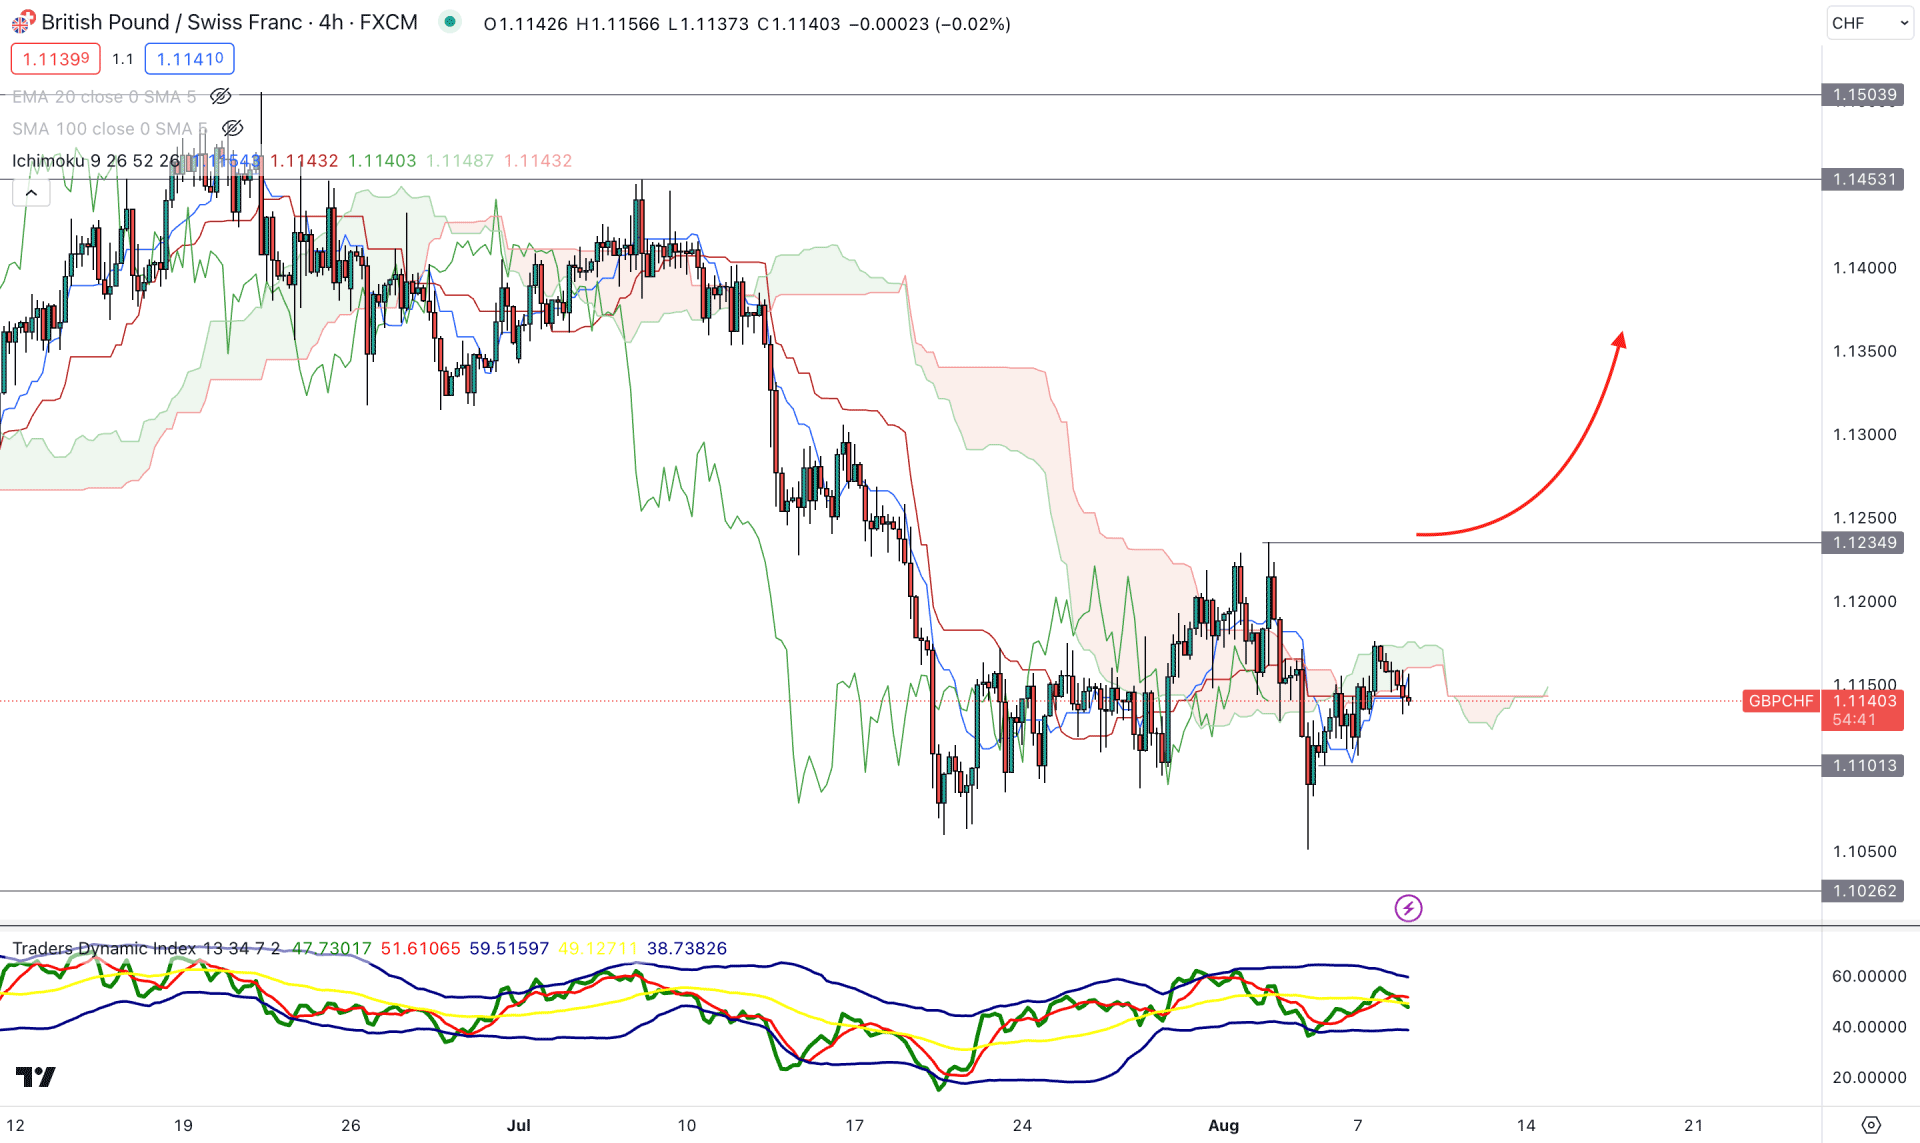
In the H4 timeframe, the current price trades sideways after a long bearish trend, where multiple violations are seen in the Kumo Cloud zone. The Senkou Span A and B are closer in the future cloud.
The current TDI indicator shows a sideways movement in the indicator window, as the current reading is found at the 50.00 neutral zone. It signifies that a fresh new trend might come after a valid breakout.
Based on the h4 structure, a downside continuation opportunity needs a valid break below the dynamic Kijun Sen support, which can lower the price toward the 1.1026 support level.
On the other hand, a bullish recovery is possible where the bullish H4 candle above the 1.1234 level is needed before aiming for the 1.1400 psychological level.
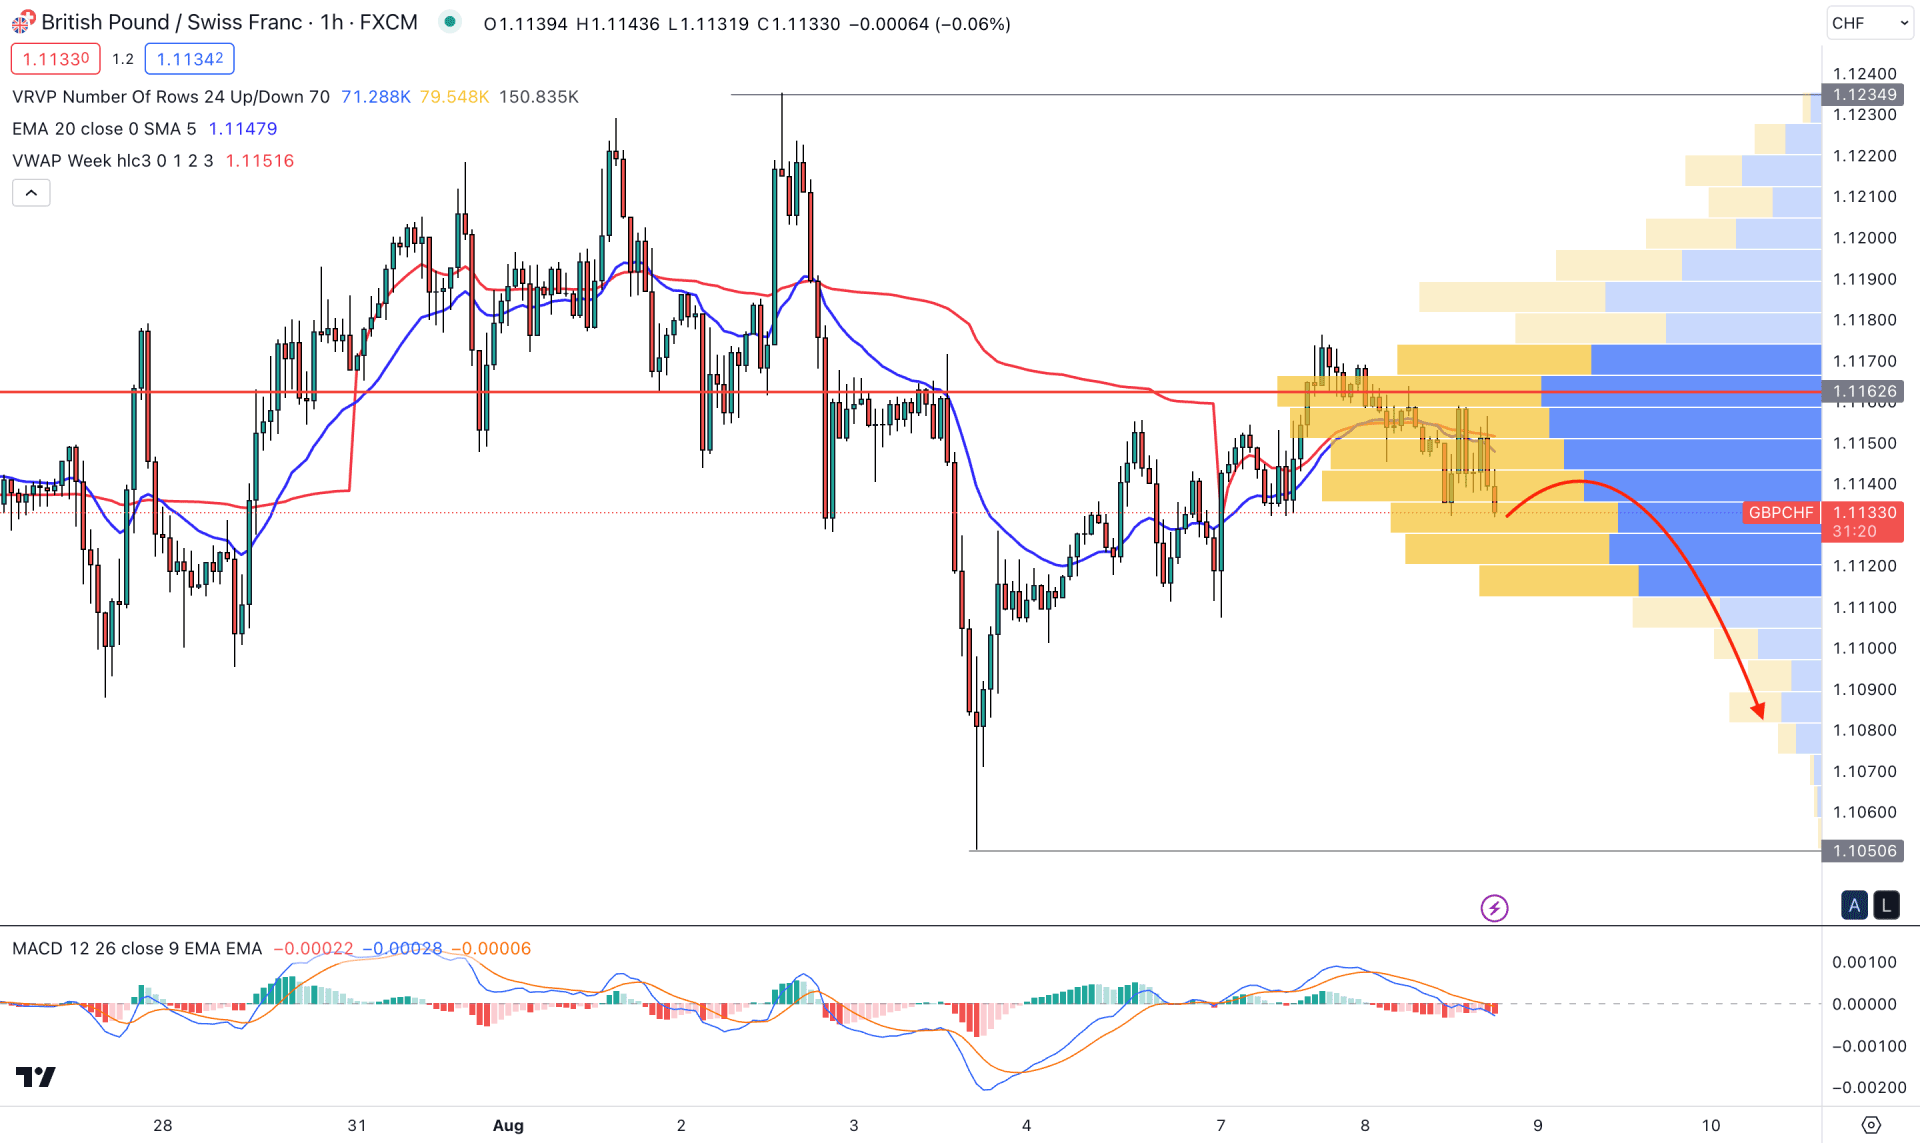
In the hourly chart, the currently visible range high volume level is above the current price, indicating that bears are active in the intraday market. In that case, the primary trading idea is to look for short trades as long as the price trades below the high volume level.
The dynamic 20 EMA and weekly VWAP are closer together, and the recent price shows a bearish H1 candle from these levels. It is a sign that the sellers’ accumulation is ordered and a trend continuation is pending.
A similar momentum is present in the indicator window, where the current MACD Histogram is bearish with a downward slope in the MACD EMA.
Based on the H1 structure, sellers may regain momentum in the coming days. As per the current reading, the bearish pressure could extend toward the 1.1050 level. The alternative approach is to look for a bullish recovery and an H1 candle above the 1.1180 level, which could increase the price toward the 1.1240 level.
Based on the current multi-time frame analysis, the broader outlook of the GBPCHF pair is corrective, where bears have a higher winning possibility after a breakout. Investors should wait for a valid bearish continuation opportunity in the intraday chart to follow the pre-breakout momentum.


