
Published: July 20th, 2021
The pound showed a negative momentum as a risk-averse trading condition, came from the tightening speculation from MPC members and Mann. In addition, the Brexit issue is weighing the Pound where the UK and the EU remained slower in decision making regarding the Northern Irish protocol.
UK inflation is showing an ugly face by coming at 2.5% YoY in June, higher than expected. Moreover, the wage growth moved higher by 7.3% in May, which came from increased spending.
However, the current recovery may get paused from a surge in the delta variant of coronavirus. Currently, the infection rate is increasing with hospitalization and mortality. Therefore, any uncertain situation may influence the UK government to make a U-turn. Although more than 50% of the UK population is vaccinated and 70% having received at least one dose, we should see how the government copes with the new strain.
Let’s see the upcoming price direction from the GBPCHF technical analysis:
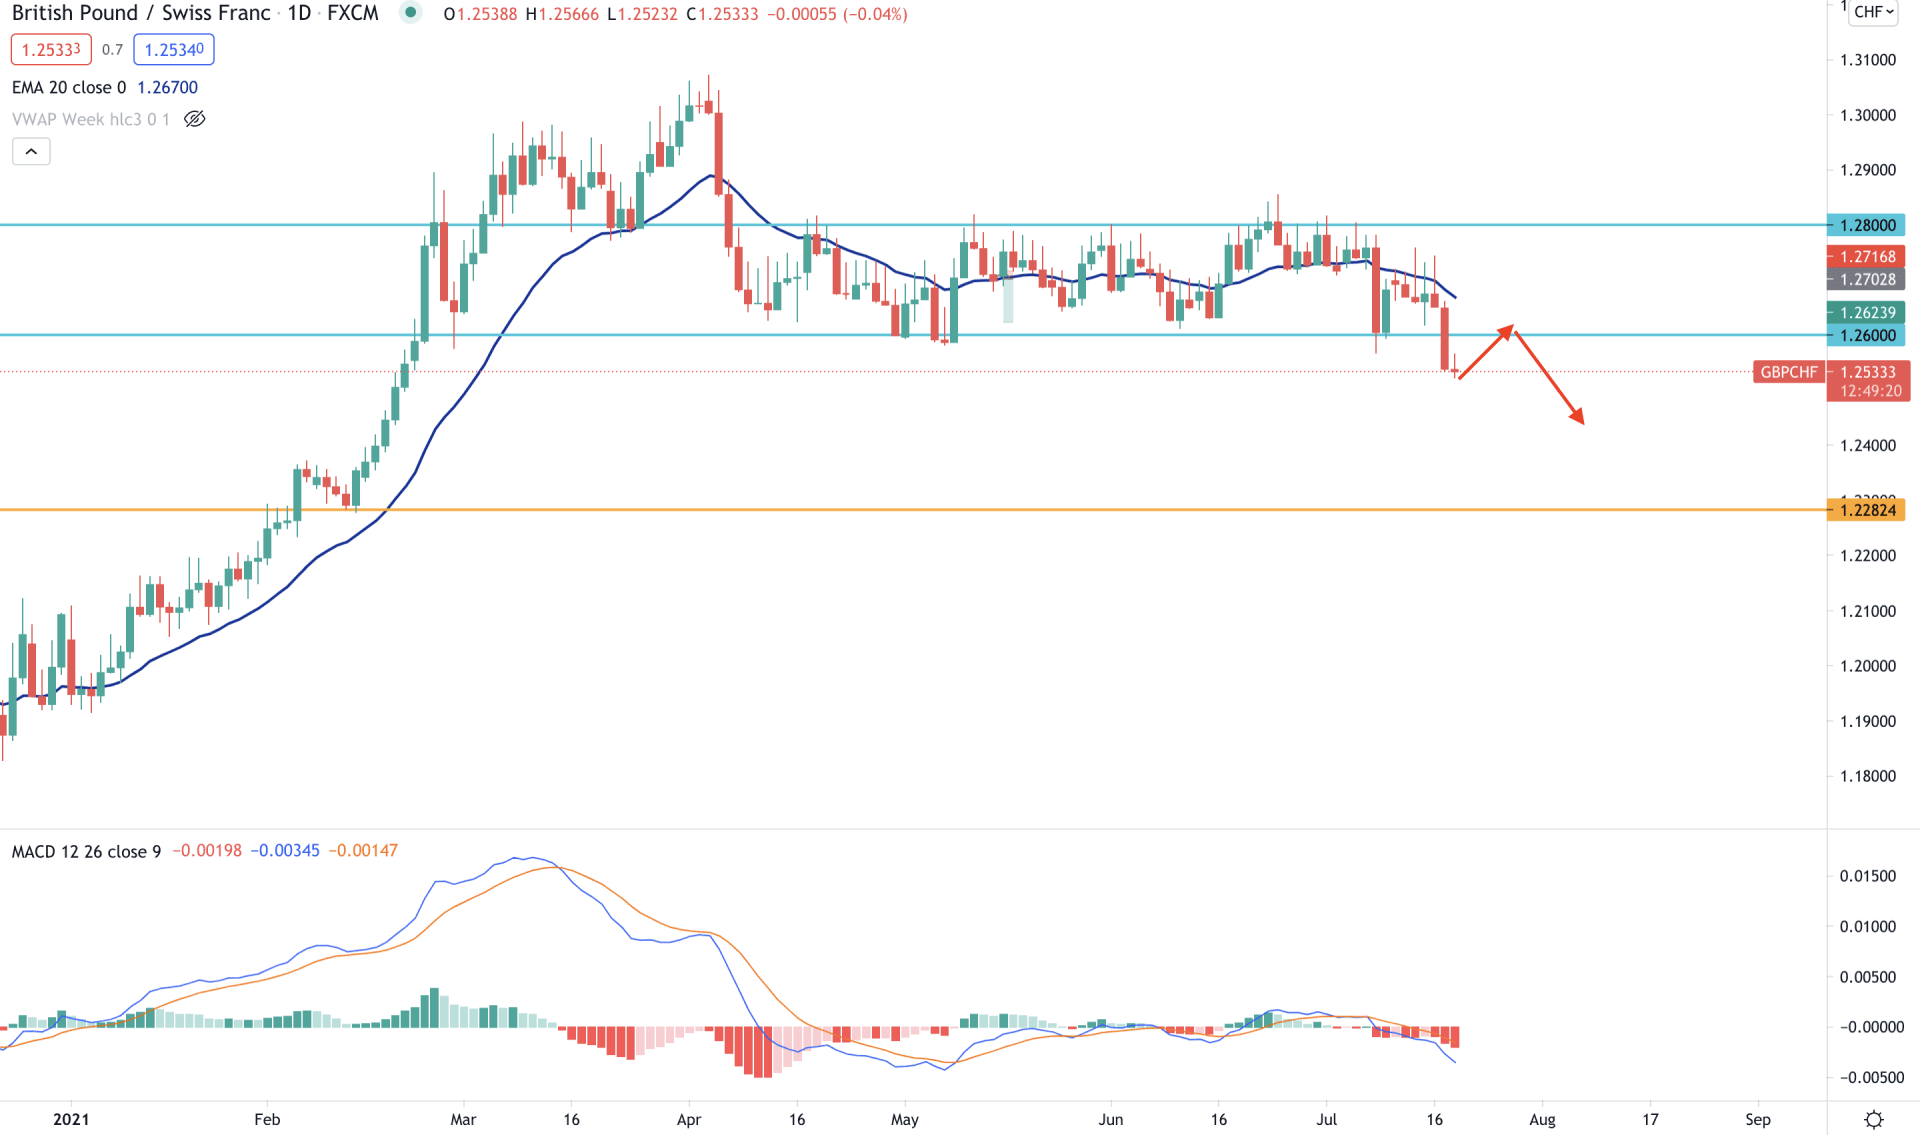
GBPCHF bears became active as soon as the price reached the 1.3100 key resistance level with a potential regular divergence in the price with MACD. As a result, the price moved down with an impulsive bearish pressure and started ranging between 1.2800 to 1.2600. After three months of consolidation, the price moved lower this week by breaking below the 1.2600 key support level with a massive bearish daily candle. Therefore, as long as the price is trading below the 1.2600 support level, it has a higher possibility of coming lower in the coming days.
In the daily chart, we can see that more than 50% of the candle’s body remained below the support level, which is a vital sign of a solid bearish breakout. Moreover, the price showed a pre-breakout structure within the range by showing multiple rejections from the dynamic 20 EMA. Therefore, the price may correct higher towards dynamic 20 EMA again before sowing another bearish leg.
Moreover, the MACD Histogram remained bearish and made new lows, which is a sign of a strong seller’s activity in the price. Therefore, the bearish market outlook towards 1.2282 may remain active as long as the price is trading below the 1.2600 level.
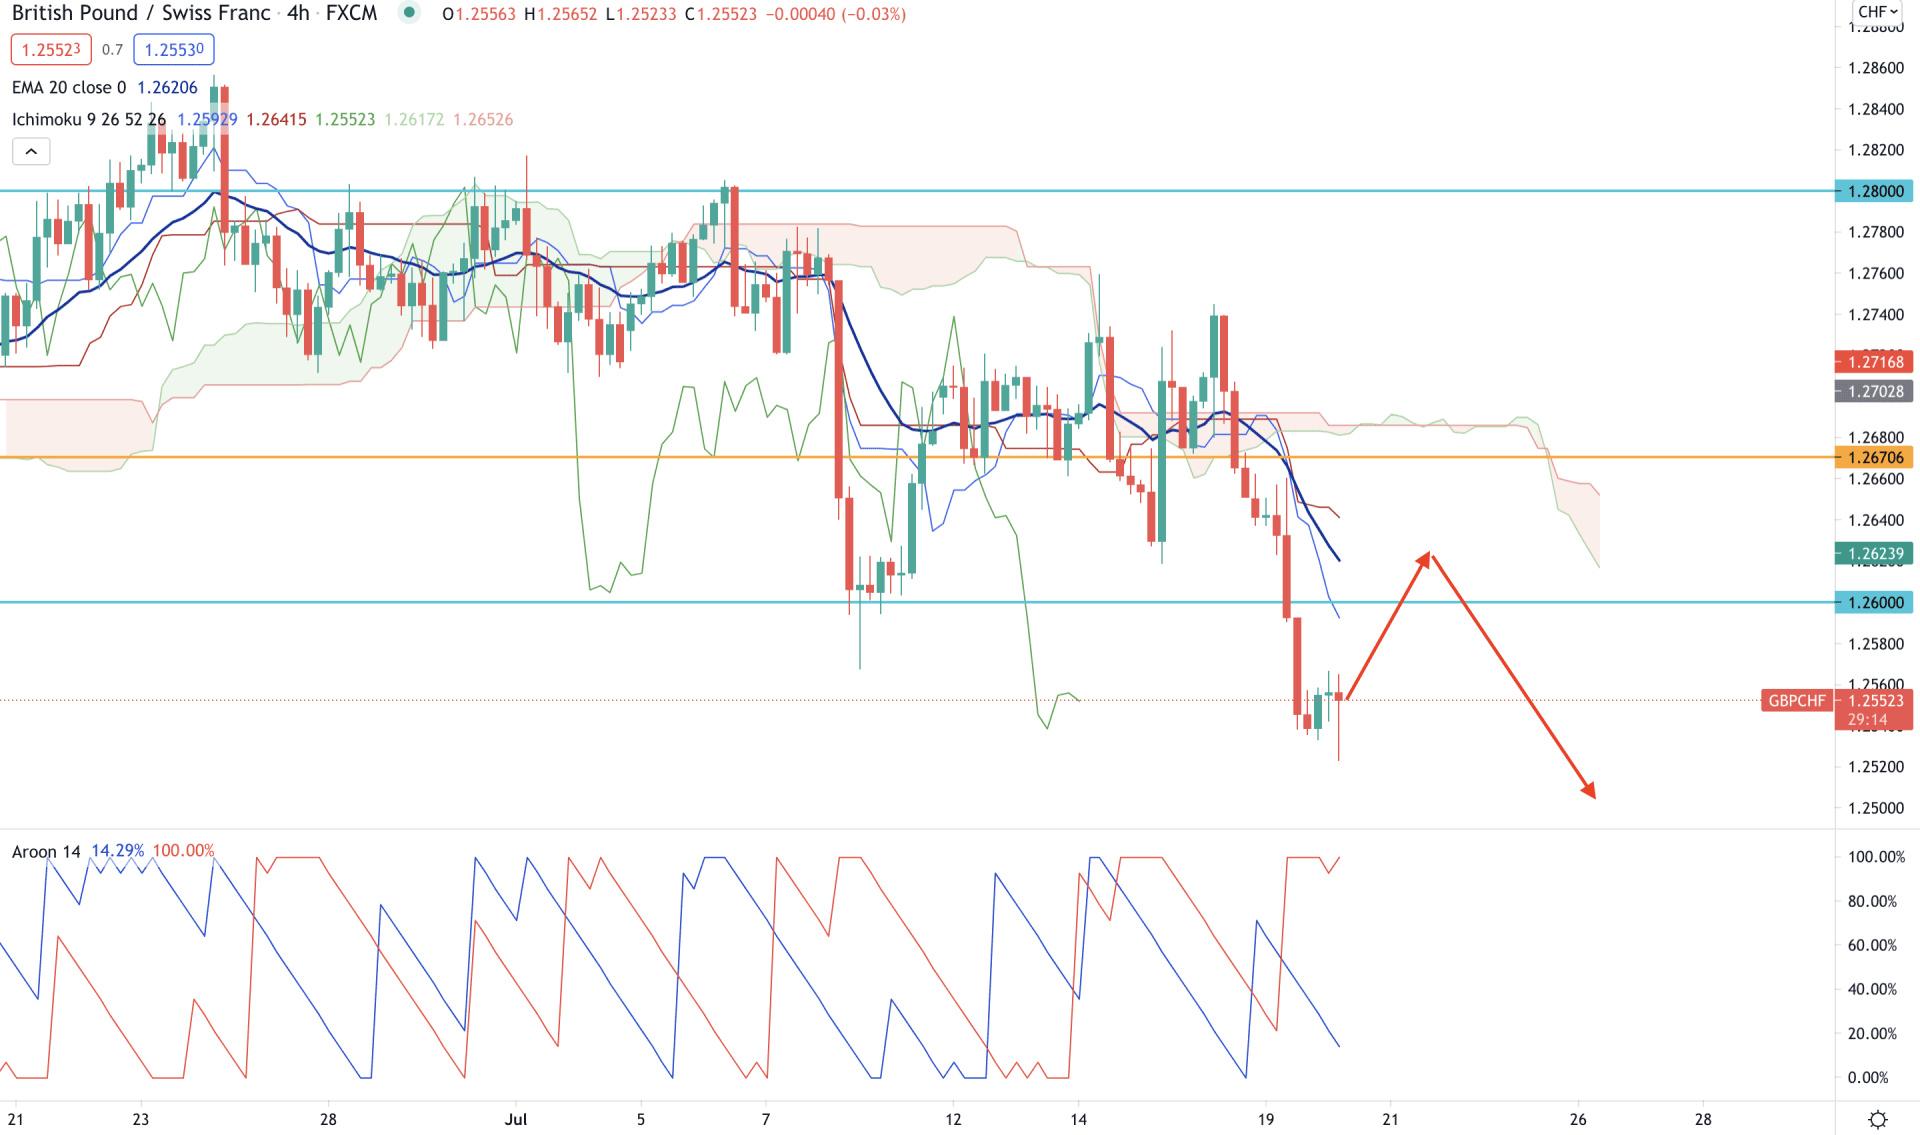
In the H4 timeframe, GBPCHF broke below the cloud support on 7 July and tried to remain above the cloud resistance but failed. Later on, the price moved lower by making a new intraday low this week. In the future cloud, Senkou Span A remained below the Senkou Span B and heading downwards while the Chikou Span remained below the price.
In the above image, we can see the price is trading below the intraday static resistance 1.2670 and dynamic Kijun Sen. However, as the price broke below the 1.2600 support level, it may correct higher towards 1.2600 to 1.2670 area. Any bearish sign below the 1.2670 level may initiate an intense selling pressure in the price towards the 1.2500 area.
Moreover, in the indicator window, Aroon Down (red line) remained at 100% level, pointing out an intense selling pressure in the price that may remain valid until Aroon Down is above Aroon Up (blue line).
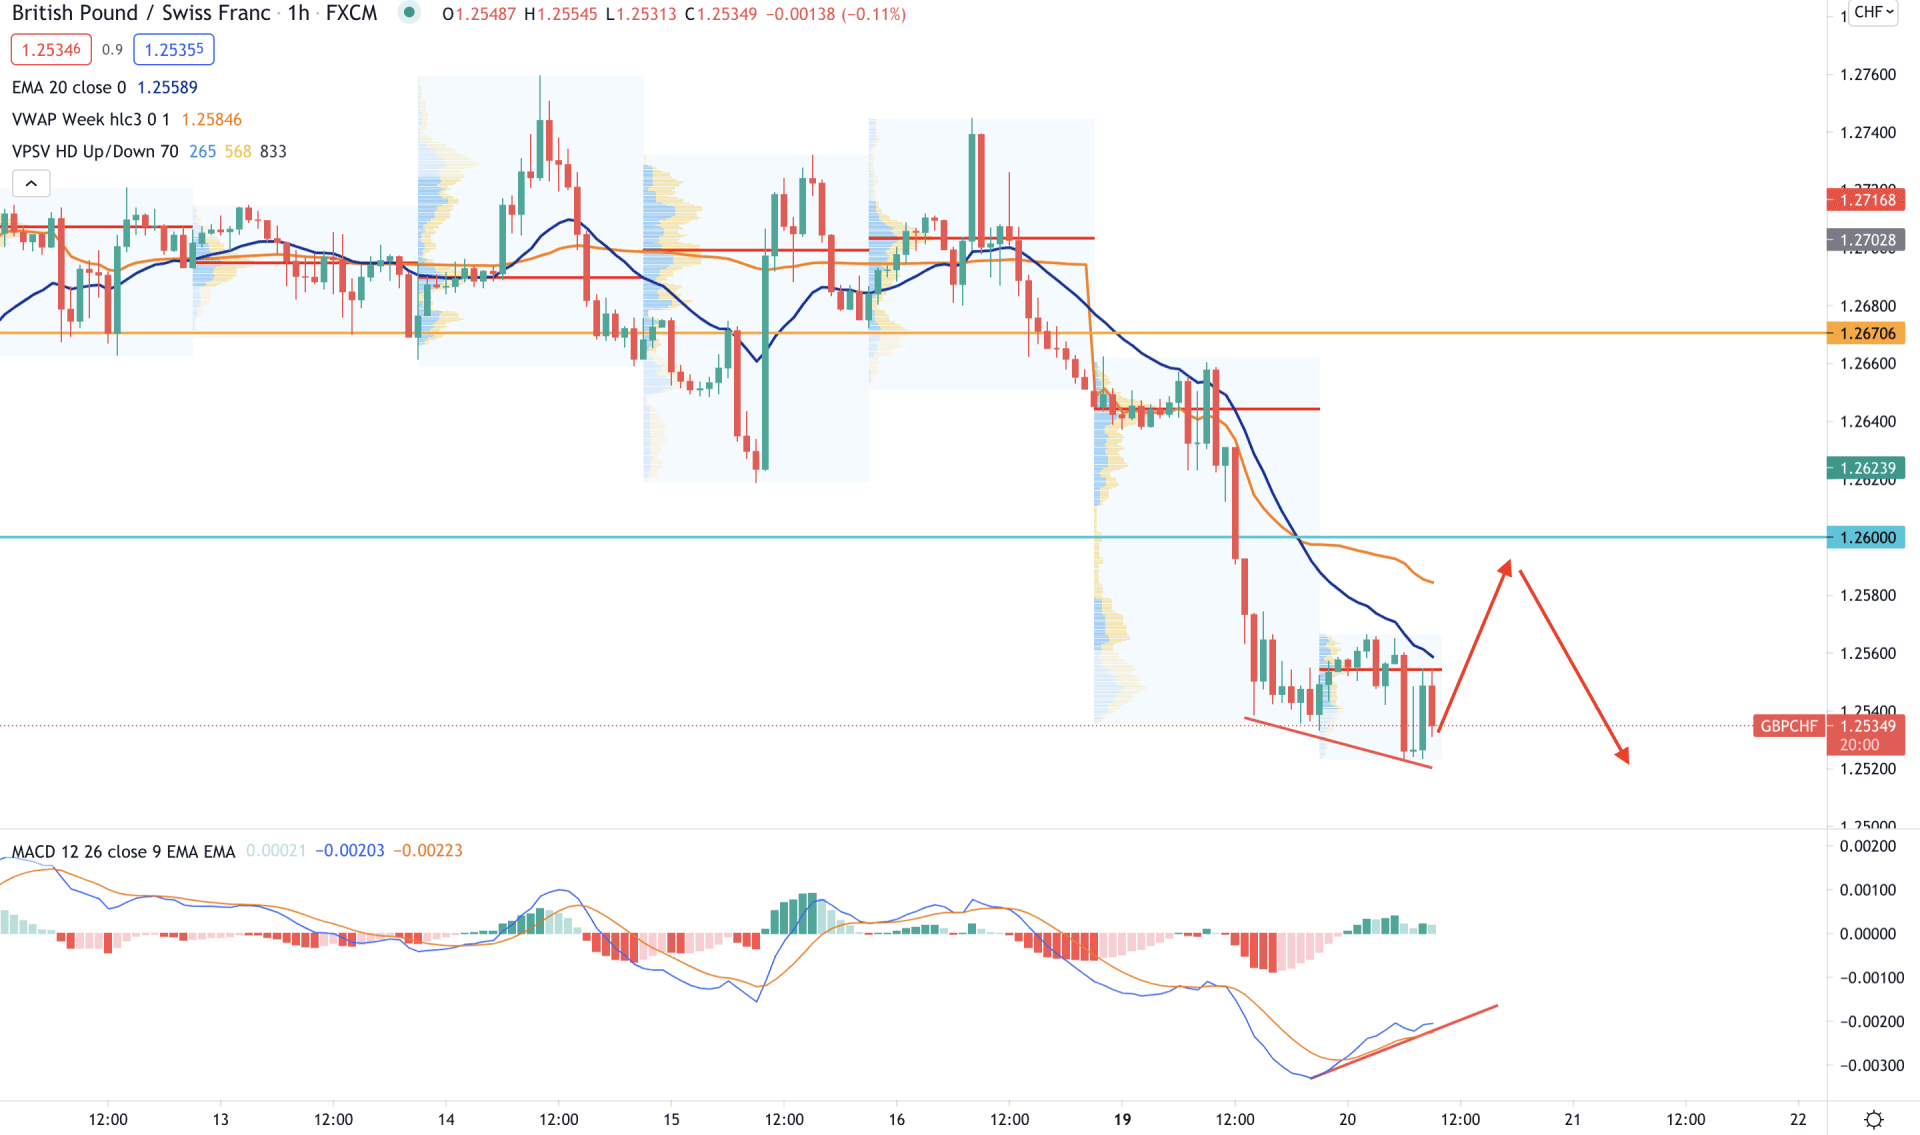
In the intraday chart, GBPCHF is moving lower by creating new swing lows where the intraday high volume level moved down from 1.2644 to 1.2556.
Moreover, the price moved lower from the dynamic 20 and vwap where vwap is currently working as a minor resistance to the price. Therefore, as long as the price is trading below the dynamic vwap level, it has a higher possibility of making a new intraday low towards the 1.2500 area.
However, before moving lower the price may show a bullish correction, followed by the regular divergence with MACD. Therefore, any rejection from vwap or static 1.2600 would be a selling point for this pair. However, a strong bullish H1 close above 1.2670 may make the bearish intraday sentiment as invalid.
As per the current observation, GBPCHF has a higher possibility of coming lower towards the 1.2281 level in the coming days. However, the bearish sentiment is valid as long as the price is trading below the 1.2670 intraday resistance level.
Any breakout above the 1.2670 with a strong bullish daily close may make the current sentiment invalid. In that case, the price may surge higher towards the upper line of the range, 1.2800 level.


