Published: May 22nd, 2025
The Pound Sterling (GBP) extended its gains on the release of the hotter-than-expected United Kingdom (UK) Consumer Price Index (CPI) data for April. The United Kingdom (UK) Office for National Statistics reported Consumer Price Index (CPI), which rose at a robust pace of 3.5% on year, compared to estimates of 3.3% and the March reading of 2.6%. This is the highest level seen since November 2023.
The stronger-than-expected UK data showed a surge in inflationary pressures, a major trigger that will discourage the Bank of England (BoE) from supporting an expansionary monetary policy stance further.
On the other hand, Switzerland's role as a safe haven has intensified recently. In a reversal of typical market behaviour in the days following April 2, investors responded to US President Donald Trump's aggressive trade rhetoric by dumping both US Treasuries and the dollar, fleeing what were once considered classic safe havens. Amid their search for shelter from volatility, demand for Swiss assets, most notably the franc and Swiss sovereign bonds, surged.
While this has strengthened Switzerland's reputation as a low-risk refuge, it has also created a dilemma for the Swiss National Bank, which now faces the dual challenge of managing currency strength, which is hurting its export-reliant economy, and fending off deflation as imports into Switzerland become cheaper.
Can CHF hold the gain against the Sterling? Let's see the complete outlook from the GBPCHF technical analysis:

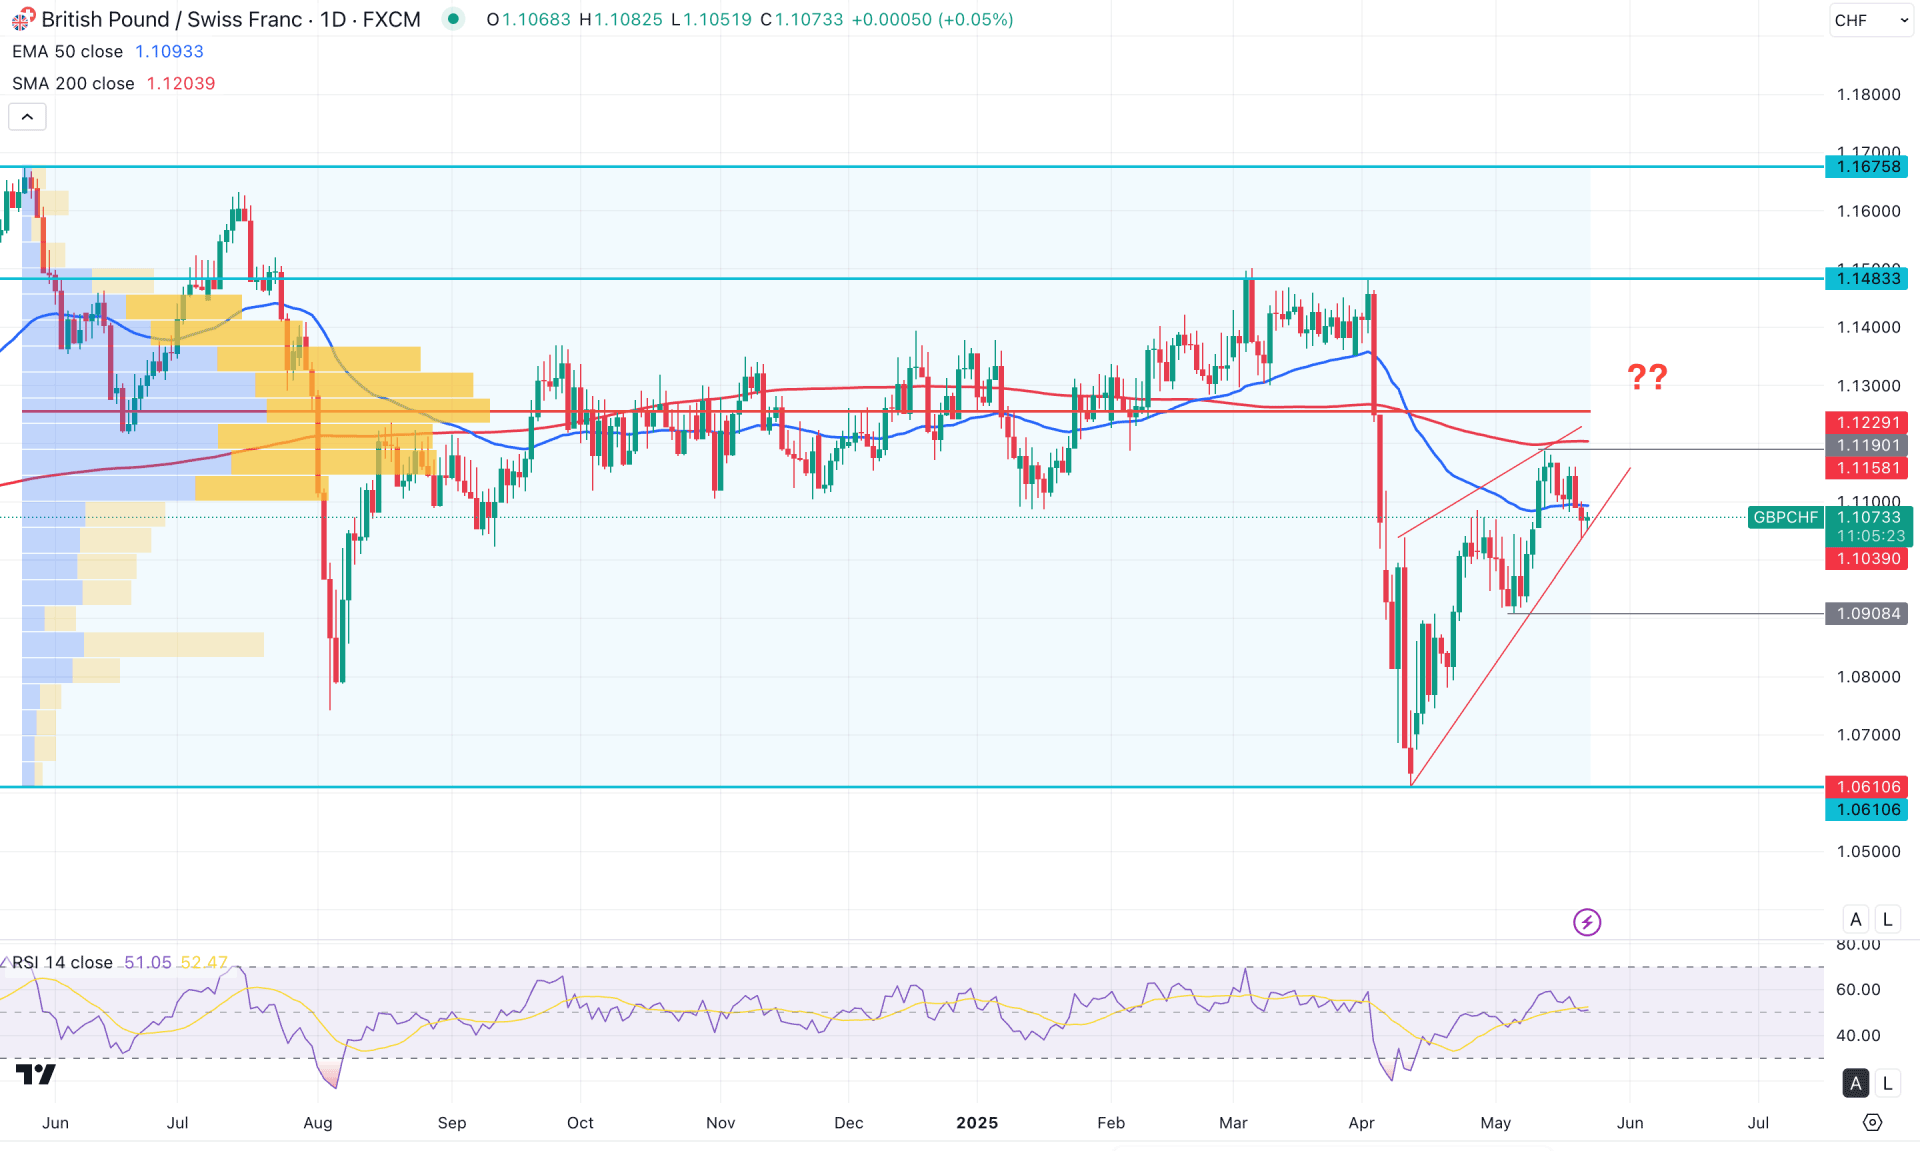
On the daily timeframe, GBPCHF trades sideways following a significant bearish rally. The price is now forming a rising wedge, from which a valid breakout could present a potential trend continuation opportunity.
On the monthly chart, the latest candle appears promising for sellers, forming a bearish engulfing bar after a prolonged consolidation phase. Traders should monitor how the price reacts at the monthly flip zone around the 1.0980 level. A bearish break below this level could resume the downtrend, potentially pushing the price below the 1.10 low.
The volume profile remains favourable for sellers, with the most active level since May 2024 at 1.1255, acting as a key resistance for buyers. Given that price is consolidating below this high-volume zone without forming new high-volume levels from the 1.0610 bottom, downside continuation remains likely as long as the 1.1255 resistance holds.
The 200-day Simple Moving Average is above the current price, serving as immediate resistance. Moreover, a bearish Death Cross has formed between the 200-day SMA and the 50-day Exponential Moving Average (EMA).
The latest daily candle closed below the 50-day EMA, suggesting a potential swing low that may confirm further downside.
The RSI rebounded after testing the 30.00 level and is now hovering near the neutral 50.00 mark. A new swing low accompanied by an RSI drop below 50.00 would strengthen the bearish case.
Given the current market structure, all dynamic resistance levels align favorably for a bearish continuation. Traders should closely monitor price action at wedge support. A conservative short approach would involve waiting for a bearish rejection below the psychological 1.1000 level. However, aggressive sellers may consider short opportunities near the 1.1100 to 1.1158 zone, especially after a daily candle closes below the 50-day EMA.
A bullish recovery above the 200-day SMA could negate the bearish outlook. In such a case, further consolidation or additional confirmation would be needed before anticipating the next directional move.

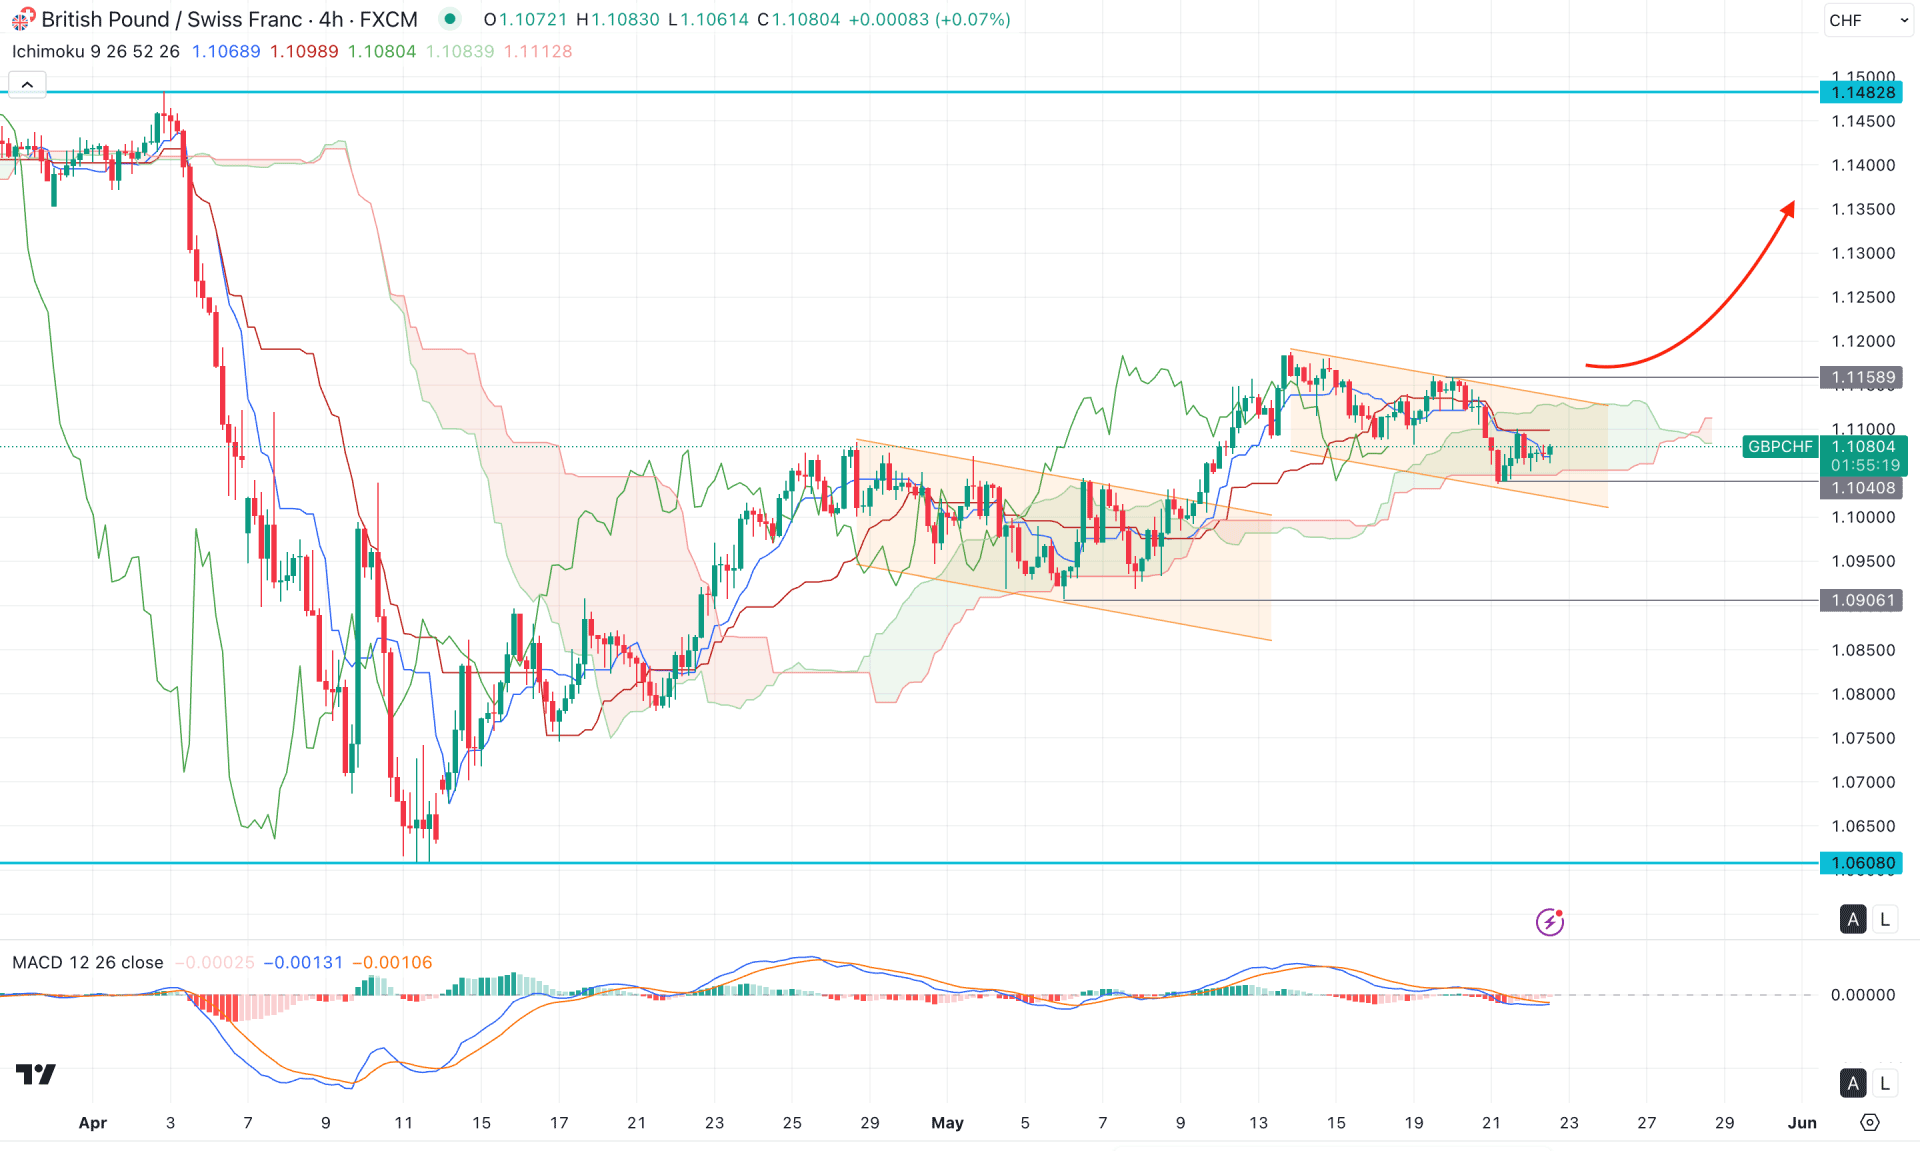
In the H4 timeframe, the recent price is bullish, followed by a rally-base rally formation. Moreover, the most recent price is trading within a descending channel, from which a bullish break is highly possible.
Moreover, the dynamic Ichimoku Cloud zone is within the current price, working as an immediate support. However, a clear direction is needed where the primary aim would be to find the price above the cloud high.
The bullish continuation is supported by the indicator window, where the current MACD Histogram reached the neutral area.
Based on the H4 outlook, a valid bullish cloud breakout with an H4 candle above the channel resistance could be a potential long opportunity, aiming for the 1.1400 high.
On the other hand, an extended bearish pressure below the 1.1040 low could offer another long opportunity after a valid bullish reversal. However, a bearish H4 candle below the 1.0906 level might extend the selling pressure towards the 1.0608 low.

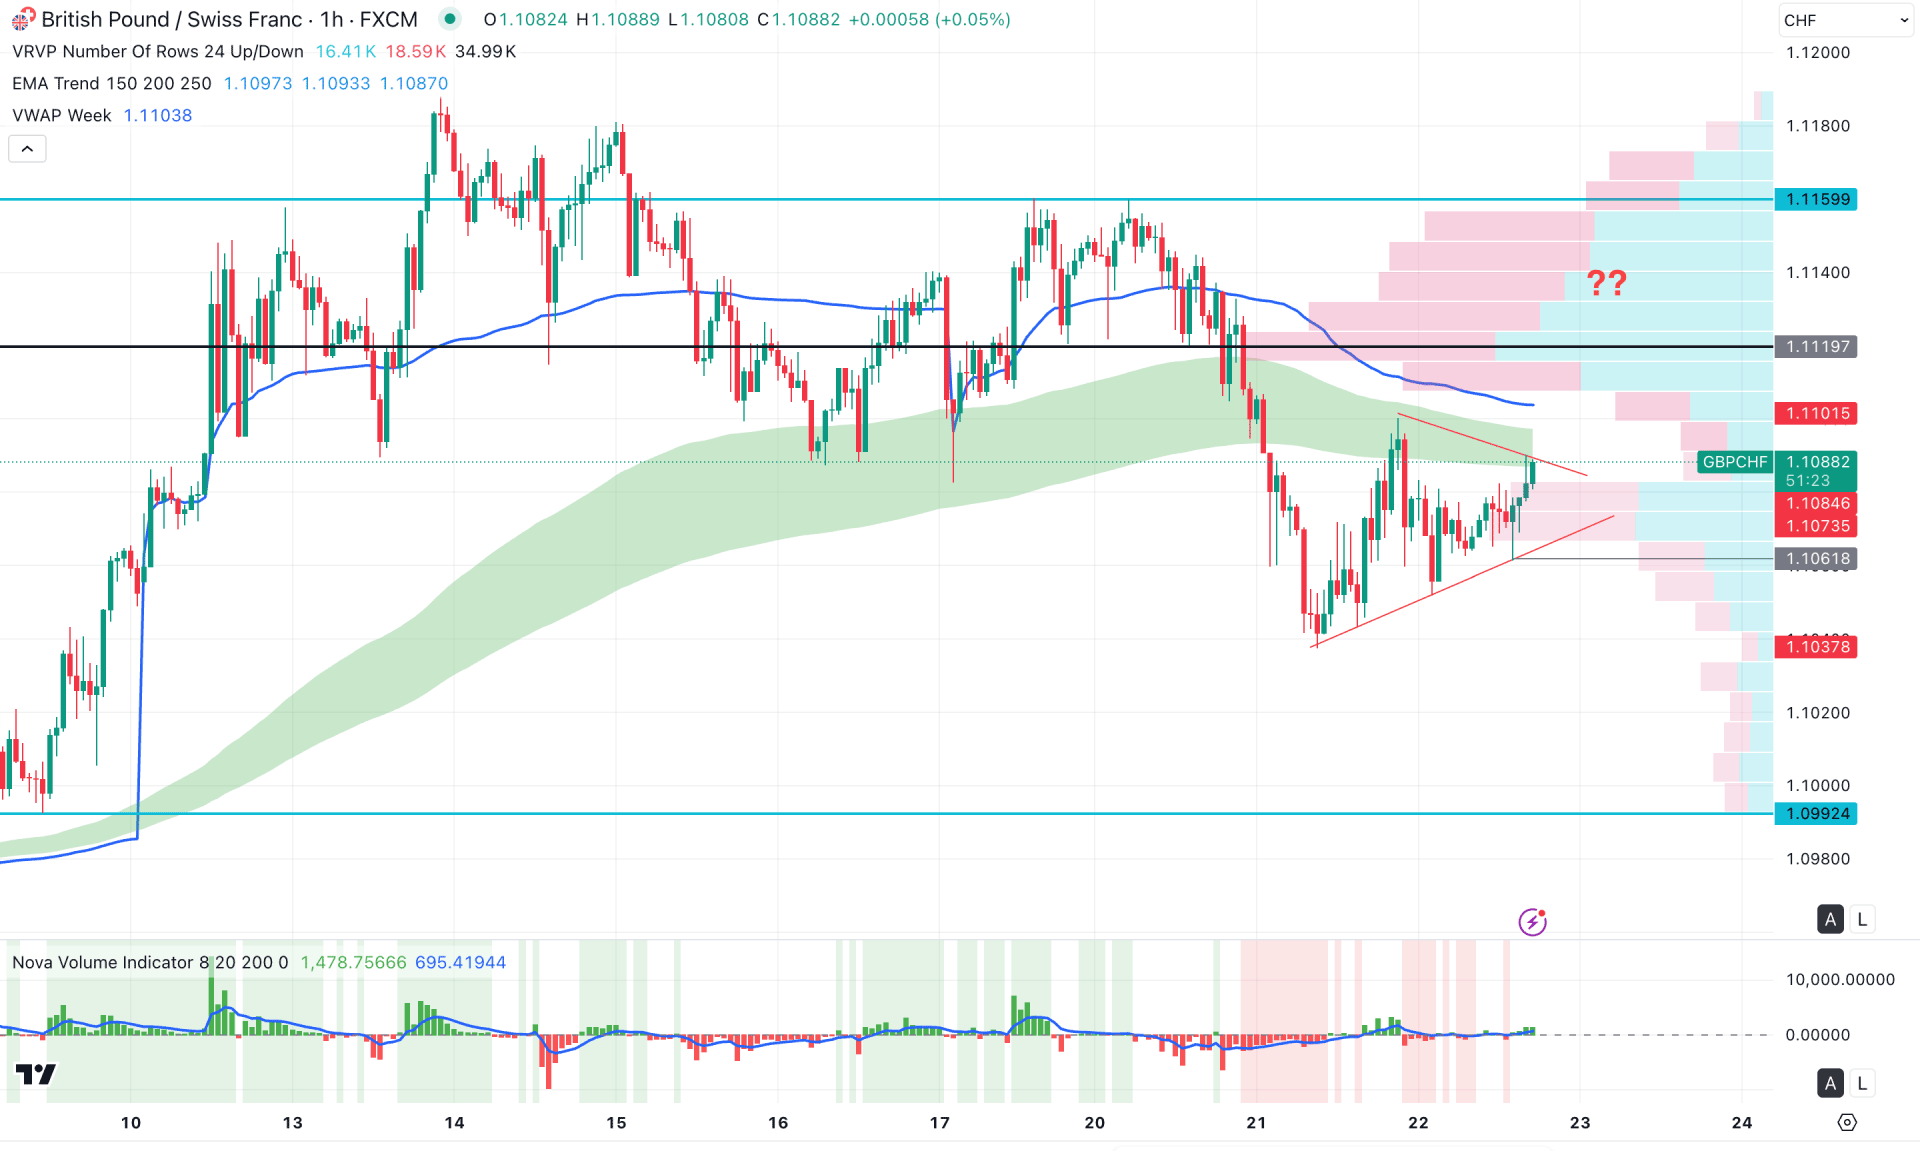
In the hourly timeframe, the recent price is trading within a bearish pressure as the Moving Average wave and weekly VWAP are above the current price. However, the most recent price is trading within asymmetrical triangle from where valid break is pending.
In the indicator window, the Volume Histogram represents a buying pressure in the market as the positive vertical lines are heading higher.
Based on this outlook, a bullish continuation with a stable market above the weekly VWAP line could be a potential long opportunity, aiming for the 1.1159 level. However, the ongoing selling pressure might extend after having a stable price below the 1.1061 level.
Based on the current market outlook, GBPCHF is trading with bearish momentum. A valid top formation is needed before anticipating a short opportunity. The intraday price is still sideways, and a valid liquidity grab is pending before forming a stable trend.