Published: October 10th, 2024
Andrew Bailey, the governor of the Bank of England (BoE), made dovish comments this week, raising the possibility that the central bank may be moving toward accelerating its rate-cutting process. This could, therefore, limit any significant gains for the GBPCAD pair and add to the GBP's relatively poor performance.
Traders may use the BoE Credit Conditions Index as a guide to seize immediate possibilities as we move into the big data uncertainties. However, the fundamental background indicated above indicates that the GBP/CAD pair's line of least resistance is downward, meaning that any further increase could still be viewed as a chance to sell.
Despite Israeli Defense Minister Yoav Gallant's assurance that the strike toward Iran would be "lethal, precise, and surprising," traders were nevertheless cautious about a possible increase in hostilities between the two countries. Along with a surge in demand for fuel following a significant storm in Florida, this raises concerns about Middle Eastern supply issues, which helps crude oil prices consolidate on their overnight recovery following a one-week low.
As a result, the Canadian dollar (CAD) receives little assistance, although gains are limited by anticipation of a bigger interest rate decrease by the Bank of Canada (BoC).
Let's see the further aspect of this currency pair from the GBPCAD technical analysis:

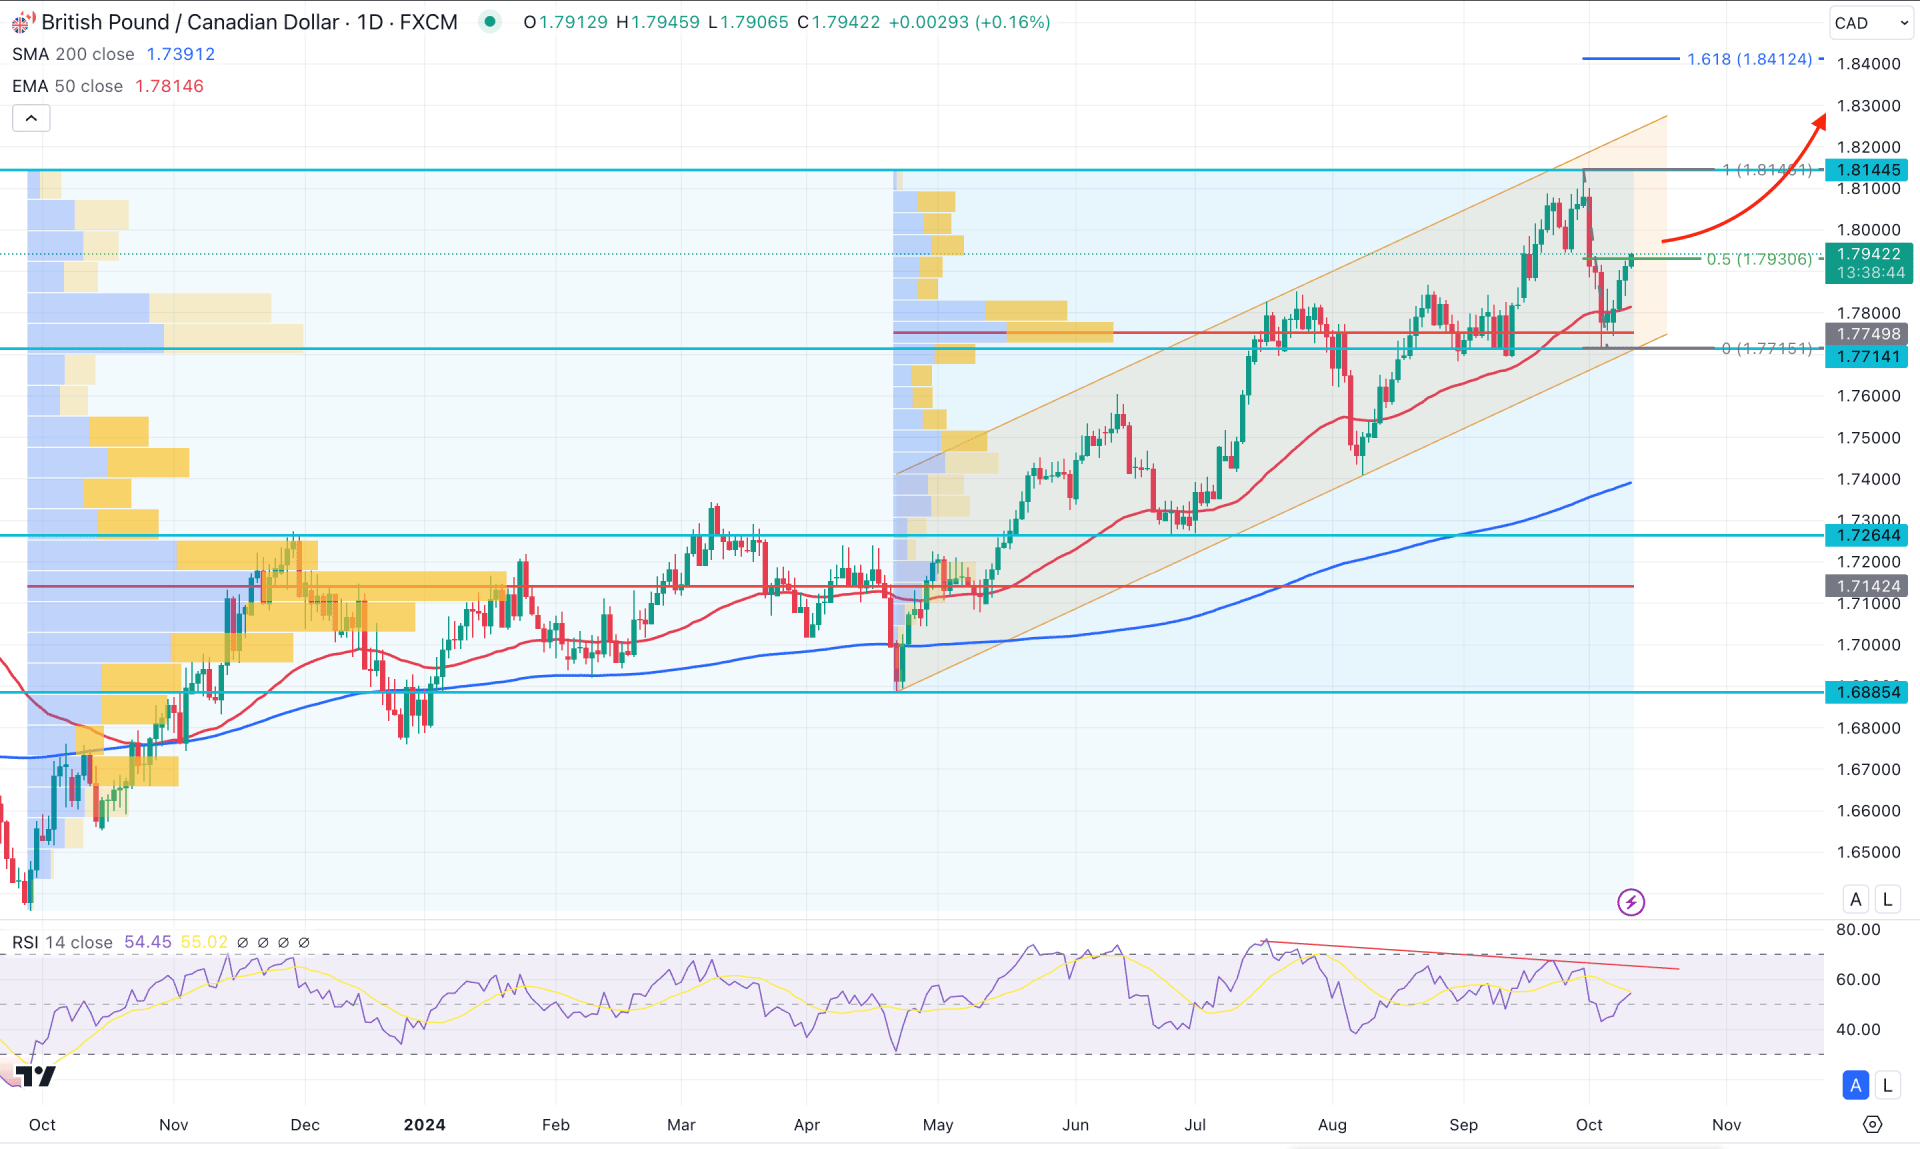
In the daily chat of GBPCAD, the broader market momentum is bullish as shown in the above image. After making a new yearly high, the price aimed lower and found support from the 1.7748 static level.
In the higher timeframe, a strong bullish monthly candle has formed in September, suggesting a valid bullish continuation opportunity. Later on, the price went sideways and still traded within the bullish body. The weekly price shows a different story, where the latest candle has formed as a bearish engulfing pattern. In this context, the bullish continuation possibility from the monthly time frame could provide a valid long opportunity after overcoming the 1.8144 high with a valid weekly close.
The volume shows a positive outlook from bulls as the current high volume level since May 2024 is just below the current price and working as immediate support.
The main price chart shows a bullish continuation, with the 200-day SMA acting as major support. Moreover, the 50-day EMA is closer to the current price, with a valid bullish reversal in recent price action.
In the indicator window, the 14-day RSI shows a valid buying pressure as the current line hovers above the 50.00 line with steady buying pressure.
Based on the daily market outlook, the ongoing buying pressure might continue and test the yearly high of 1.8144. However, the buying pressure is valid as long as the current price hovers above the trendline support.
A strong downside pressure with a daily candle below the 1.7714 level could invalidate the bullish possibility and lower the price toward the 1.7264 support level.

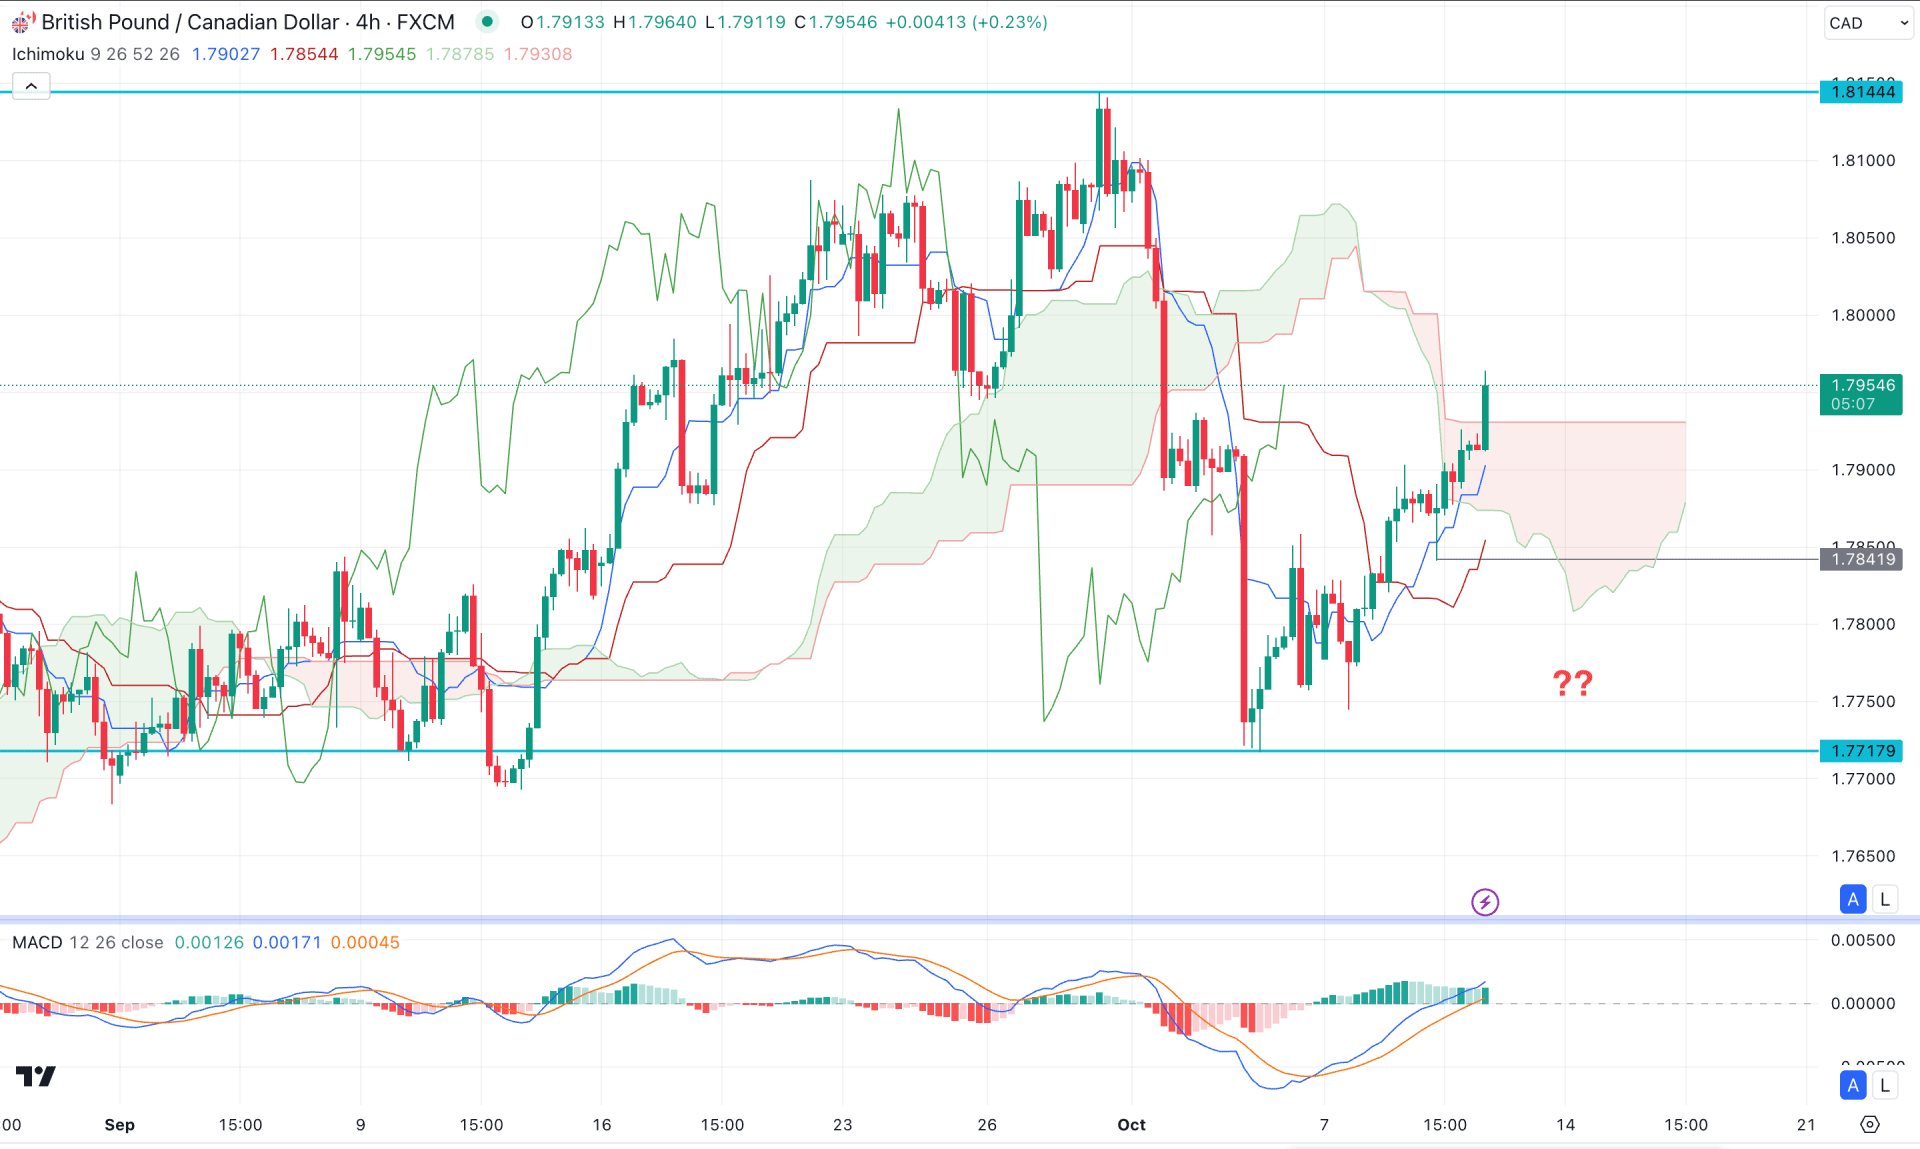
In the H4 timeframe, the broader market context is sideways, with the ongoing price heading above the Ichimoku Cloud zone. However, the buying pressure is supported by a valid bottom formation at the 1.7717 level.
In the futures cloud, the short-term buying pressure is potent as the Senkou Span A aimed higher. However, the Senkou Span B remained flat above Senkou Span A, which needed a flip to validate the long opportunity.
In the indicator window, the current Histogram is holding the upward pressure above the neutral line, suggesting a buying pressure. As no consolidation is visible above the cloud high, investors should monitor how the price reacts above this line.
A minor bearish recovery with a bullish reversal from the dynamic Kijun Sen could increase the bullish possibility, towards the 1.8100 level.
Alternatively, a failure to hold the price above the 1.7841 low could be a challenging factor to bulls, which might lower the price towards the 1.7700 psychological line.

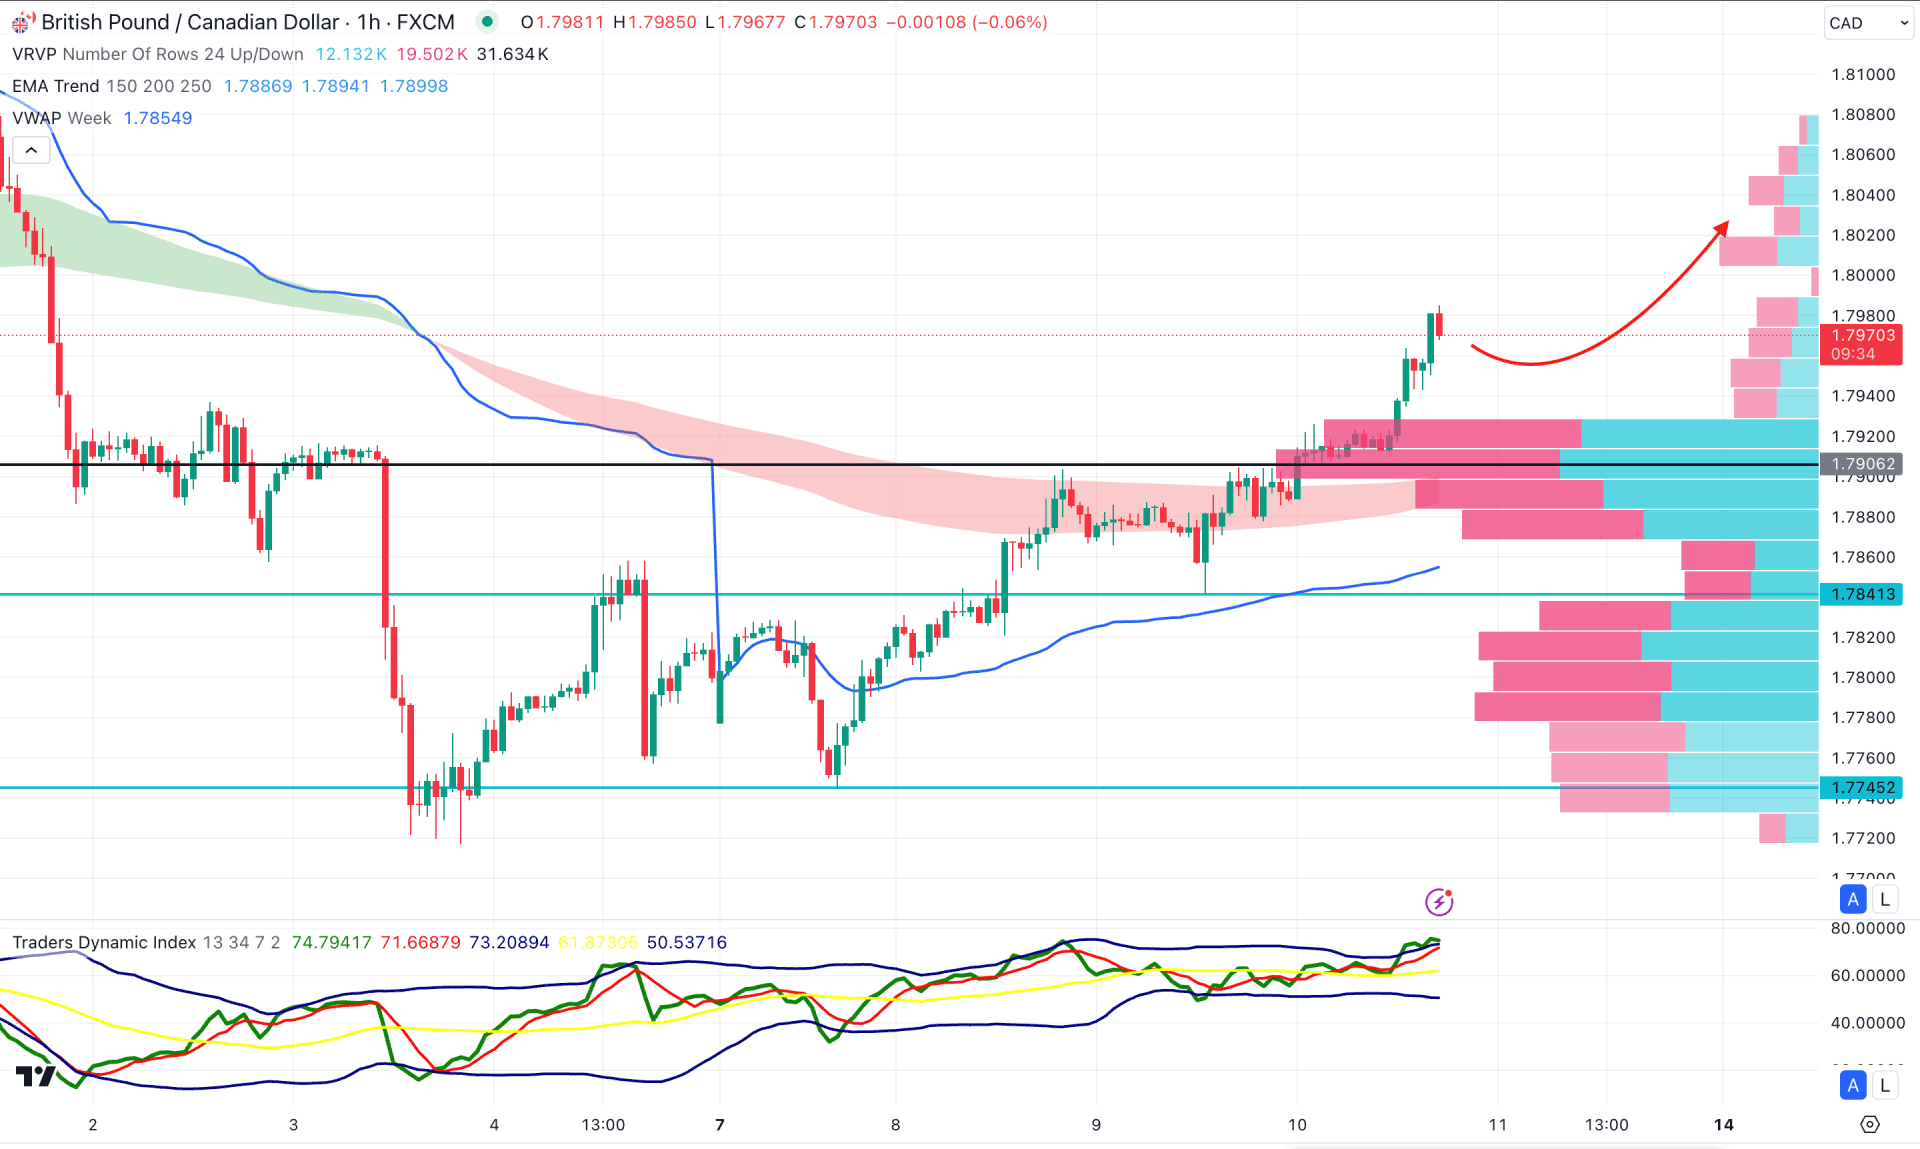
The hourly chart clearly shows intraday buying pressure, with the recent price hovering above the Moving Average wave zone. The buying pressure is potent as long as the current price hovers about the EMA wave. Moreover, the visible range high volume line is below the current price, which indicates confluence buying pressure.
Although the upward pressure is potent, the Traders Dynamic Index (TDI) has reached the upper bands area, suggesting a pending downside correction.
Based on the hourly price action, a bullish correction is pending in the hourly chart, which might find support at the 1.7906 level. In that case, a valid bullish reversal from the 1.7940 to 1.7880 zone with an hourly close above the weekly VWAP line could open a long opportunity aiming for the 1.8100 level.
Based on the current multi-timeframe analysis, GBPUSD is more likely to extend the buying pressure and find resistance from the ascending channel high. As the intraday price is trading sideways, a valid bullish reversal could open a long opportunity, following the major trend.