
Published: October 13th, 2021
The British Pound faced a slight loss at the beginning of this week, but the situation changed with the renewed Brexit optimism. The European Union’s proposal to remove the 50% British custom checks in the Northern Ireland border helped the Pound get more potent than the CAD. According to the European Commission, Vice President of Interinstitutional Relations and Foresight, there is a significant change in the surrounding movement regarding UK goods.
Besides the positive development, the better-than-expected UK monthly Gross Domestic Product moved higher by 0.4% in August compared to the analysts’ estimation of 0.5%. Moreover, the National Statistics of the UK released the Manufacturing and Industrial production with a robust pace than the previous release.
On the other hand, the Canadian Dollar showed a robust growth after the employment report last week where the unemployment rate was down from 7.1% to 6.9% in September. Therefore, the CAD gained strong momentum against the basket of currencies. The GBP/CAD remained in a solid bearish trend from 20 September 2021. However, this week is almost muted for the CAD excerpt of the Manufacturing sales today. Therefore, a correction is pending in the GBP/CAD, where bulls are more likely to gain momentum.
Let’s see the upcoming price direction from the GBP/CAD technical analysis:
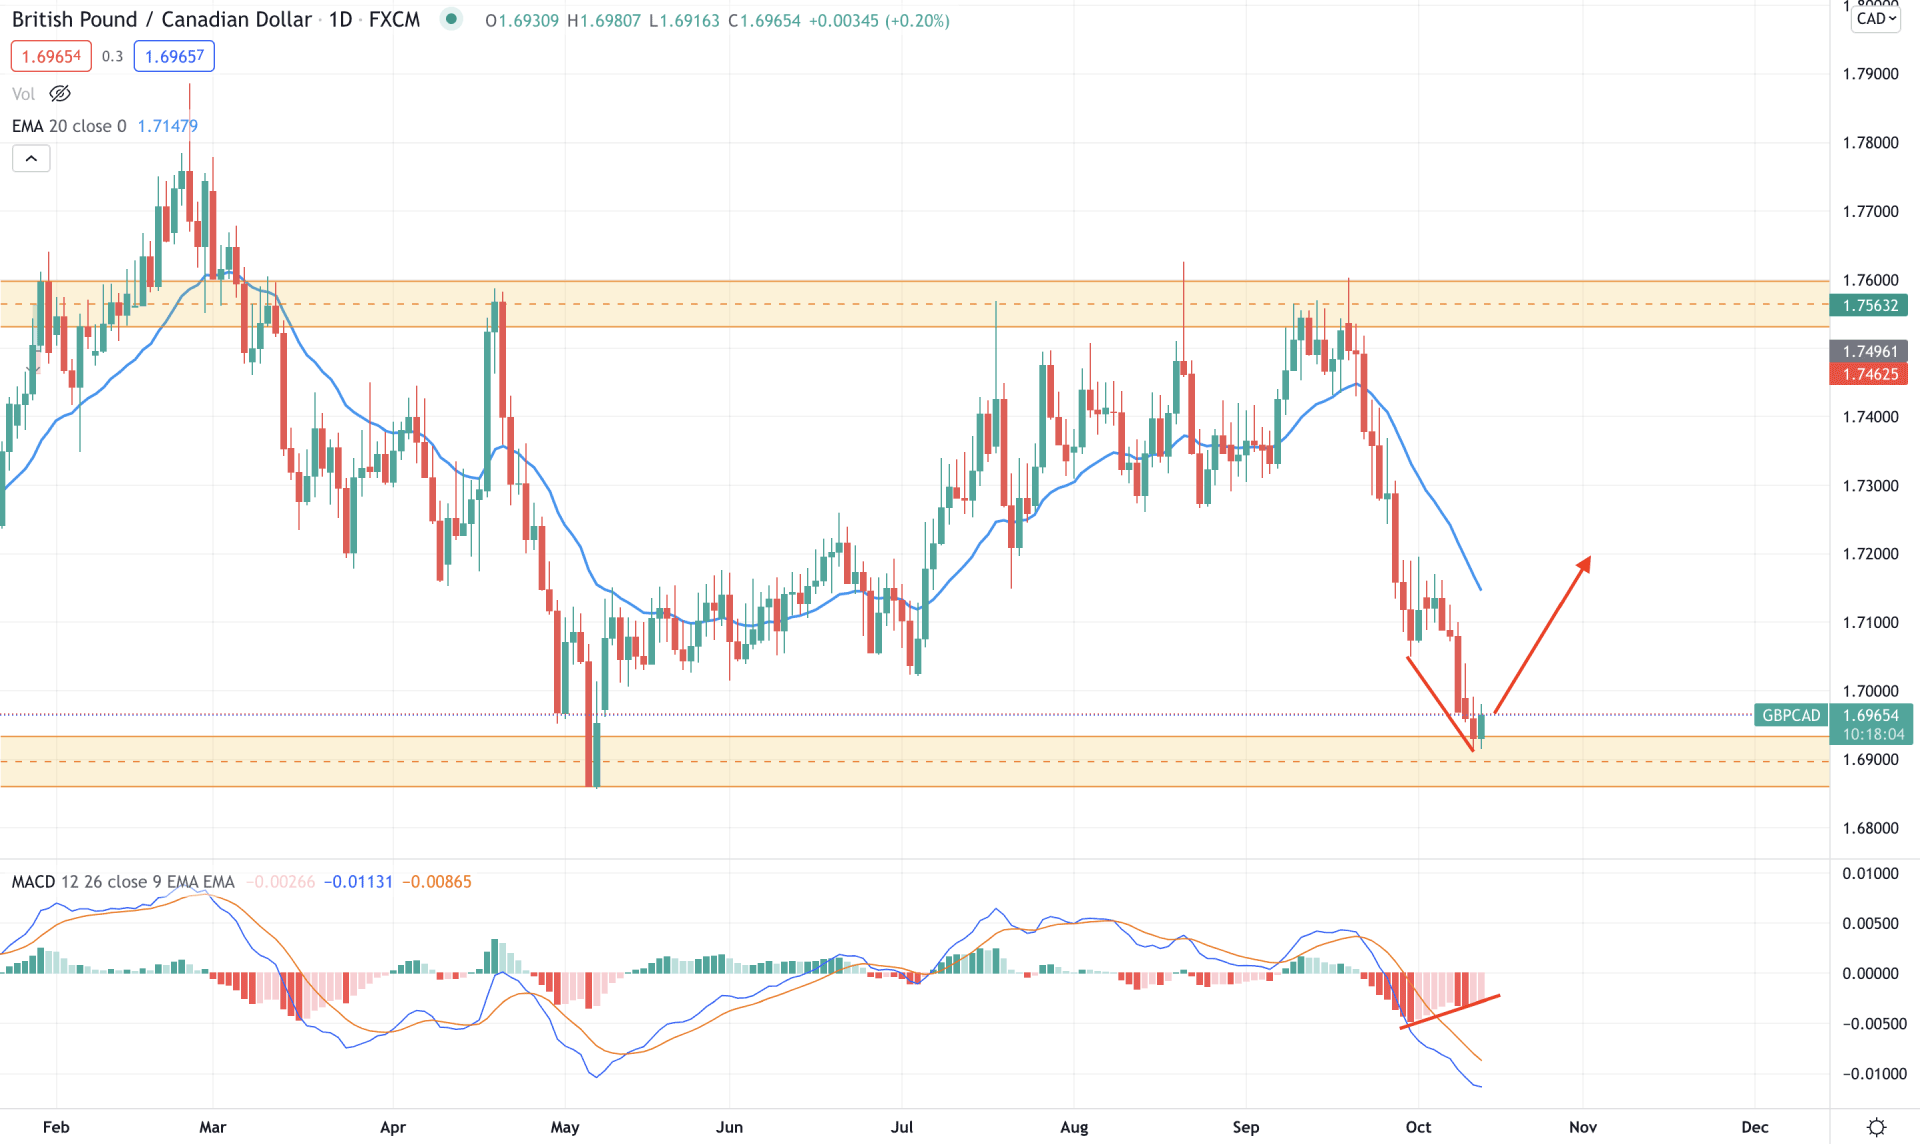
GBP/CAD is trading within a long-term correction where the price found 1.6880 as a bottom and 1.7600 as a top. Before the June opening, GBP/CAD bears made an aggressive downside pressure in the price where bulls recovered the momentum from the 1.6880 level. Therefore, the demand area from 1.6920 to 1.6880 level has become crucial for now.
The above image shows how the price faces support from the demand zone as marked in the image where the gap between the dynamic 20 EMA and price is expanded. As a result, as long as bulls hold the daily candle above the 1.6900 level, we can expect a bullish pressure towards the 0.7200 area.
Moreover, the possible bullish pressure is supported by the Hidden Divergence formed in the MACD Histogram, but investors should closely monitor how the price reacts on the 1.6880 level. Any solid bearish daily close below this level may make the current bullish pressure invalid and increase the volatility of the price.
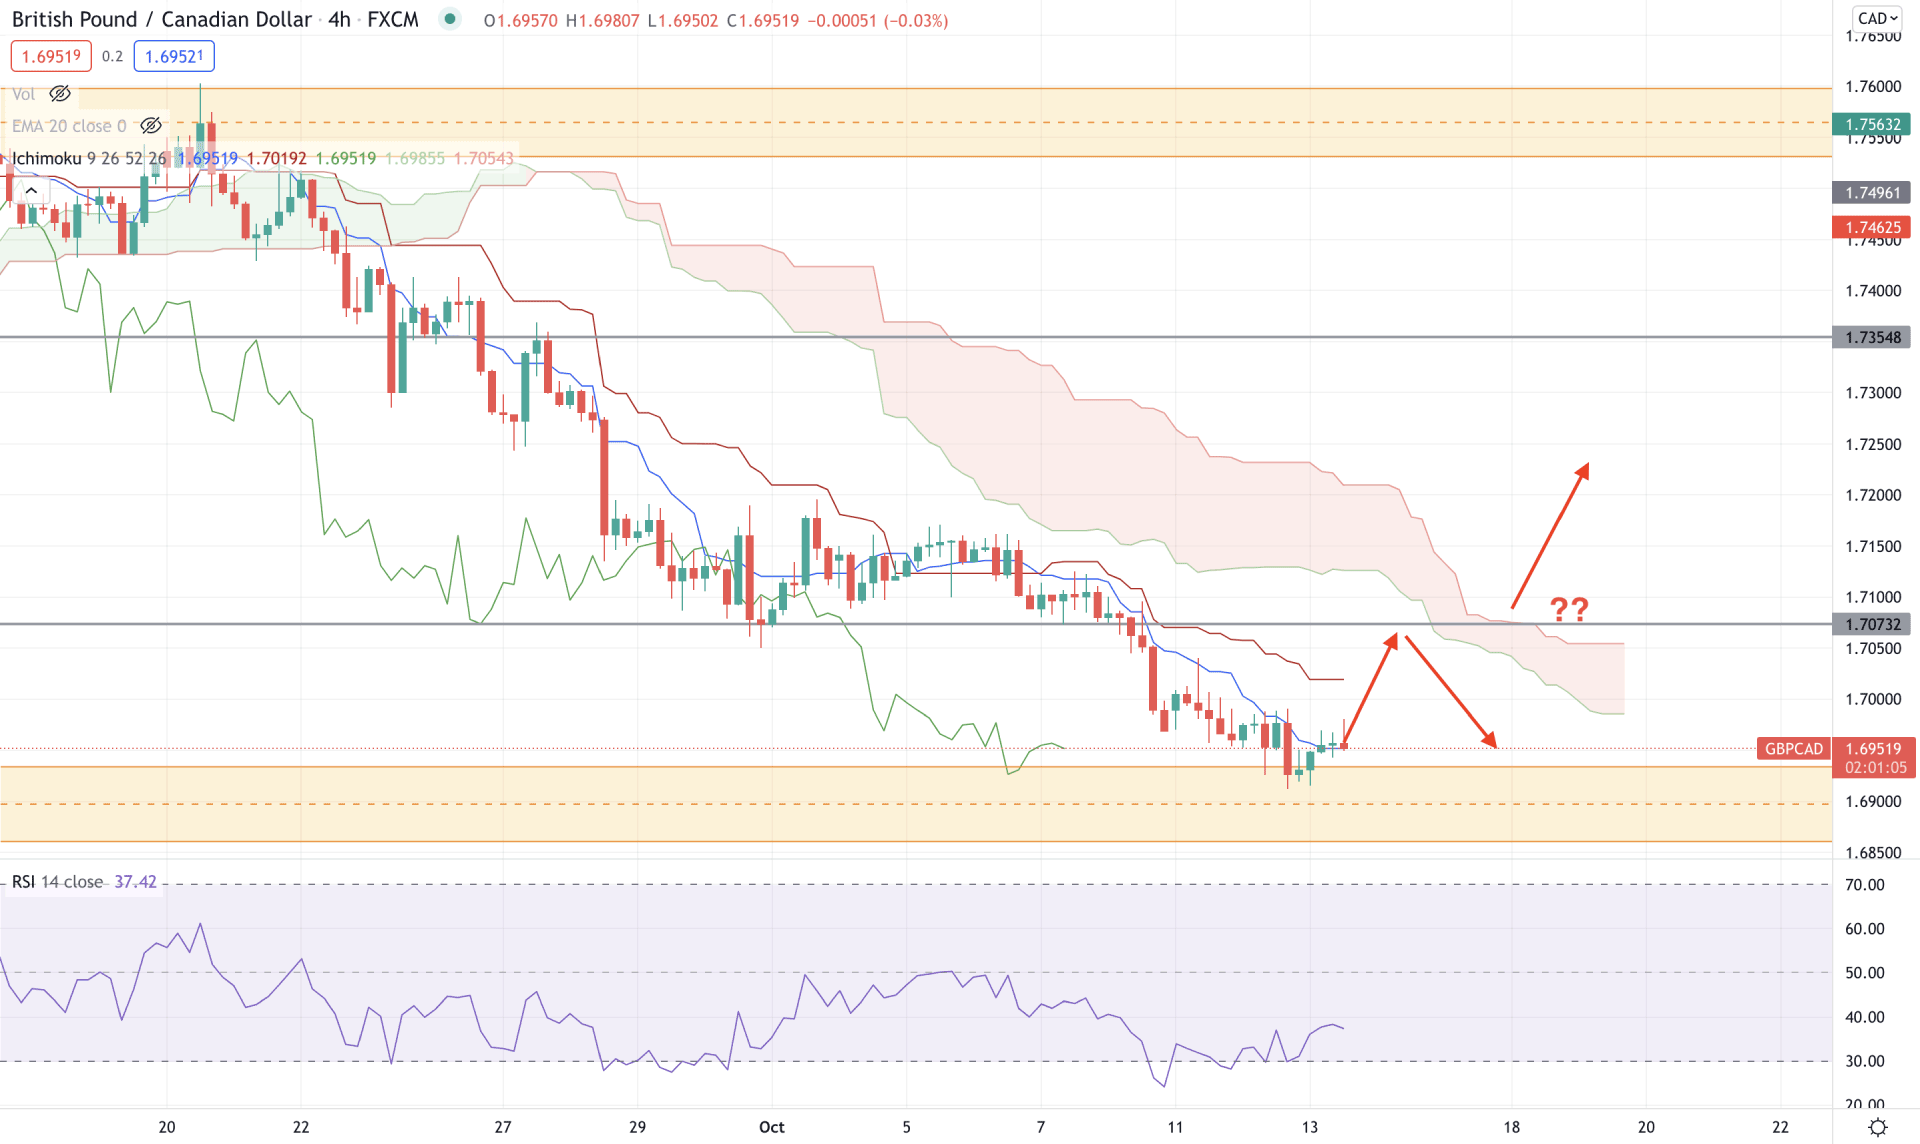
In the H4 timeframe, the bearish trend started from 22 September, when a bearish H4 candle came below the Kumo Cloud. As a result, the price began to move lower where the dynamic Tenkan Sen and Kijun Sen worked as minor resistance. However, the price is currently facing support from the 1.6900 level and moved above the dynamic Tenkan Sen. Therefore, the short-term target may remain bullish until the price breaks below the 1.6900 level with a bearish H4 close.
The above image shows how the Future cloud became flat like the dynamic Kijun Sen. Meanwhile; the RSI has rebounded from the 30 levels and is aiming higher, which is a primary indication of bullish pressure. Therefore, based on the H4 context, any selling pressure from the 1.7073 level with a bearish H4 close below the Kijun Sen may resume the current trend towards the 1.6800 level. On the other hand, a bullish H4 closing above the 1.7073 level may alter the existing market structure and initiate a bullish trend.
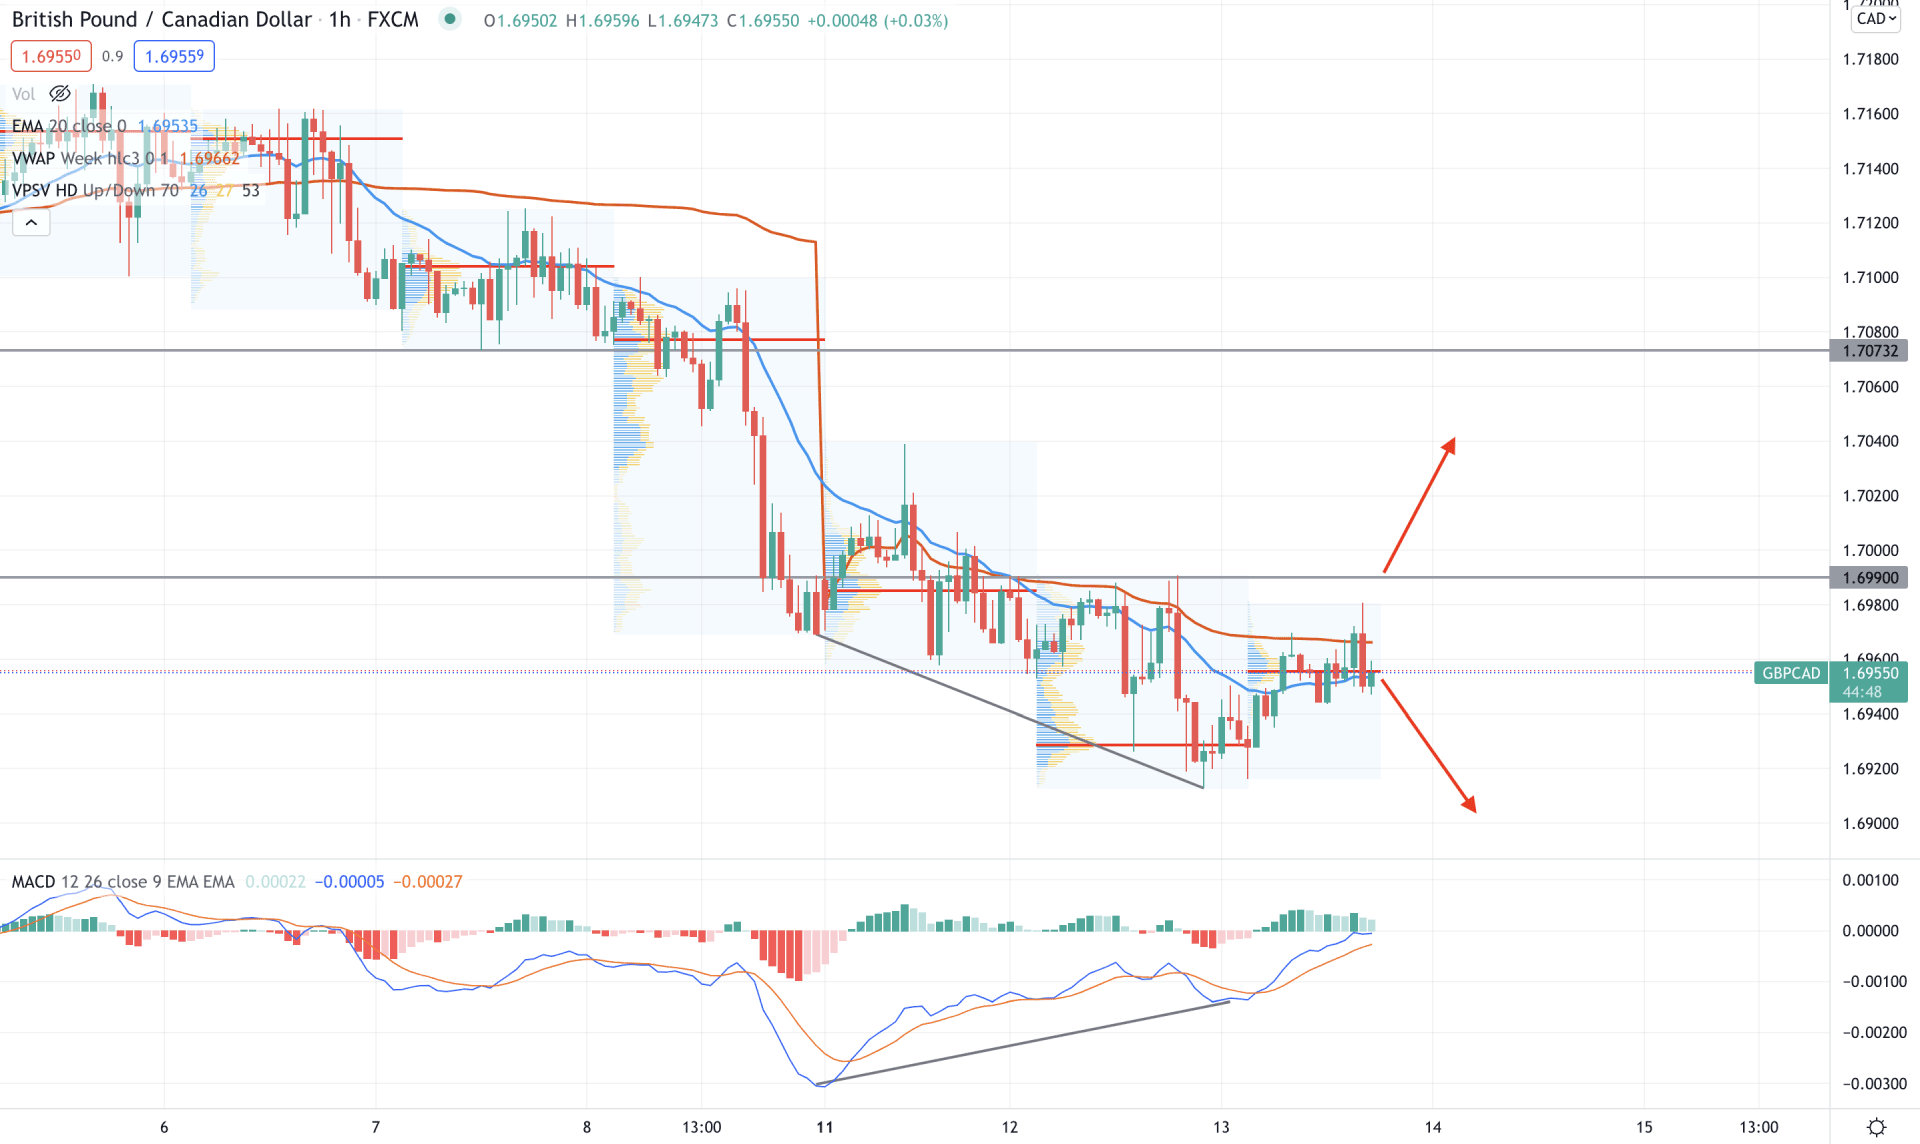
In the intraday chart, GBP/CAD is still bearish, but the most recent price action increases volatility. As a result, the price failed to make a new low in the high volume level and moved above the dynamic 20 EMA. However, the bearish pressure is still valid as the price is trading below the 1.6990 intraday event level. In that case, a bearish pressure may be expected towards the 1.6850 level.
The above image shows how the price is trading at the 1.6956 high volume area, where a bearish H1 close appeared below the dynamic 20 EMA and vwap. However, the volatility with a regular divergence raised a question regarding the upcoming bearish pressure.
Based on the H1 context, any bullish H1 close above the 1.6990 level may invalidate the current bearish sentiment. In that case, the price may move higher towards the 1.7073 area. On the other hand, a new swing low below the 1.6940 level with a bearish H1 close may resume the current trend towards the 1.6850 area.
As per the current price action, GBP/CAD intraday sentiment is still bearish, where bulls should wait for a bullish H4 close above the 1.7073 level to raise the price towards the 1.7354 level. However, any intraday H1 candle below the 1.6940 level may make another bearish push towards the 1.6850 level.


