
Published: October 5th, 2022
A strong bullish recovery in the GBPCAD price is backed by strong bullish exhaustion below the multi-year low. The buying pressure is backed by the Bank of England’s decision to buy government bonds to save the Pound from falling.
As a part of the recovery, starling started the week by arriving at the highest peak in six trading days. The United Kingdom government primarily drives the ebullience by rolling back its decision to cut income tax top rate alongside the highest income tax removal of 45%, a controversial move that resulted in sharp depreciation value in UK bonds and pound sterling.
On the other hand, Canada’s latest manufacturing data signaled another difficult month with output and repeated slipping of new orders. Client uncertainty and the interest rate hike hit the demand while seeing growths of less optimistic firms over their output expectations for the year ahead.
Subsequently, inventory holdings, staffing levels, and purchasing activity declined for the second month on and on. However, there were positive price fronts with both the output charge inflation easing and input price to twenty-two-month lows.
Can GBPCAD price extend the buying pressure?
Let’s have a look at the future price of GBPCAD from the GBPCAD technical analysis:
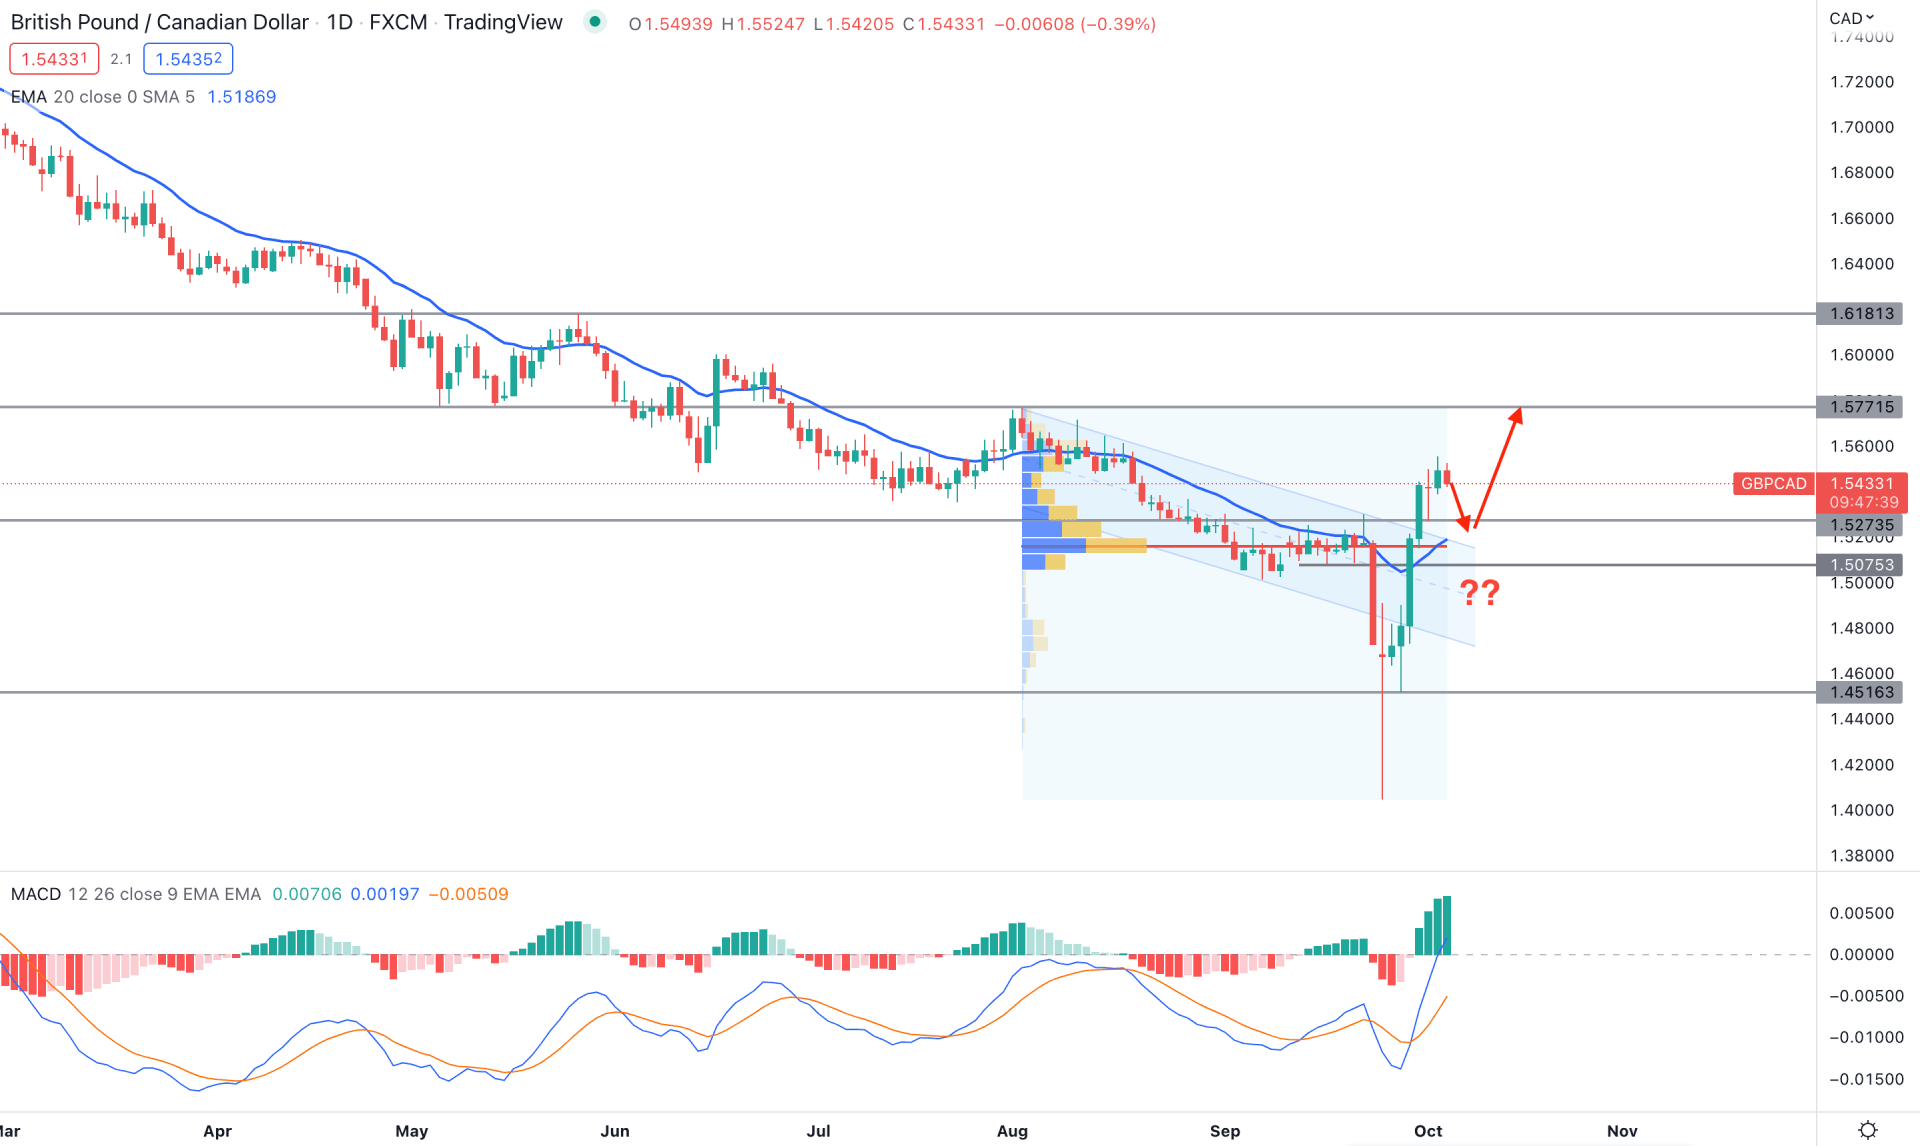
In the daily chart, GBPCAD showed a massive bullish exhaustion candle at the multi-year low with more than 600 pips movement in a day. Moreover, the buying pressure extended the next day and formed a fresh swing high followed by a descending channel breakout.
Based on the fixed range high volume indicator, the highest trading volume from August high to September low was changed to 1.5160 level. It is a sign that the most recent buying pressure is backed by a strong investors interest, which could extend the buying pressure in the coming days.
The massive buying pressure made a descending channel breakout in the daily chart, while the dynamic 20 EMA shifted its position from resistance to support. The indicator window also shows a buy signal, where the MACD Histogram is above the neutral line while the MACD line aims higher with a bullish crossover.
Based on the GBPCAD daily price prediction, the buying pressure is more likely to extend towards the 1.5771 resistance level. In that case, a minor bearish correction and bullish recovery would be a solid buying point.
On the other hand, bears should wait for the price to break below the 1.5075 level, which may extend the bearish momentum towards the 1.4600 area.
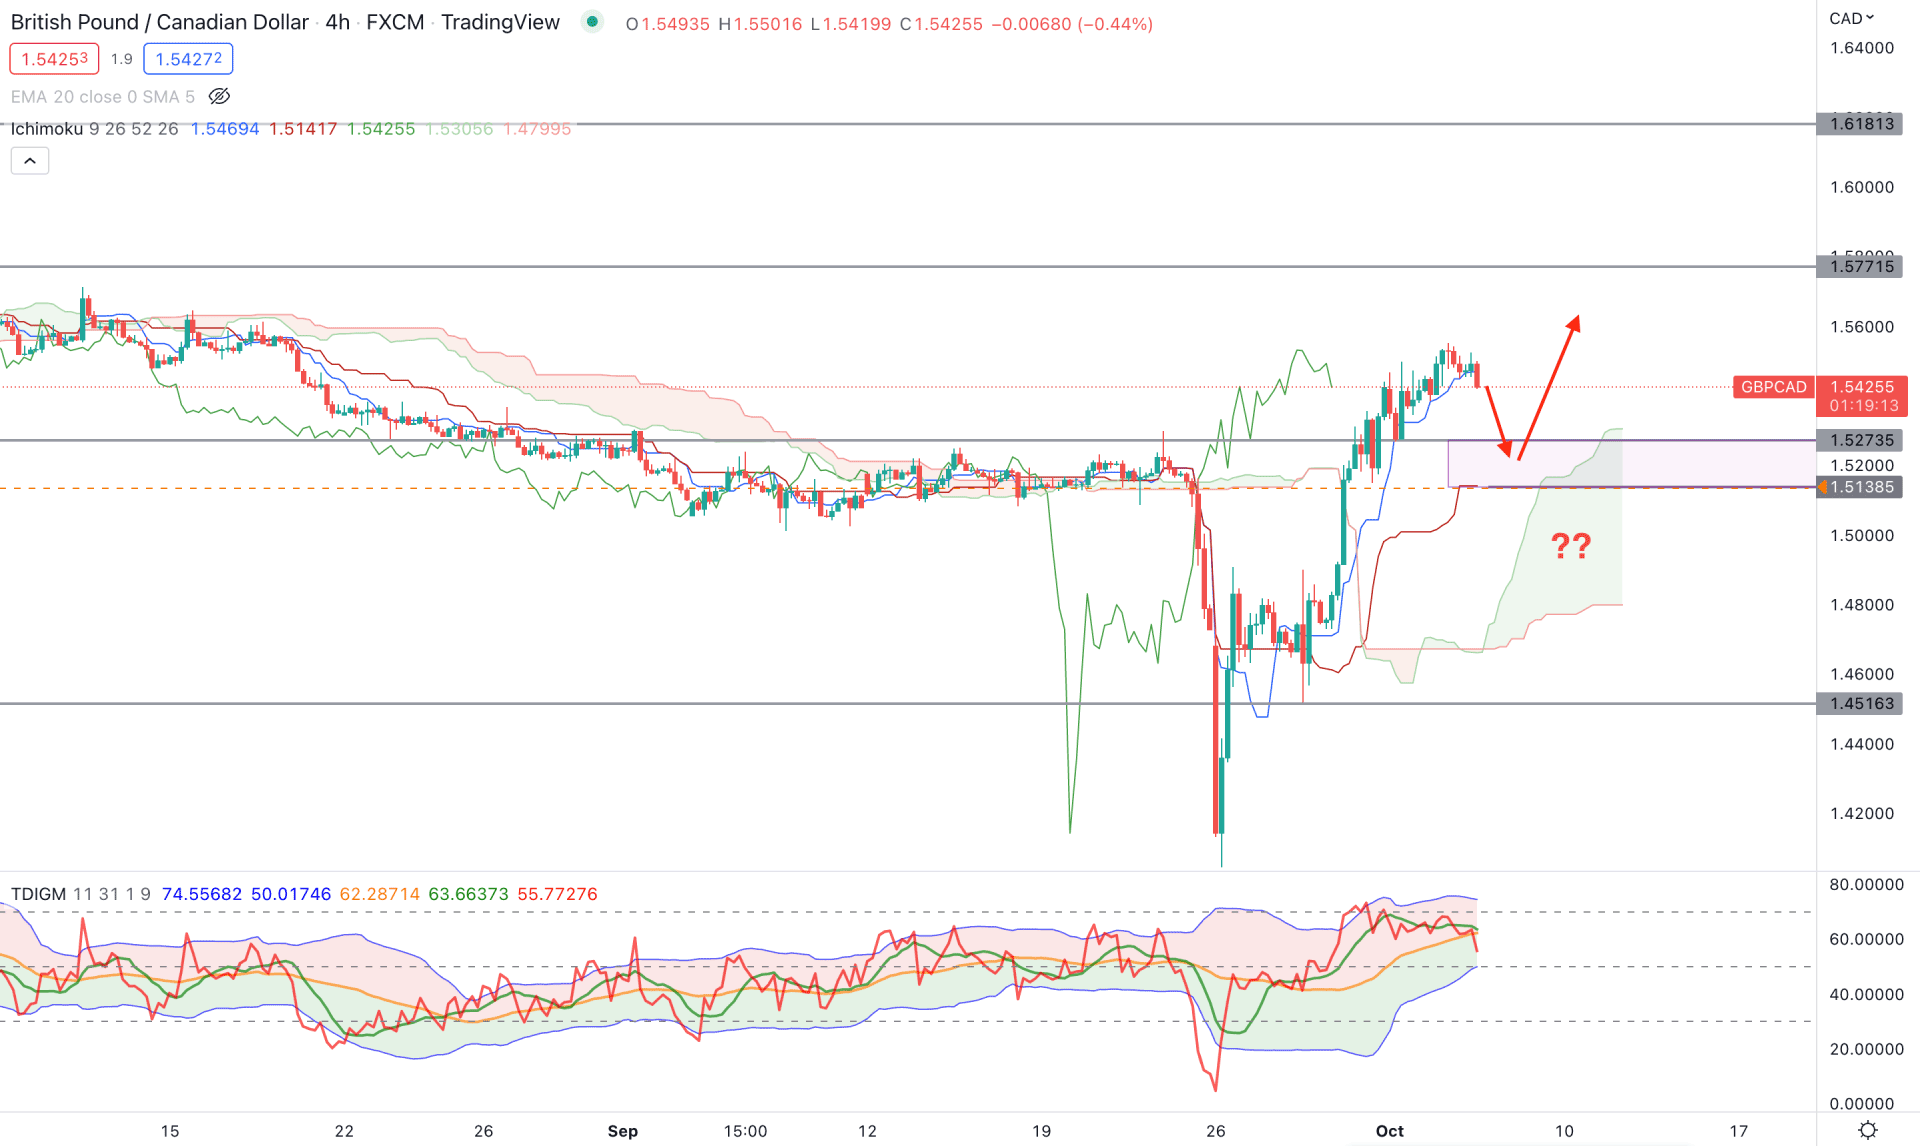
The H4 chart shows the same story as the current price has been holding ground above the Kumo Cloud for a considerable time. However, the massive bullish counter-impulsive movement needs some correction due to profit taking moving further up.
In the future cloud, the gap between the Senkou Span A and B is wide, which is a sign of a strong buyers presence in the market. In that case, the bullish pressure is more likely to extend as long as it remains above the Senkou Span B level.
In the indicator window, the possibility of a bearish correction is present from the Traders Dynamic Index indicator, where the current TDI level moved below the 50% area after a corrective pressure. Moreover, the price came below the dynamic Tenkan Sen line while the Kijun Sen was still on the ground.
Based on the GBPCAD H4 price momentum, a minor bearish correction is pending, where any bullish recovery from 1.5280 to 1.5130 area would be a bullish signal toward the target of the 1.5771 resistance level.
The alternative trading approach is to find the price 1.5000 key level before aiming down towards the 1.4516 level.
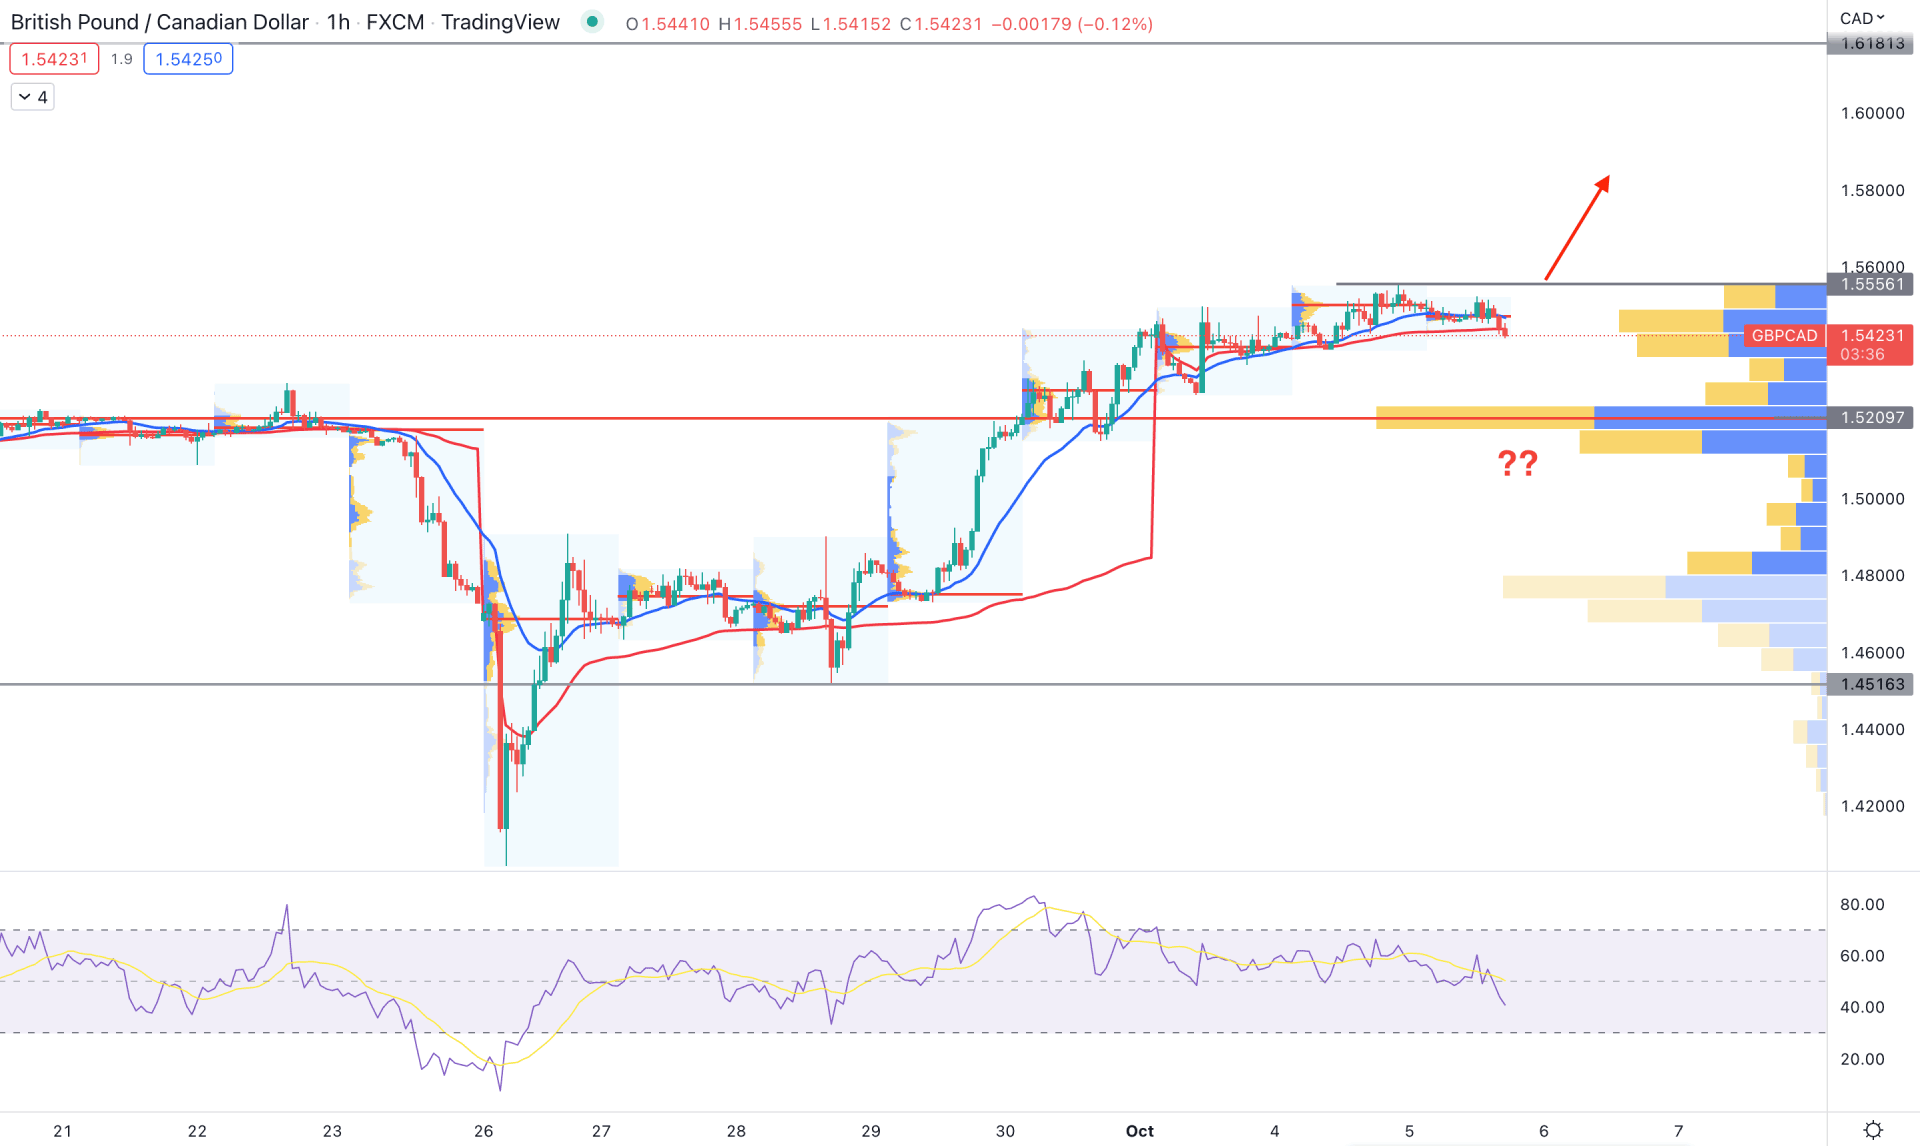
The H1 price of GBPCAD is extremely corrective where the recent candles are moving nowhere in a range. However, the bullish pressure is backed by the strong visible range high volume level at 1.4770 level. Therefore, until the price comes below the 1.4770 level, the buying pressure is more likely to extend.
The dynamic 20 EMA and weekly VWAP are above the current price, working as an immediate resistance, while the intraday high volume levels failed to make a significantly higher high in the H1 timeframe.
Based on the H1 price action, the bullish possibility is valid if the H1 candle closes above the 1.5556 swing high. In that case, the bullish momentum may extend towards the 1.6181 resistance level.
On the other hand, breaking below the 1.5200 level with a bearish H1 candle would eliminate the bullish structure, which could extend the loss towards the 1.4600 area.
Based on the current multi-timeframe analysis, GBPCAD is more likely to extend the bullish momentum, where a minor recovery and bullish rejection would be the trigger point. However, investors should closely monitor near-term swing lows as breaking these levels could hint at a trend reversal.


