
Published: July 11th, 2024
The Pound Sterling outperformed its major peers due to BoE policy makers' continued hawkish posture and faster-than-expected economic growth in May. In May, the Office for National Statistics (ONS) of the United Kingdom reported a robust economic expansion of 0.4%, surpassing the 0.2% forecast and the stagnant performance of April.
The ONS also disclosed that monthly industrial and manufacturing production increased according to expectations following a contraction in April. They increased by 0.2% and 0.4%, respectively, suggesting a robust recovery in the demand for factory products.
In the interim, the Bank of England's policy makers refuted the notion of rate cuts in August. On Wednesday, Catherine Mann, a policymaker at the Bank of England, issued a warning that the 2% annual headline inflation target was dubious.
In contrast, the Canadian Dollar was under pressure due to increasing rumors that the Bank of Canada (BoC) would implement additional rate cuts. The BoC's expectations for further rate reduction have been elevated due to deteriorating labor market conditions in Canada.
The stronger Pound against the Canadian Dollar might create a recent trend in the GBPCAD pair, creating a trend trading opportunity. Let's see the further outlook from the GBPCAD technical analysis:
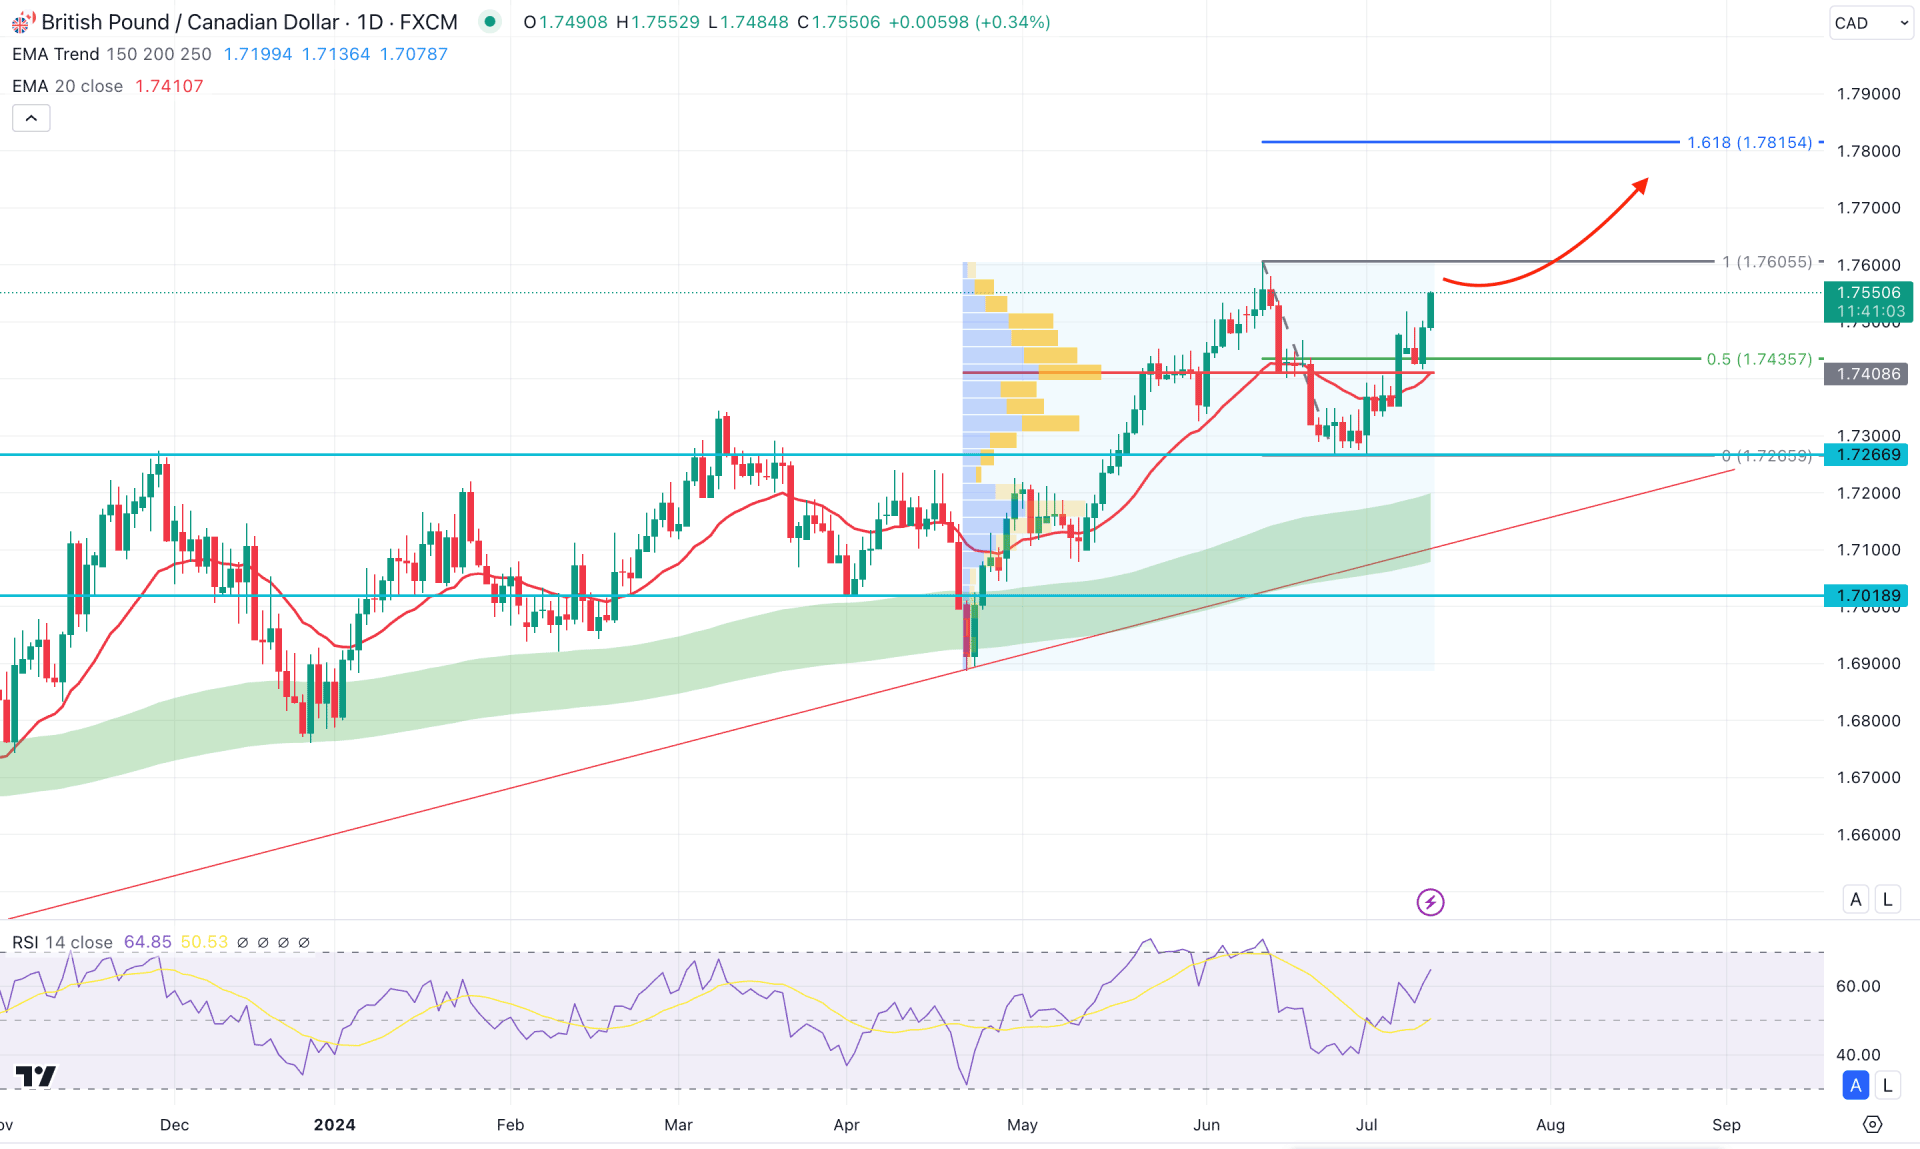
In the daily chart of GBPCAD, the broader market trend is bullish as consecutive higher highs are visible from left to right. In this context, the primary aim of this instrument is to look for long trades until a massive selling pressure appears.
In the volume structure, the buying pressure is visible as the largest activity level since August 2023 is at 1.7408 level. Moreover, the Moving Average wave consists of MA 150 to 250, which is below the current price with a bullish traction. It is a sign that the major market trend is bullish, which might result in a trend continuation.
In the near-term price action, the recent price moved above the dynamic 20 day Exponential Moving Average, which suggests short term buyers presence in the market.
In the indicator window, the Relative Strength Index (RSI) suggests a buying pressure as the current level hooves above the 50.00 line.
Based on the daily market outlook of GBPCAD, the ongoing buying pressure is more likely to extend and reach the 1.7815 Fibonacci Extension level. Moreover, a stable market momentum above the 1.7600 high could increase the possibility of moving beyond the 1.7950.00 level.
The alternative trading approach is to find a bearish reversal from the 1.7605 level, which could be the primary sign of a trend reversal. Moreover, a daily close below the 1.7408 support level could activate the bearish signal, aiming for the 1.7018 level.
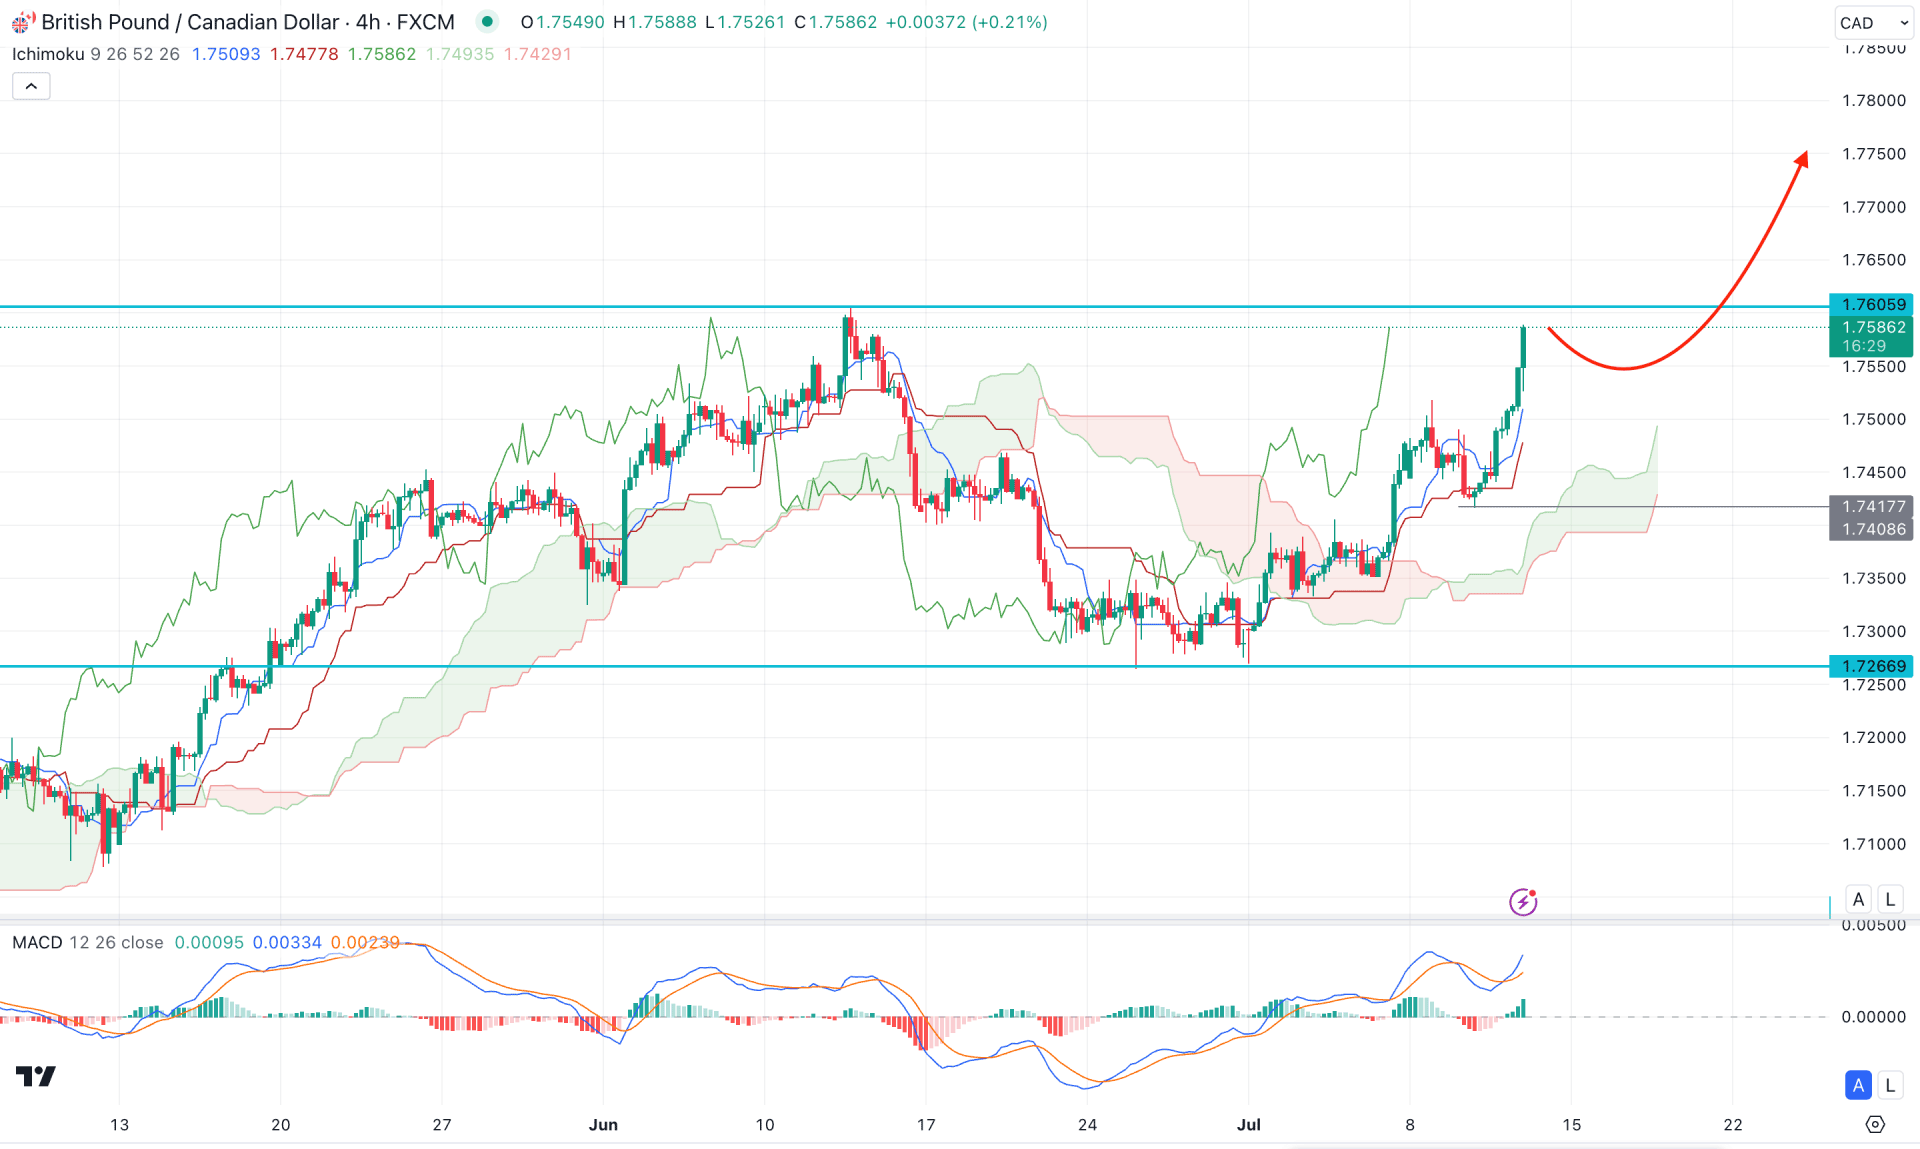
In the H4 timeframe, the ongoing buying pressure is visible as the recent price remains stable above the Ichimoku Kumo zone. Moreover, the future cloud remains optimistic about bulls as both Senkou lines aim higher.
In the indicator window, the MACD Histogram remains bullish, while the Signal line forms a bullish crossover. It is a sign that medium-term and short-term bulls are active in the market.
Based on the H4 outlook, GBPCAD buying pressure might be validated after making a new high above the 1.7605 level. Later on, considerable downside pressure might come, where the main aim would be to find support at the dynamic Kijun Sen level. In that case, the bullish reversal from the 1.7500 to 1.7408 zone could be a bullish zone, depending on the price action.
The alternative scenario is to find a massive buy-side liquidity sweep from the 1.7600 level with a bearish H4 candle below the Ichimoku Cloud low could lower the price towards the 1.7100 low.
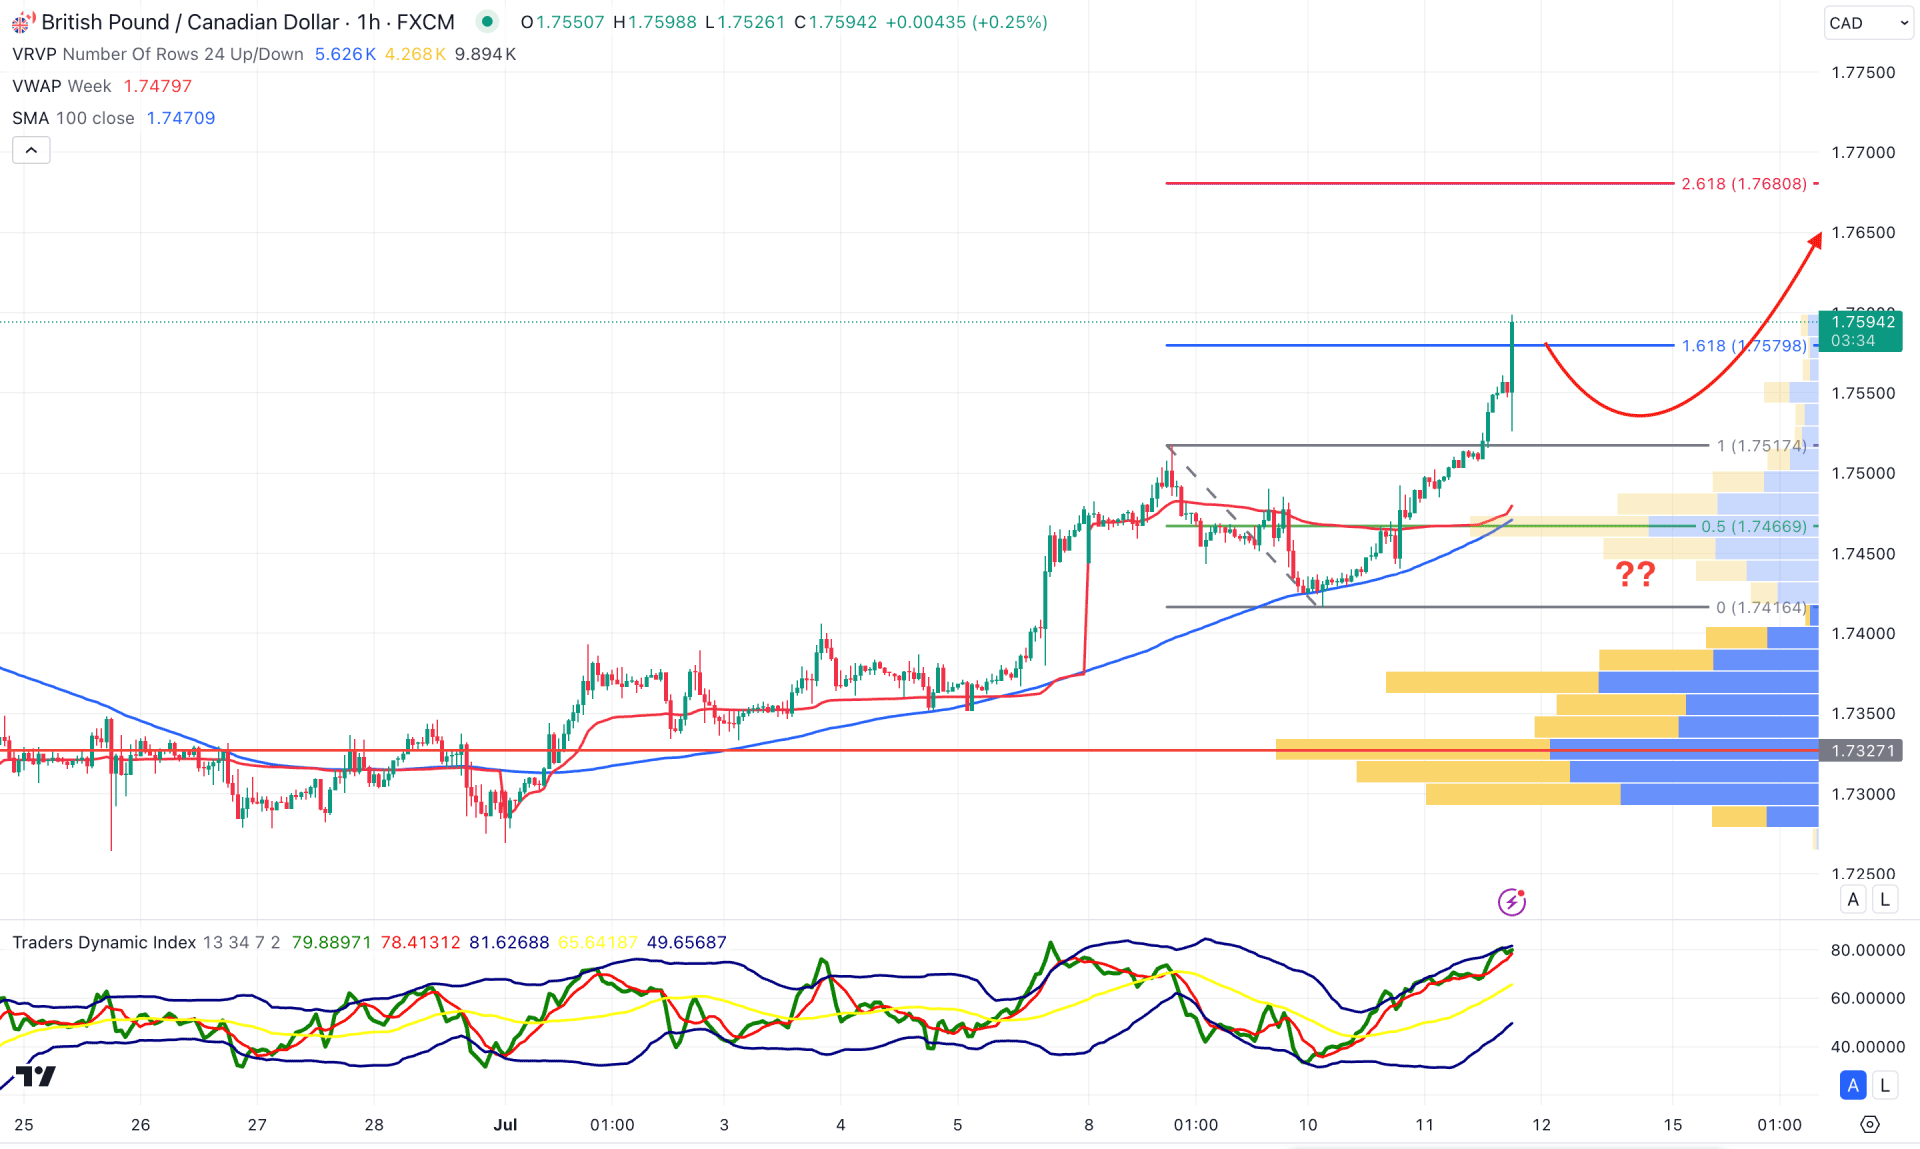
In the H1 chart, the ongoing buying pressure is strong, where the most recent price is overextended from the dynamic 100 SMA line. In that case, the primary aim for this pair is to find a bullish continuation once the downward correction is completed as a mean reversion.
In the indicator window, the Traders Dynamic Index (TDI) shows ongoing buying pressure as the recent level reached the highest level in a month. In that case, the buying possibility is potent as long as the current price hovers above the 50.00 TDI line.
Based on the H1 market outlook, the current price has already reached the 161.8% Fibonacci Extension level, from where a downward correction is pending as a mean reversion. In that case, any immediate bearish pressure with an hourly candle below the 1.7617 level might lower the price toward the 1.7414 support level.
Based on the current market structure, GBPCAD is more likely to extend the buying pressure, which might create a long opportunity once the intraday price reaches a reliable bottom. In that case, investors should closely monitor the hourly price from where a buying pressure is pending once the mean reversion is over.


