
Published: October 2nd, 2025
The pound sterling is marginally up versus its main competitors. However, as Bank of England administrators have begun to voice concerns about declining United Kingdom financial prospects, the prognosis for the British pound has become murky.
One of the key reasons authorities have been compelled to retain a "gradual and careful" easing of the economy forecast is that restrictive financial parameters might push inflation under their 2% target, as Sarah Breeden, the BoE Deputy Governor, cautioned on Tuesday. Inflation might fall below the target if policy is held too tight for an extended period of time, according to Breeden.
Moreover, Canada's industrial sector continued to be a burden on the Loonie. The S&P Global Manufacturing PMI contracted for the eighth consecutive month, down from 48.3 in August to 47.7 in September. Faster drops in production and new orders, muted business confidence, and continuous cost pressures from tariffs were emphasized in the report. Businesses were also continuing to reduce their workforces and inventory.
West Texas Intermediate (WTI) crude dropped to about $61.50 per barrel, its lowest since September 5, following the United States Energy Information Administration's (EIA) disclosure of a 1.79-million-barrel accumulation in crude stockpiles. This was in addition to the 0.61-million-barrel drop in the previous week and the expectation of a slight draw of 0.05 million barrels.
Let's see the further aspect of this pair from the GBPCAD technical analysis:
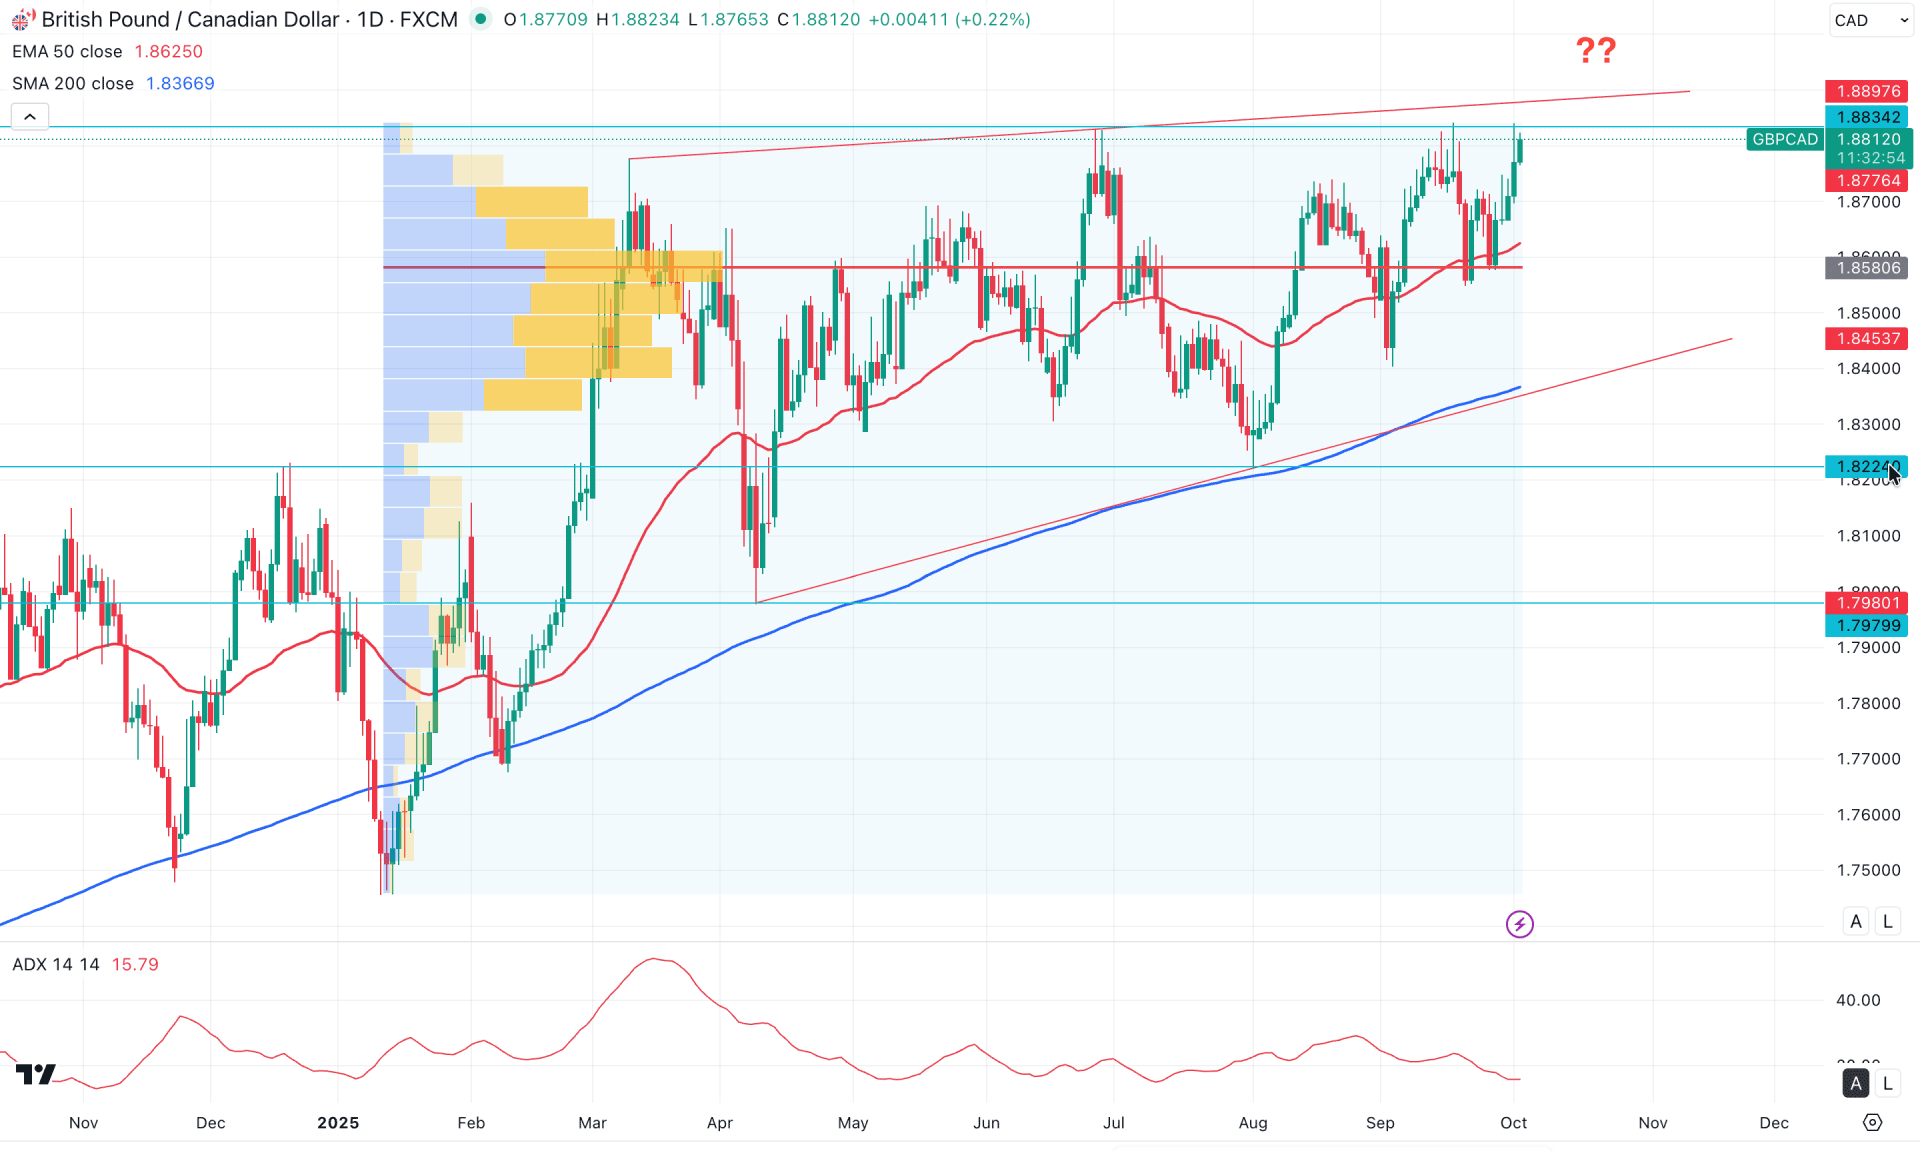
In the daily chart of GBPCAD, a bullish continuation momentum is visible as the current price is trading at a multi-year high. Although no significant bearish momentum is observed in the premium zone, investors should remain cautious before opening any long positions.
In the higher timeframe, the bullish continuation pattern remains solid. The monthly candle shows three consecutive bullish candles, suggesting a Three White Soldiers pattern. Although the current price is facing critical resistance near the existing monthly high, a bullish continuation is still possible based on this crucial price structure. The weekly chart also indicates another bullish continuation opportunity, as no sufficient selling pressure is evident, despite the price testing the resistance level.
In terms of volume, the bullish momentum appears valid since the largest activity level since January 2025 lies just below the current price and acts as immediate support. As long as this high-volume level remains below the current price, we can expect the buying pressure to continue.
From a trend perspective, the major market bias is bullish, as confirmed by the 200-day Simple Moving Average (SMA). In the chart, we can see the 200-day SMA showing a bullish slope below the trendline resistance and acting as a strong barrier to sellers. Moreover, the 50-day Exponential Moving Average (EMA) is closer to the current price and serves as immediate support, aligning with the high-volume level.
However, the indicator window tells a slightly different story, suggesting that the strength of the trend may be weakening. Based on the Average Directional Index (ADX) reading, the current line is positioned below the 20.00 threshold, indicating corrective market pressure. In this case, before confirming a stable trend, investors should wait for the ADX to rise above 20.00. Meanwhile, the Relative Strength Index (RSI) is following the trend, currently showing a bullish slope above the 50.00 neutral line. This implies that RSI could reach the 70.00 overbought level and beyond, signaling potential bullish continuation.
Overall, the GBPCAD daily chart shows strong bullish momentum, even though the price is trading within a rising wedge pattern. While the broader trend remains bullish, a minor bearish correction could occur, with immediate support located near the 1.8580 level. As long as the price holds above this crucial support, buying pressure is expected to extend.
On the other hand, an extended selling pressure below the 200-day SMA could invalidate the rising wedge breakout, opening the door for a potential decline toward the 1.7600 key support level.
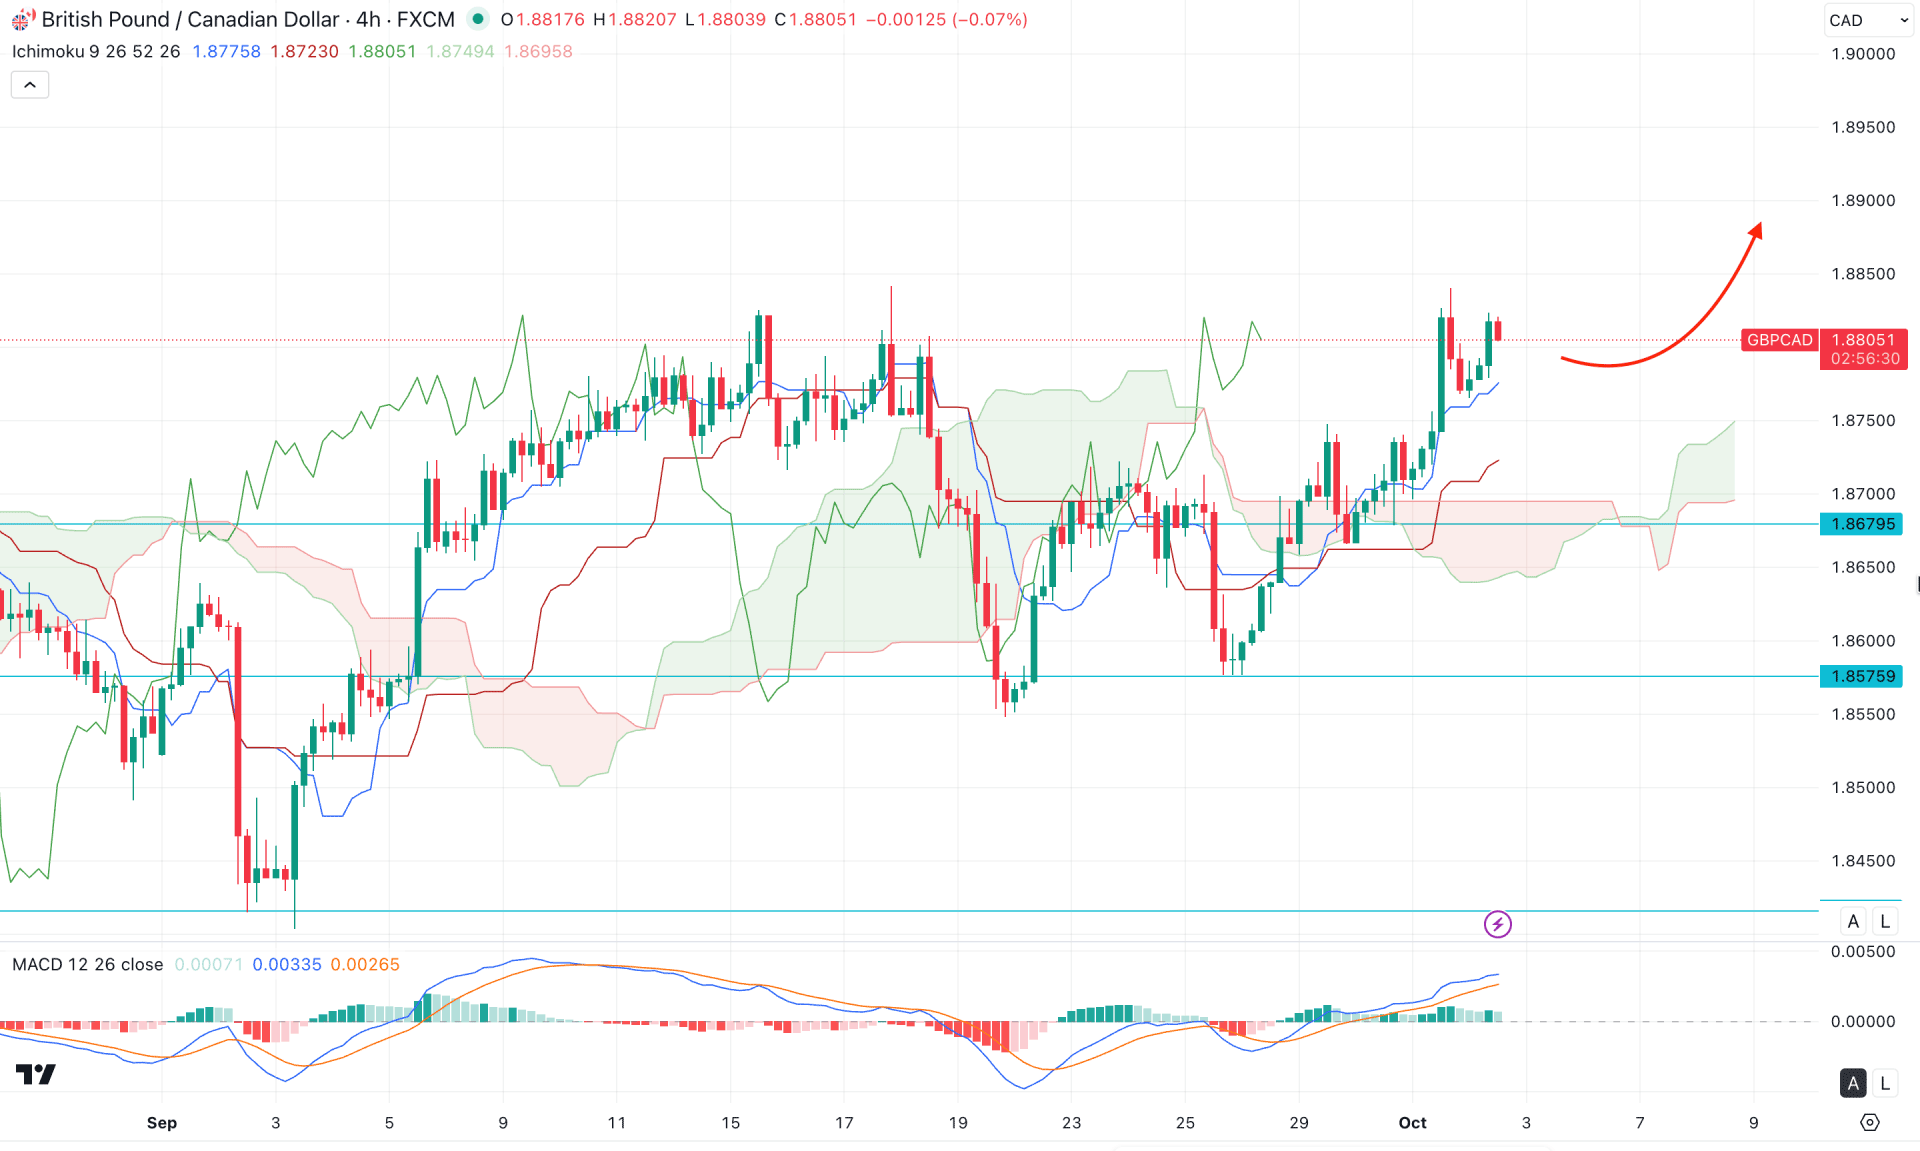
In the four-hour timeframe, a bullish breakout is visible above the Kumo Cloud area, as the most recent price is trading with a bullish continuation opportunity. Moreover, the future cloud looks positive, with both Senkou lines aiming higher, which is a strong signal of bullish momentum.
In the secondary indicator window, the MACD histogram is maintaining its positive momentum, while the signal line continues to hold buying pressure above the neutral zone. Therefore, the bullish continuation remains valid unless a strong bearish crossover appears on the MACD signal line.
Based on this outlook, the primary bias for this pair remains bullish, as long as the dynamic Kijun-sen stays below the current price and acts as a major support. In this case, the price is likely to form a new swing high, potentially moving beyond the 1.8900 psychological level.
Alternatively, traders may look for a short-term bearish opportunity if the price falls below the 1.8679 level. However, a bearish trend continuation would require the price to establish stable movement below the Kumo Cloud. On the downside, immediate support is located near the 1.8575 level, followed by a deeper support zone around 1.8400.
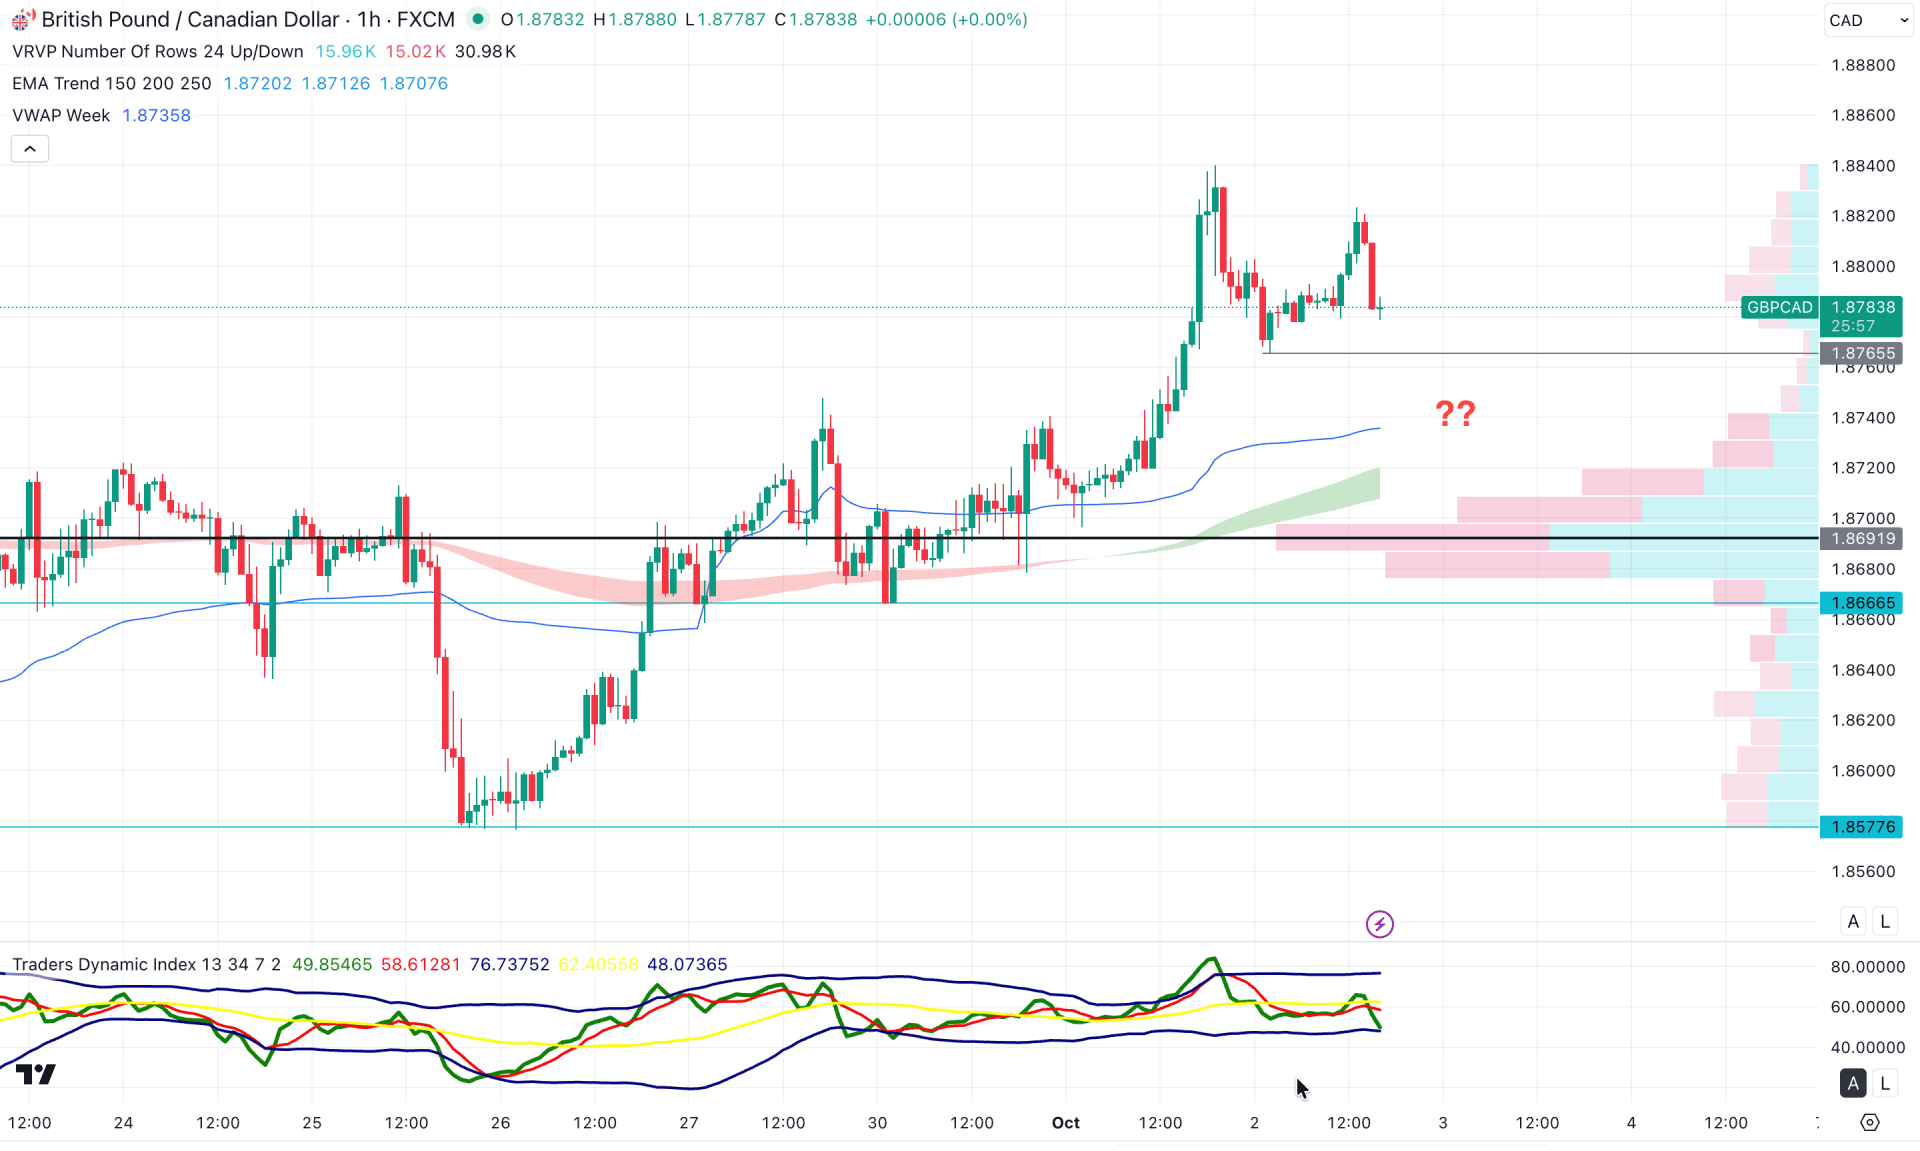
In the early timeframe, the recent price is holding near the session high, while the dynamic lines are positioned below the current price, supporting the bullish bias. The weekly VWAP level is also trending bullish, positioned below the 1.8765 support level, followed by a bullish EMA wave and a high-volume line. As long as these lines remain below the current price, we may anticipate a bullish continuation in the main chart.
In the indicator window, the Traders Dynamic Index (TDI) shows selling pressure as the current TDI line has reached its lowest point, signaling a short-term correction.
Based on this outlook, a minor downside correction is likely, with the 1.8765 level acting as a crucial support zone to watch. A break below this level could find additional support from the exponential moving average wave near the 1.8720 level. However, if extended bearish pressure pushes the price below the 1.8691 high-volume line, it could drive the pair toward the 1.8620 area.
Based on the overall market structure, GBPCAD remains bullish, trading within a sideways momentum near its yearly high. In this case, entering long positions from the premium zone requires extra caution, with a focus on lower target levels for safer risk management.
As the price continues to hover within a crucial consolidation pattern, no significant selling pressure is expected until a clear exhaustion signal appears at the top.


