
Published: February 17th, 2022
The global oil market remained worried due to the potential disruption of supply-demand, as the Australian ANZ Bank said. Moreover, the recent uncertainty from Russia and Ukraine might affect the oil price, where the positive correlation between WTI Crude and CAD might shake the GBPCAD price.
According to the Russian media, the Ukrainian military was forced to fire mortars and grenades while the Russian Ministry of Defense noted that there were 10 military convoys to leave Crimea. Although the geopolitical uncertainty is not directly connected to the GBPCAD, a change in the oil price might increase the volatility in this pair.
The week begins with the high-impact news of GBP, where the CPI came with a 5.5% increase that might push BoE to raise the interest rate in March and May. The headline CPI indicated that the annual adjustment to the market weight is partly responsible for the higher reading. On the other hand, BoC Governor Macklem reiterated the current rate hike path but sounded a hawkish tone regarding the policy rate to remain at the neutral level of 2.25%.
In that case, the Sterling may grab a buying momentum from the CAD where investors should closely monitor how the price trades at the 1.7300 key level.
Let’s see the upcoming price direction from the GBPCAD technical analysis:
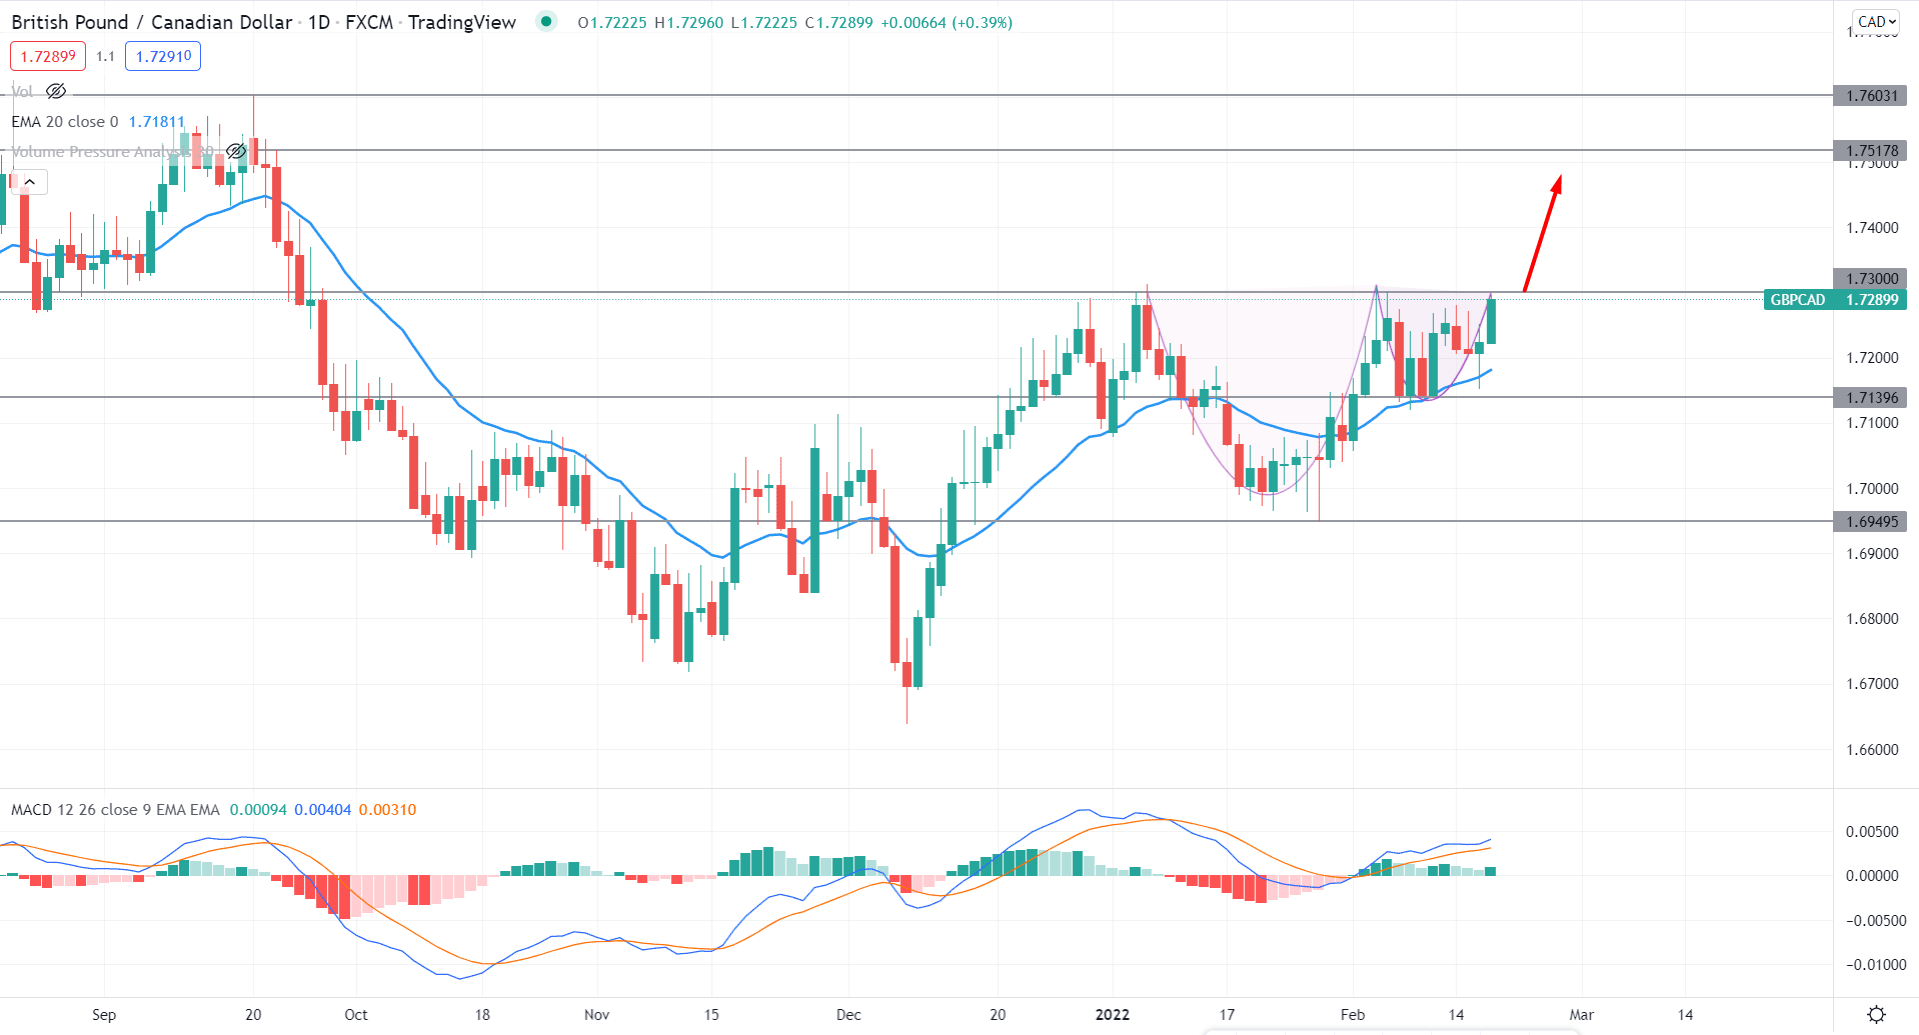
According to the daily chart of GBPCAD, the most recent price showed a pre-breakout structure by forming a cup and handle pattern at the 1.7300 area, where a bullish breakout might make the pattern complete. In that case, any buying opportunity from lower timeframe confirmation has a higher possibility of extending the buying pressure towards the 1.7517 area.
The above image shows how the daily candle closes above the dynamic 20 EMA with a bullish pressure while the MACD Histogram remained above the neutral level for a considerable time. In that case, further buying pressure from the dynamic support may influence bulls to join the buying momentum in the coming days.
Based on the current price structure, investors should find a bullish daily candle above the 1.7300 resistance level to consider the upcoming price pressure as bullish. In that case, the buying pressure towards the 1.7500 area is valid as long as the price trades above the dynamic 20 EMA in the daily chart.
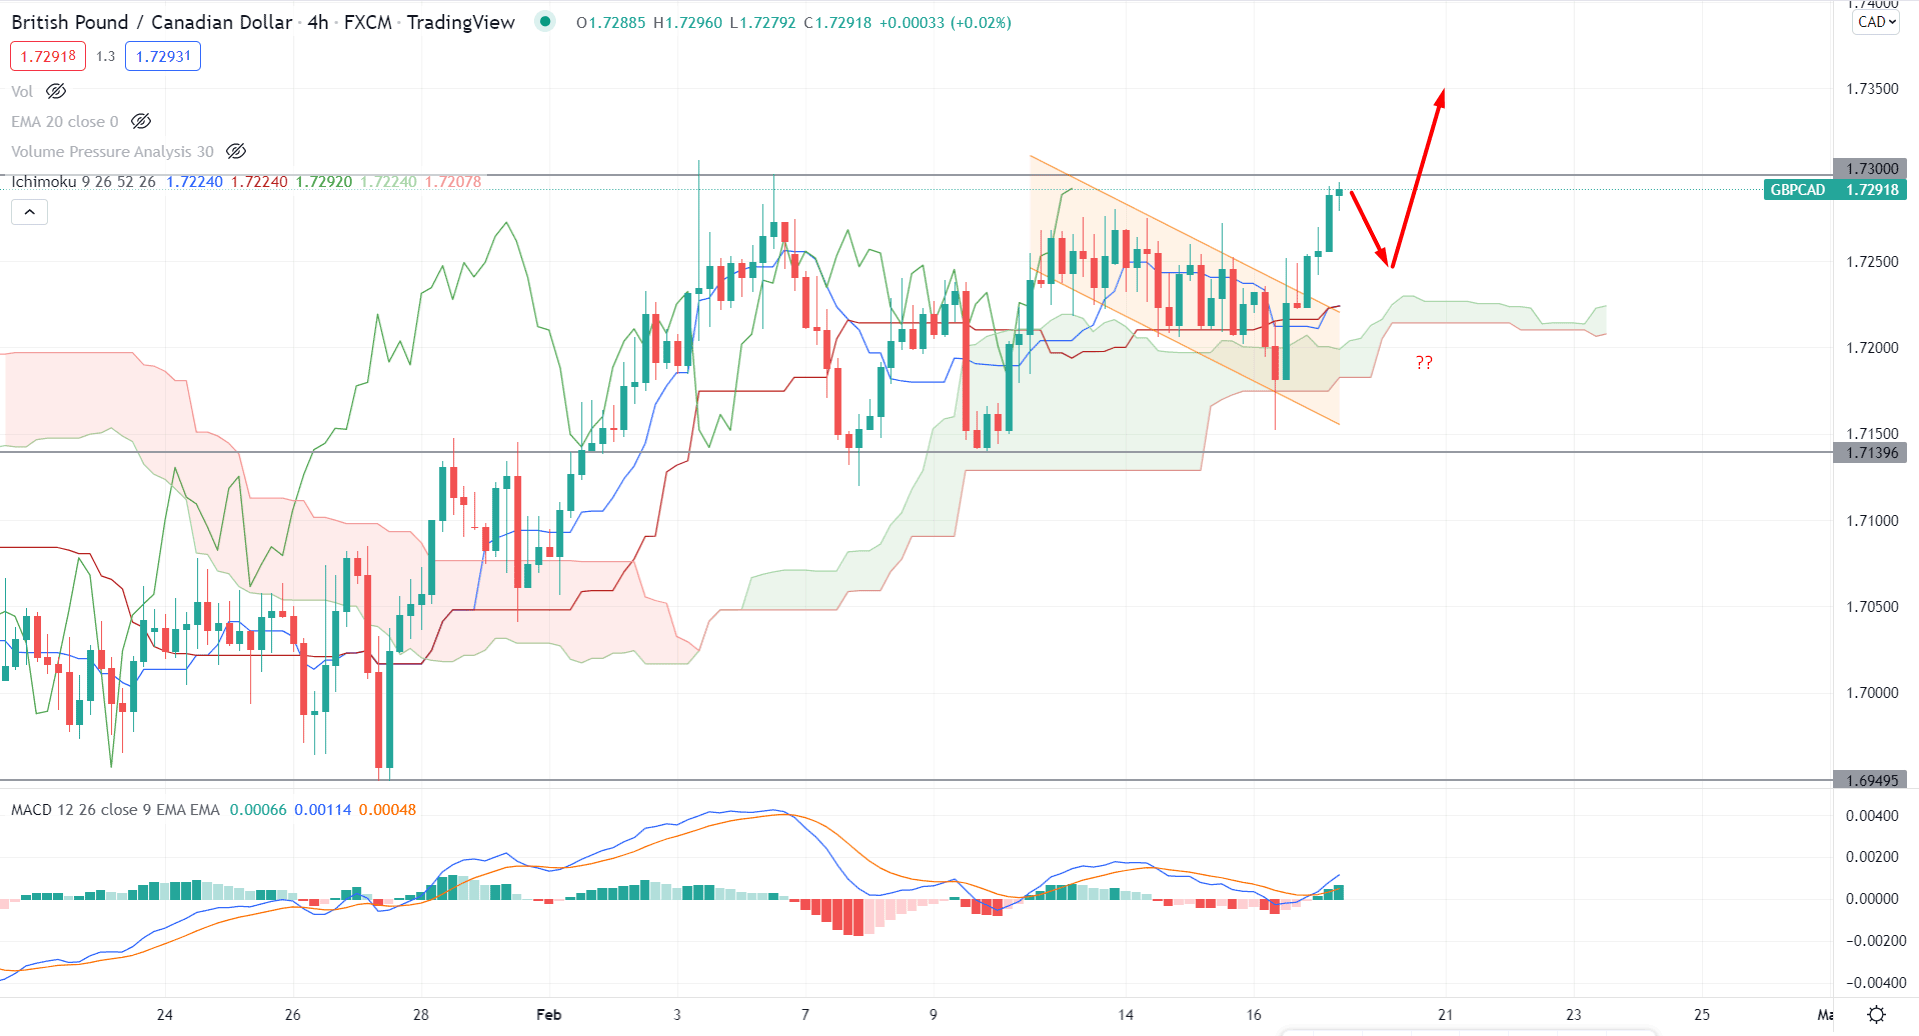
According to the Ichimoku Cloud, the GBPCAD price is trading with intense buying pressure as the recent price showed a bearish channel breakout. Meanwhile, the future cloud is bullish where Senkou Span A is above Senkou Span B and aimed higher. On the other hand, the Lagging Span is above the price with more room upside.
The above image shows how the MACD Histogram changed its direction from bearish to bullish while dynamic Tenkan Sen and Kijun Sen remained below the price. Moreover, if the Tenkan Sen shows a bullish crossover by moving above the Kijun Sen, we may expect the buying pressure to extend in the coming hours.
Based on the H4 context, a minor correction after the channel breakout is still pending where any bullish rejection from 1.7280 to 1.7230 would be a substantial buying opportunity in this pair towards the target of 1.7500 area. On the other hand, a break below the cloud support might alter the current market structure, whereas a break below the 1.7139 might open rooms for testing the 1.7000 area.
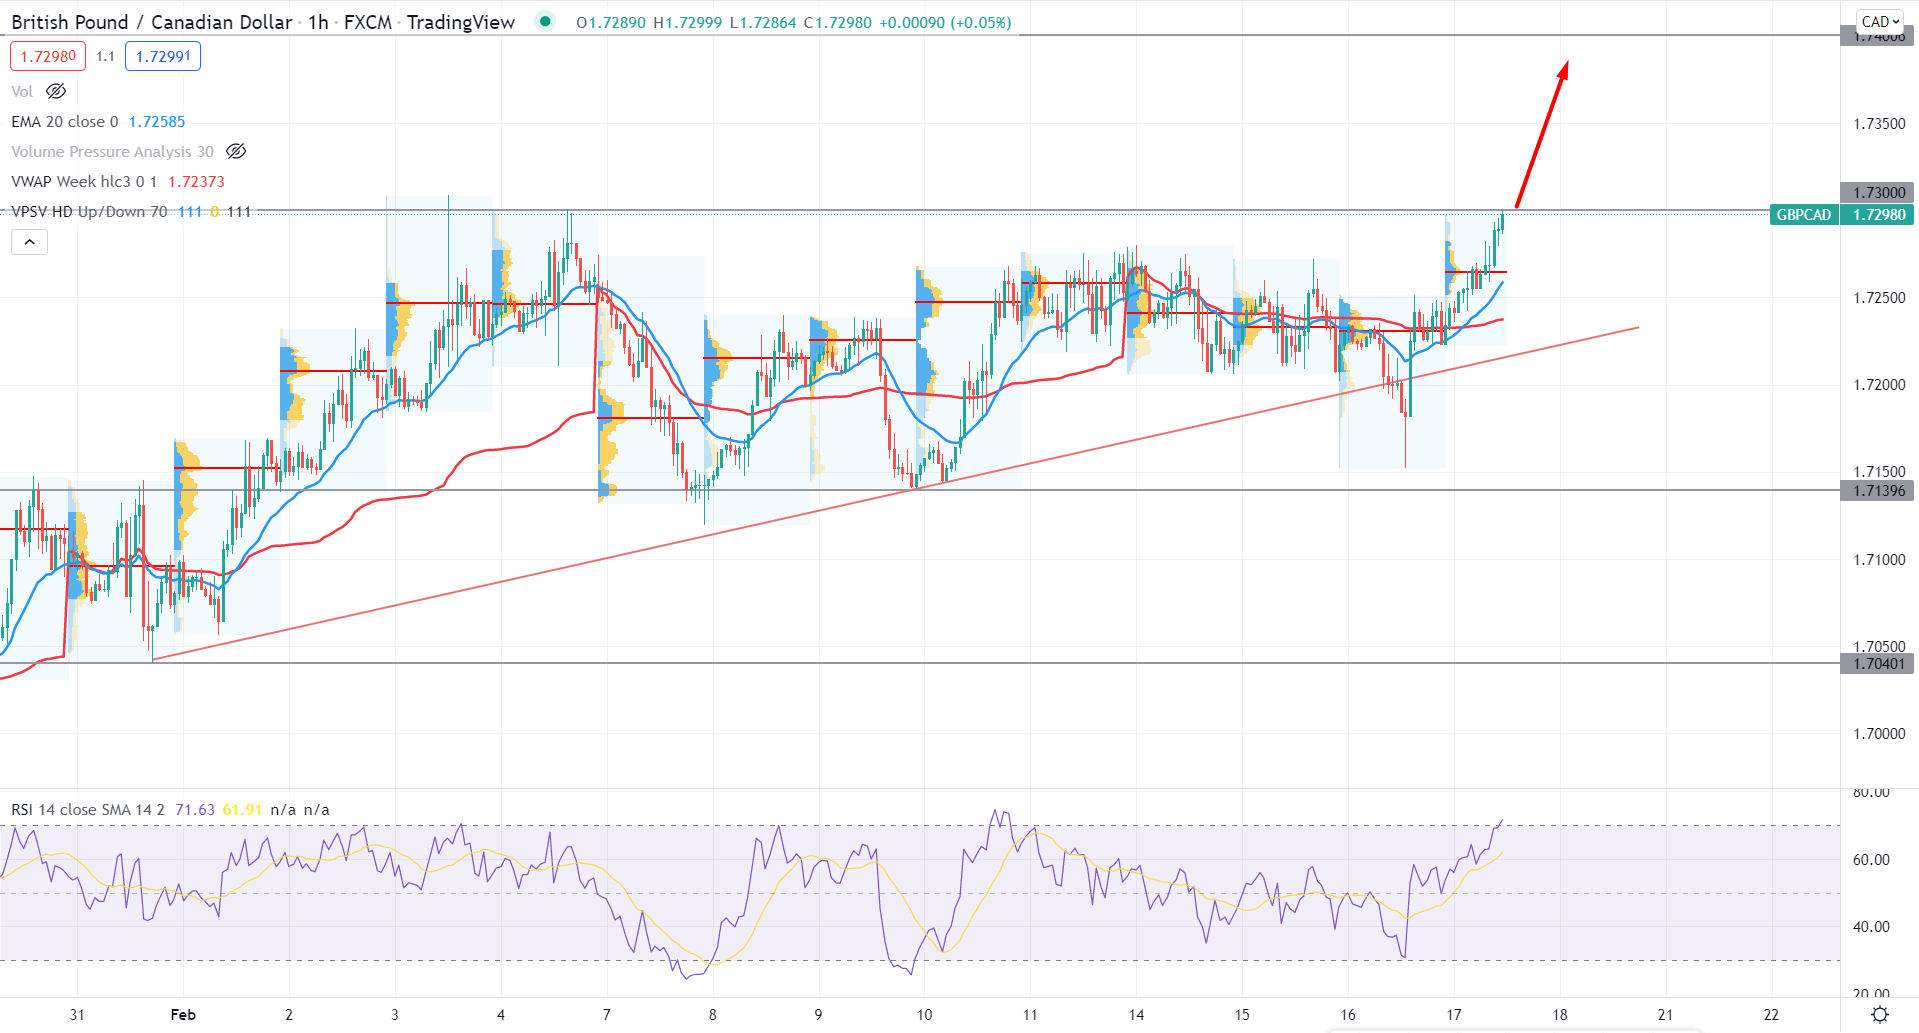
In the intraday chart, GBPCAD remained within a bullish trend while the buying pressure extended after grabbing the liquidity from the false trendline breakout. As a result, the price moved below the dynamic 20 EMA level but failed to make a new low below the 1.7140 swing level. Therefore, as they showed strong buyers' interest from the 1.7266 high volume intraday level, we may expect that the current buying pressure may extend in the coming days.
The above image shows how the price trades above the weekly VWAP while the RSI level reached the overbought 70 levels. Therefore, as the current price is still below the 1.7300 level, any bearish correction with a robust bullish rejection would be a buying opportunity in this pair towards the target of 1.7500 area.
As per the current market context, GBPCAD buying pressure is solid as the daily chart formed a cup and handle pattern while the intraday price remained bullish. In that case, any buying opportunity from the H4 chart would bring a profitable return from this currency pair.