
Published: June 25th, 2025
On Tuesday, the Canadian dollar (CAD) stumbled its short-term bullish pivot, climbing against the basket of currencies before reversing course and returning to familiar levels. Growing Israel-Iran tensions caused global crude oil prices to surge, and the Loonie gained strength. However, a shaky ceasefire has cut crude bids, yanking the rug from under CAD bulls.
In general, the Canadian Consumer Price Index (CPI) data on inflation were as anticipated. There was minimal to no price-moving impact because median market projections accurately predicted price growth. The debate over when the Bank of Canada (BoC) will start reducing rates is expected to continue as long as many Canadian inflation figures remain at or below the BoC's goals.
On the other hand, the Pound Sterling (GBP) could encounter difficulties due to dovish comments made by Bank of England (BoE) authorities regarding the policy outlook, which might limit the upward movement of the GBPCAD pair. Despite raising doubts about the accuracy of labor data, BoE Governor Andrew Bailey highlighted sluggish wage expansion and increased economic inactivity. Deputy Governor Dave Ramsden voted for a rate drop, citing labor market softening as the reason, but cautioned that it could cause inflation to go under the 2% target.
Meanwhile, the prolonged drop in crude oil prices may weaken the Loonie and limit the pair's fall. It's important to remember that Canada is the biggest supplier of oil to the US, and the value of the Canadian dollar typically suffers when crude oil prices decline.
Let's see the upcoming price direction from the GBPCAD technical analysis:
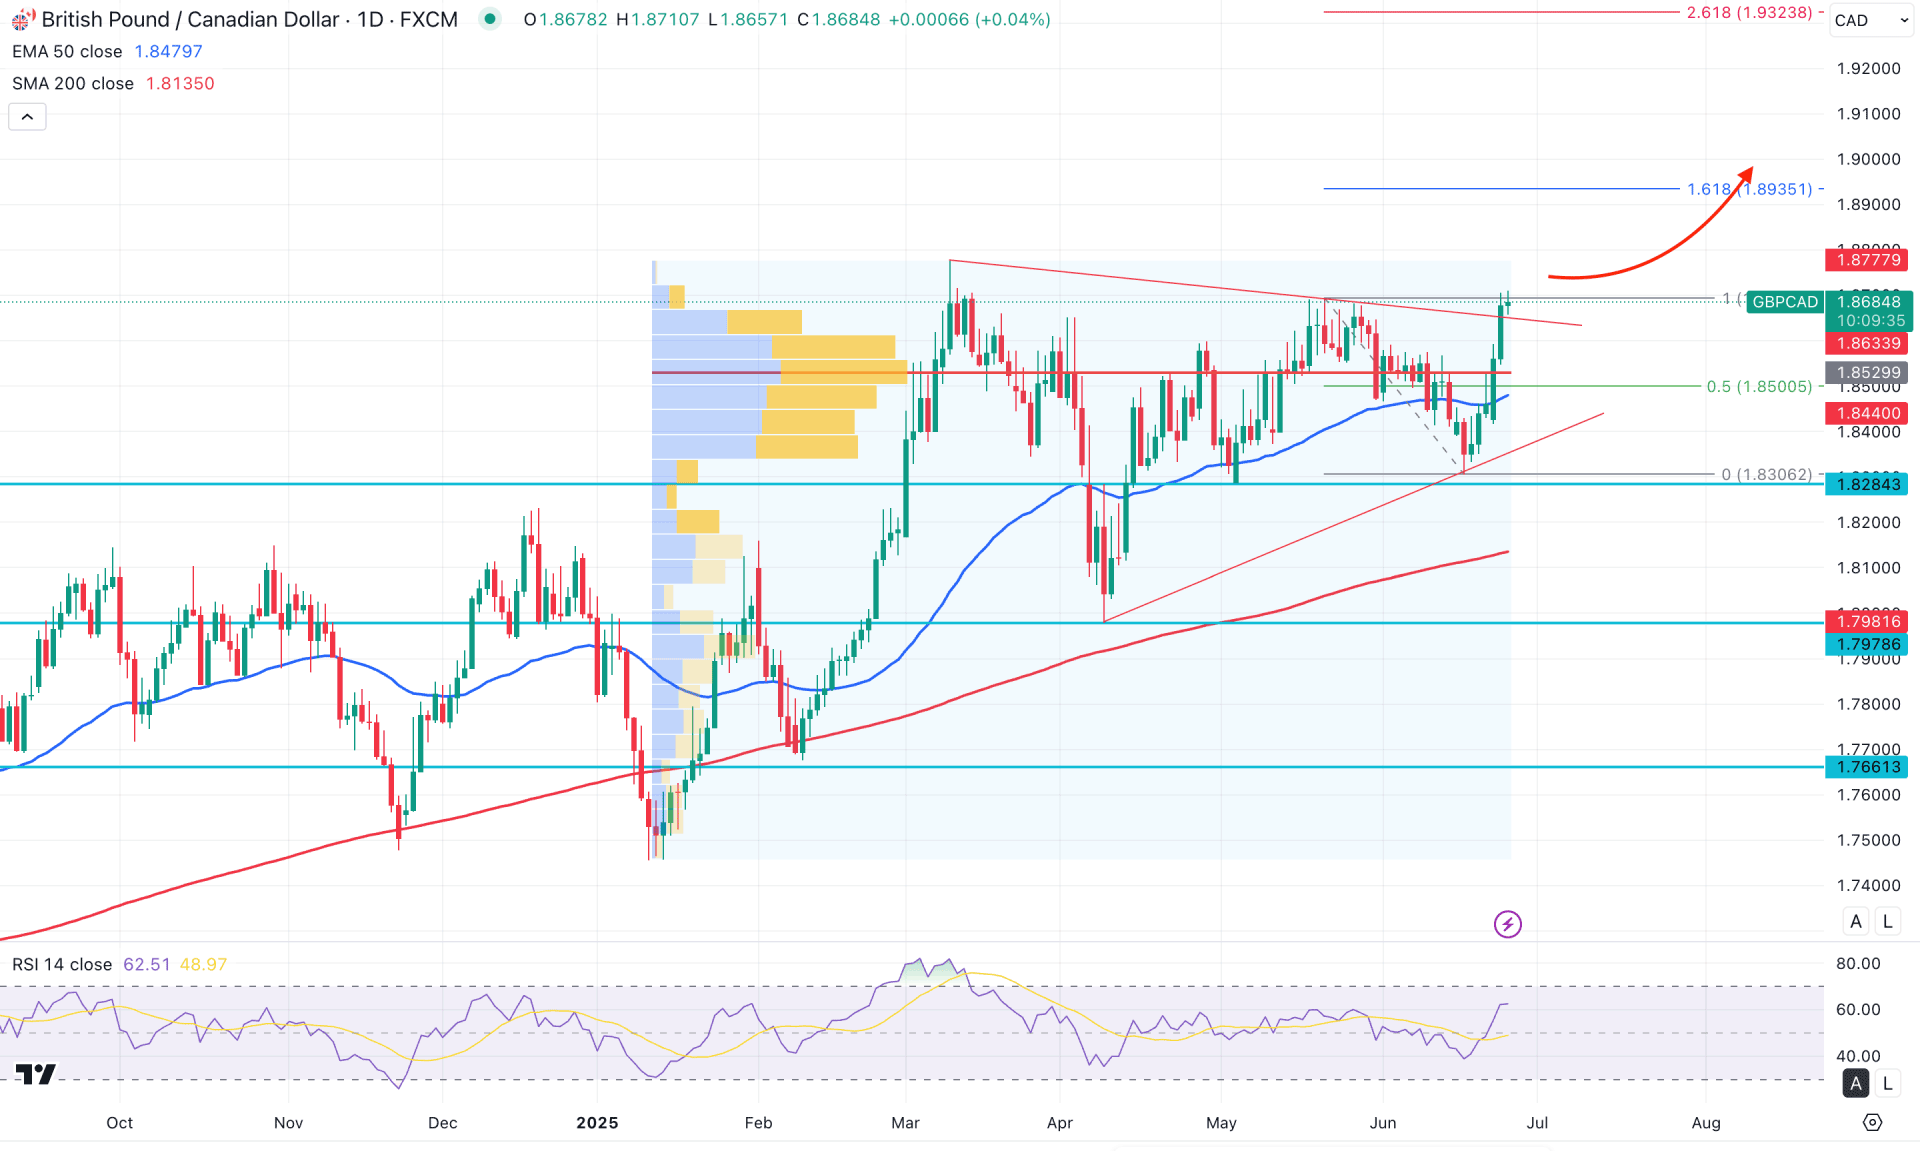
In the daily chart of GBPCAD, the existing market momentum is bullish as the price keeps moving higher from left to right. Moreover, the most recent price showed a decent bullish recovery from the triangle resistance, which could work as a confluence of buying pressure.
In the higher timeframe, the bullish possibility is valid as the ongoing buying pressure is upported by a bullish inside bar breakout. Moreover, the latest weekly candle soared and reached the 5 week high. In that case, investors should monitor how the price reacts on the 1.8695 resistance level as a bullish weekly candle above this line would be a remarkable achievement by bulls.
Looking at the volume outlook, the buying pressure is also valid as the highest activity level this year is spotted at the 1.8529 level, which is below the current price. As long as the bullish pressure is potent above the high volume line, investors might expect an upward continuation soon.
Looking at the main price chart, the dynamic 200-day Simple Moving Average is way below the current price, working as a major support. Moreover, a bullish rebound is visible from the 50-day Exponential Moving Average, which signals a minor upward recovery.
Primarily, a bullish reversal from the 50-day EMA, supported by the 200-day SMA, would be an upward continuation signal. Moreover, the Relative Strength Index (RSI) mainatined a stable position above the 50.00 neutral line, validating the buying pressure.
Based on the daily market outlook, the buying pressure is validated from the symmetrical triangle breakout, which might create a new swing high. However, a minor downside correction is pending as the gap between the current price and the 50-day EMA has expanded. In that case, a bullish price action from the 1.8529 to 1.8300 area could be another long opportunity, depending on the price action.
The alternative trading approach is to find an immediate bearish daily close below the 1.8500 level, which might extend the loss and find support at the 1.8284 level before moving below the 50-day SMA line.
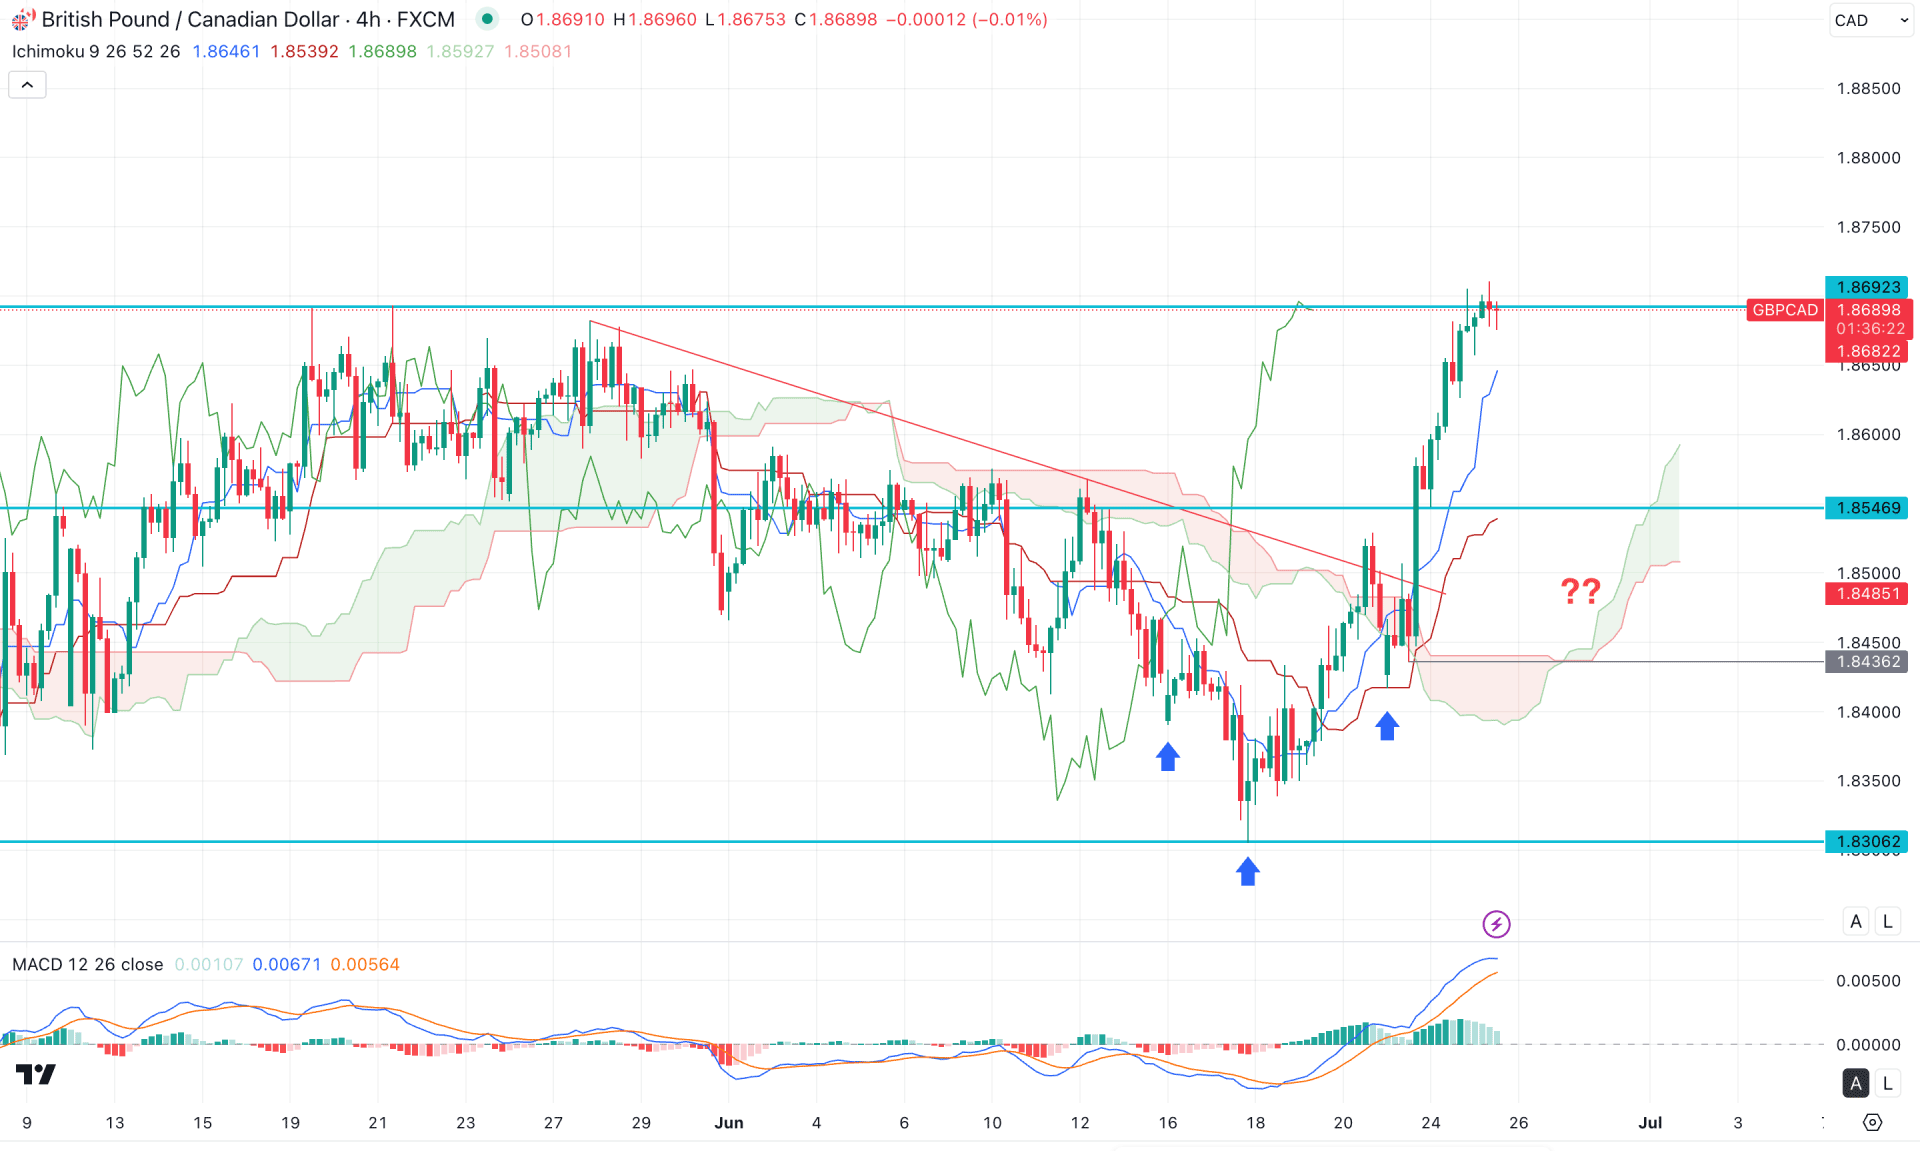
In the four-hour timeframe, the ongoing price action is bullish, as multiple candles are positioned above the Kumo cloud area. An inverse head-and-shoulders breakout further validates the upward continuation, although a retest of the neckline is still pending. The future cloud appears positive, with both Senkou Span lines sloping upward and showing strong thickness.
Despite the bullish outlook, the price still has room to move downward and complete a mean reversion toward the key support level. The DMACD signal line has already reached the upper band and turned flat, while the histogram has failed to maintain its position in the positive zone.
Based on the four-hour market outlook, a correction is pending. The main aim would be to test the 1.8546 level, as the bullish breakout remains valid. Any bullish rejection from the 1.8546–1.8436 zone would present a high-probability long opportunity.
However, a failure to hold above the Tenkan support level could lead to a short-term bearish opportunity. A confirmed bearish breakout with consolidation below 1.8450 might extend the loss and lead the price to find support near the 1.8306 level.
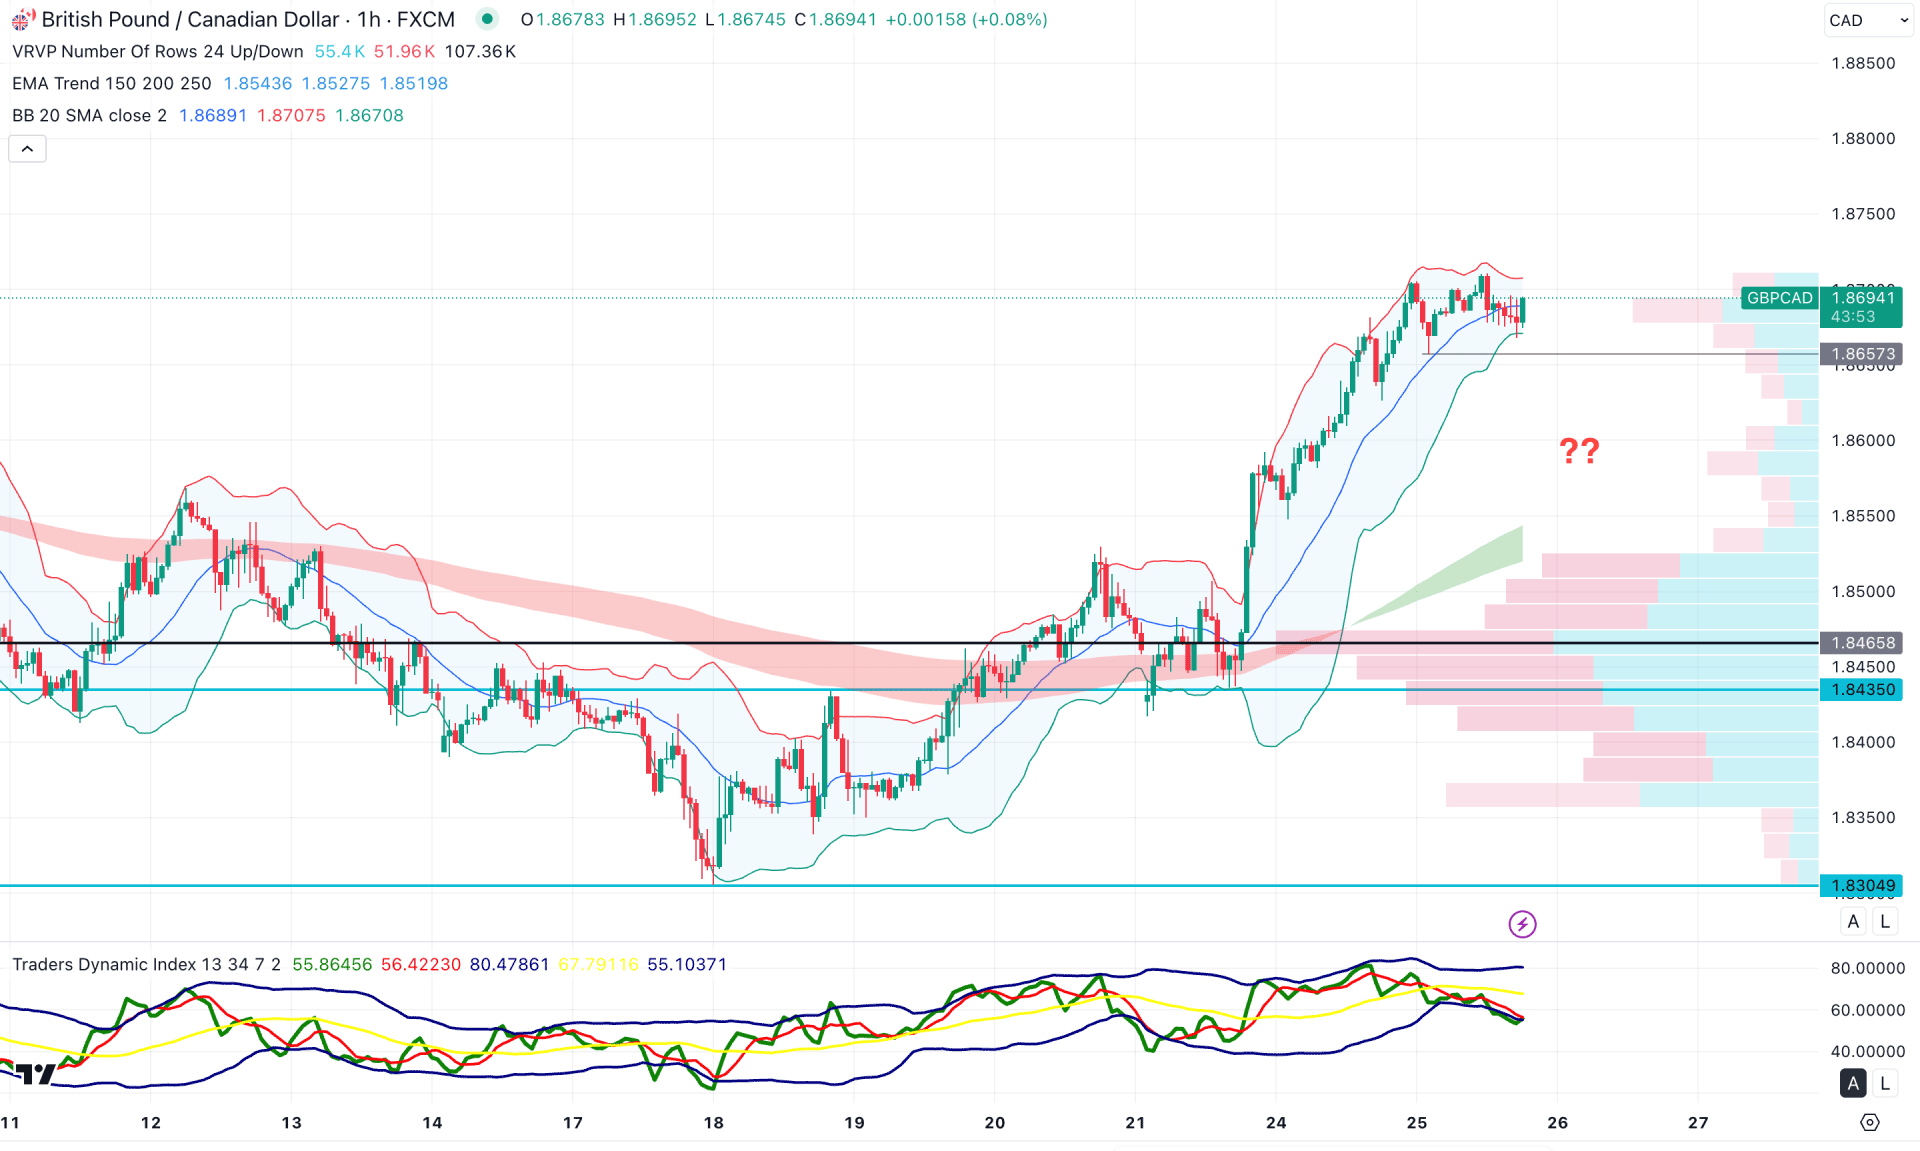
In the hourly timeframe, the ongoing buying pressure is valid as the price is trading higher above the mid Bollinger Bands level. Moreover, the visible range high volume line with MA wave is below the current price, working as confluence buying pressure.
On the other hand, the sideways market at the top with a Traders Dynamic Index (TDI) at the bottom signals more upward possibility.
In that case, investors should monitor how the price reacts at the lower Bollinger Bands level. A bearish hourly candle below the 1.8657 level could be a short-term bearish opportunity, aiming for the 1.8500 level.
The alternative trading approach is to wait for a bullish rebound with a bullish H1 candle above the mid Bollinger Bands level. In that case, the bullish signal might open aiming for the 1.8800 psychological level.
Based on the current market structure, the ongoing buying pressure is potent, which might offer a long-term investment opportunity. However, the intraday market is at the top, from where a sufficient downside correction is pending. Investors might keep a close eye on the H4 Kijun Sen level as it might work as a bullish rebound point.


