
Published: February 21st, 2024
The Pound Sterling (GBP) remained stable against the Canadian Dollar (CAD), hovering near a 50-day EMA. A slightly dovish remark from Bank of England (BoE) Governor Andrew Bailey and other policymakers addressing UK legislators at the parliamentary Treasury Select Committee.
Andrew Bailey recognized the rationality of market anticipations regarding interest rate cuts and emphasized "positive indications" of alleviating price pressures. Nevertheless, he abstained from elaborating on the timing and scope of the policy tightening.
Ben Broadbent, deputy governor of the Bank of England, signaled a change in the central bank's emphasis from the severity of restrictive monetary policy to its duration. In the interim, a policymaker at the Bank of England (BoE), Swati Dhingra, warned about the detrimental consequences that elevated interest rates could have on the economy of the United Kingdom.
On Tuesday, Canadian consumer inflation data that was weaker than expected weakened the commodity-linked Canadian Dollar (CAD) and strengthened the GBPCAD pair. The annual growth rate of the Canadian CPI decelerated to 2.9% in January, representing the lowest levels in more than two years.
Furthermore, concerns regarding Middle Eastern supply disruptions continue to exist in the wake of a succession of Houthi insurgent attacks in the Red Sea. This phenomenon has the potential to bolster oil prices and deter traders from embracing excessively pessimistic stances in opposition to the Canadian Dollar (CAD).
Without significant economic data on Wednesday, the GBPCAD pair should exercise caution before confirming a clear near-term trajectory.
Let’s see the upcoming price direction from the GBPCAD technical analysis:
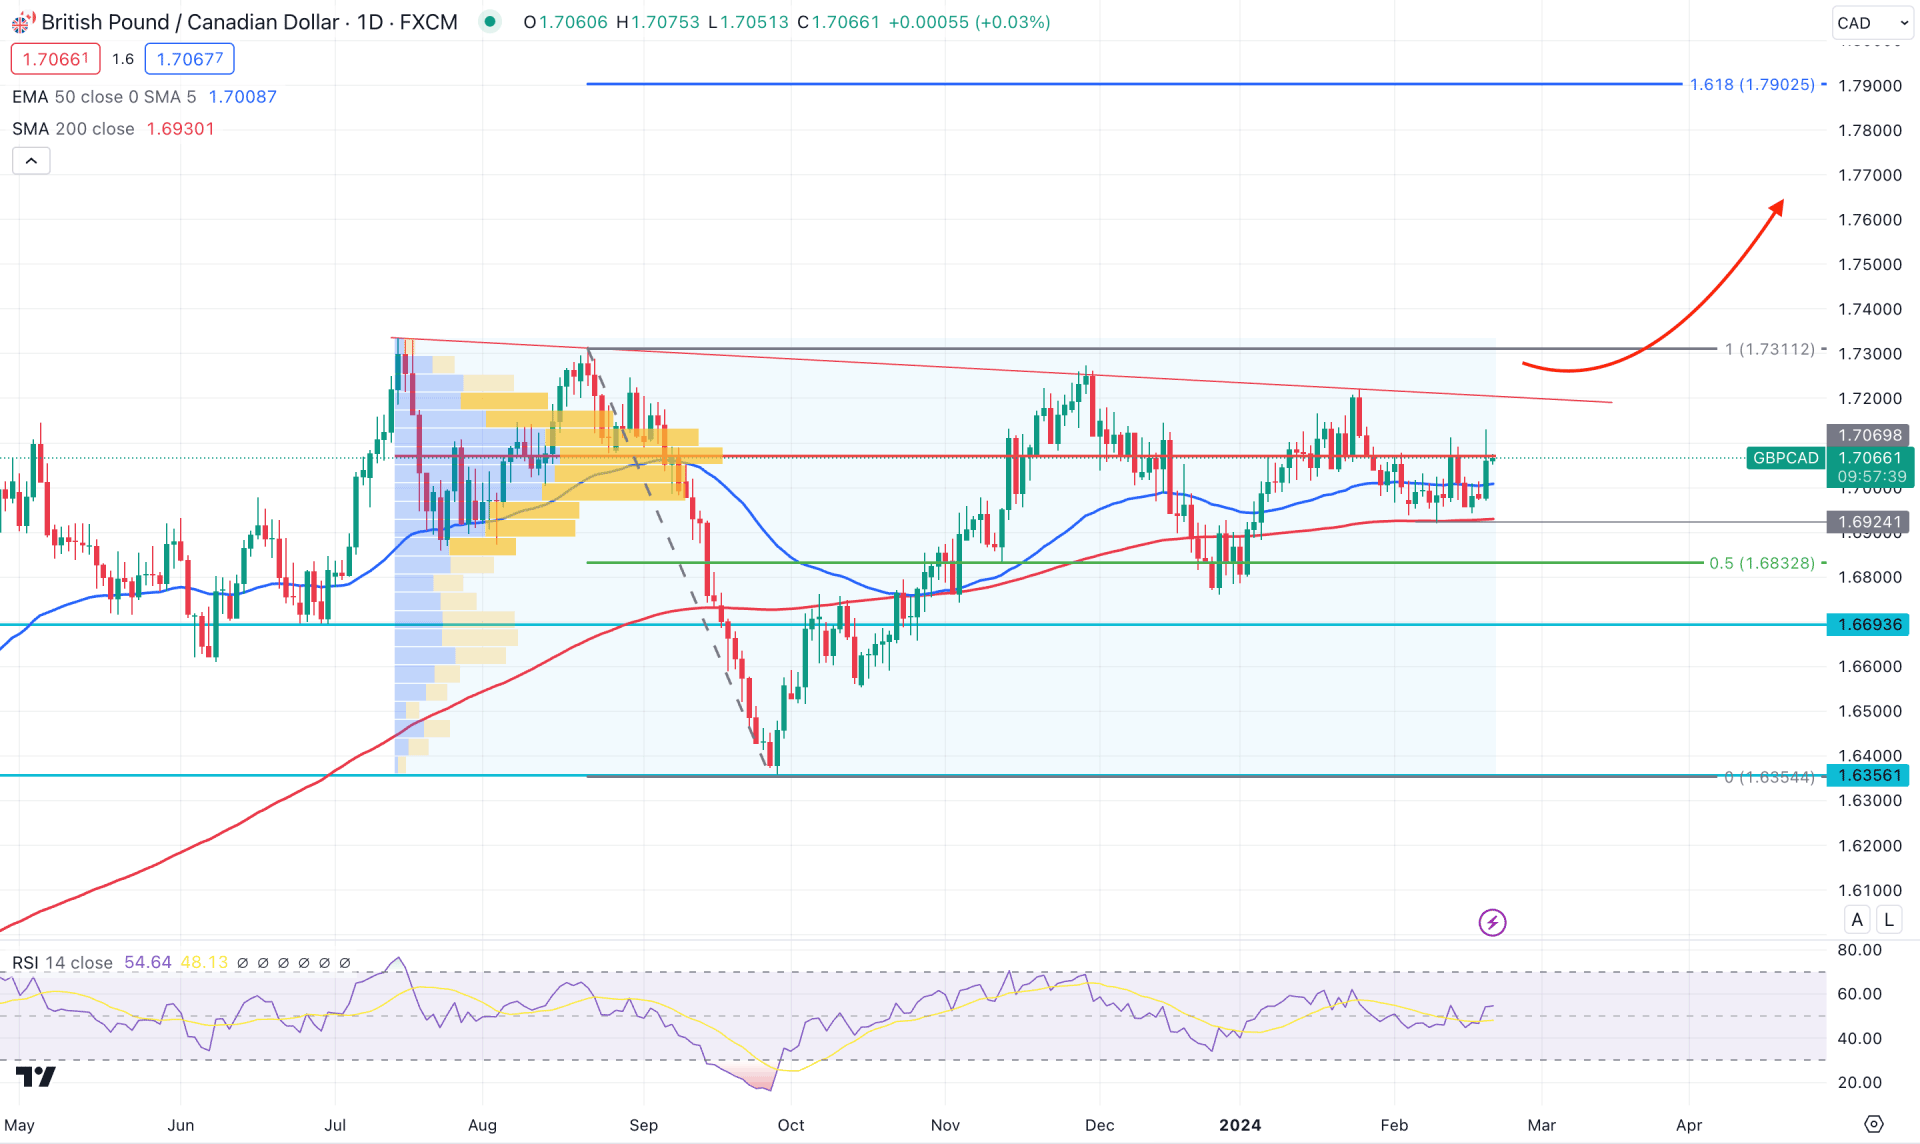
In the daily chart of GBPCAD, the ongoing price action remains volatile with a bullish pre-breakout possibility. In that case, investors should wait for a stable market above near-term support areas before opening a long position.
In the higher timeframe, the current monthly candle suggests an upward continuation after a bullish two-bar reversal. Moreover, the weekly price remained sideways for a few weeks, which suggests a possible breakout. Following the long-term direction, a breakout above the near-term high could be a potential long opportunity.
In the volume structure, the highest activity level since July 2023 is at the 1.7069 level, which is closer to the current price. In that case, a bullish breakout with a stable market above the high volume level might extend the buying pressure in the coming days.
In the daily chart, three consecutive lower high formations since September 2023 suggest an active buying pressure in the market. Moreover, the recent bullish breakout from the 50-day EMA with a bullish daily close suggests a confluence bullish signal.
The dynamic 100-day SMA works as a major support, while the 14-day RSI rebounded from the 50.00 line.
Based on the current daily outlook, a bullish breakout above the trendline resistance could be a potential long opportunity in this pair. In that case, a stable market above the 1.7221 level could extend the buying pressure towards the 1.7902 level, which is the 161.8% Fibonacci Extension from the recent swing.
On the bearish side, investors should closely monitor how the price reacts to the 1.7069 level. A bearish daily close below this line could lower the price towards the 1.6365 level.
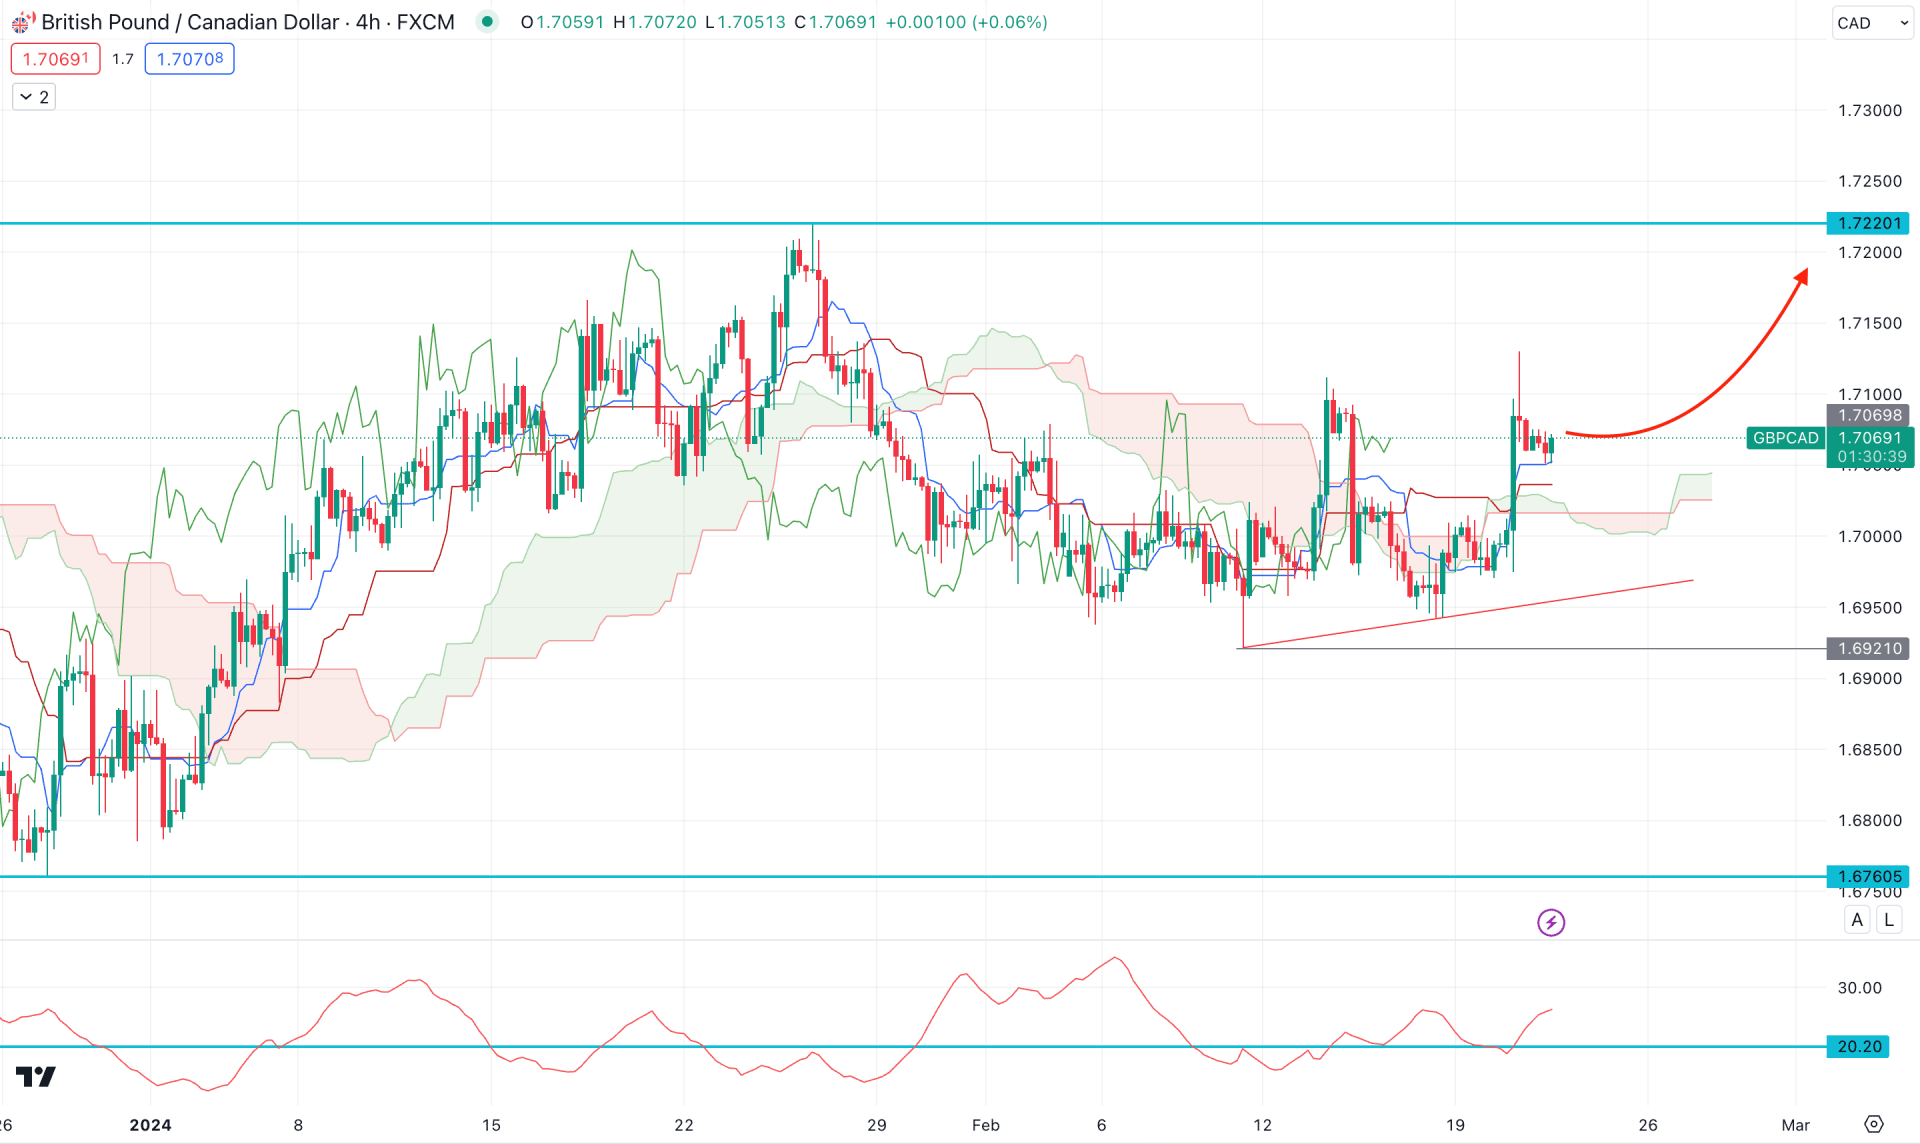
In the H4 timeframe, the current buying pressure is valid as the recent price formed a bullish breakout above the Kumu Cloud. Moreover, the Senou Span A is above the Senkou Span B, suggesting a bullish continuation opportunity.
In the secondary window, the Average Directional Index (ADX) suggests a stable trend as it remained upward after having a rebound from the 20.00 line.
In that case, any minor downside correction and a bullish rebound from the dynamic Kijun Sen level could be a valid long opportunity in this pair. In that case, the upside pressure could take the price toward the 1.7220 resistance level.
On the bearish side, a steep selling pressure with an H4 close below the 1.6921 level could lower the price towards the 1.6800 area.
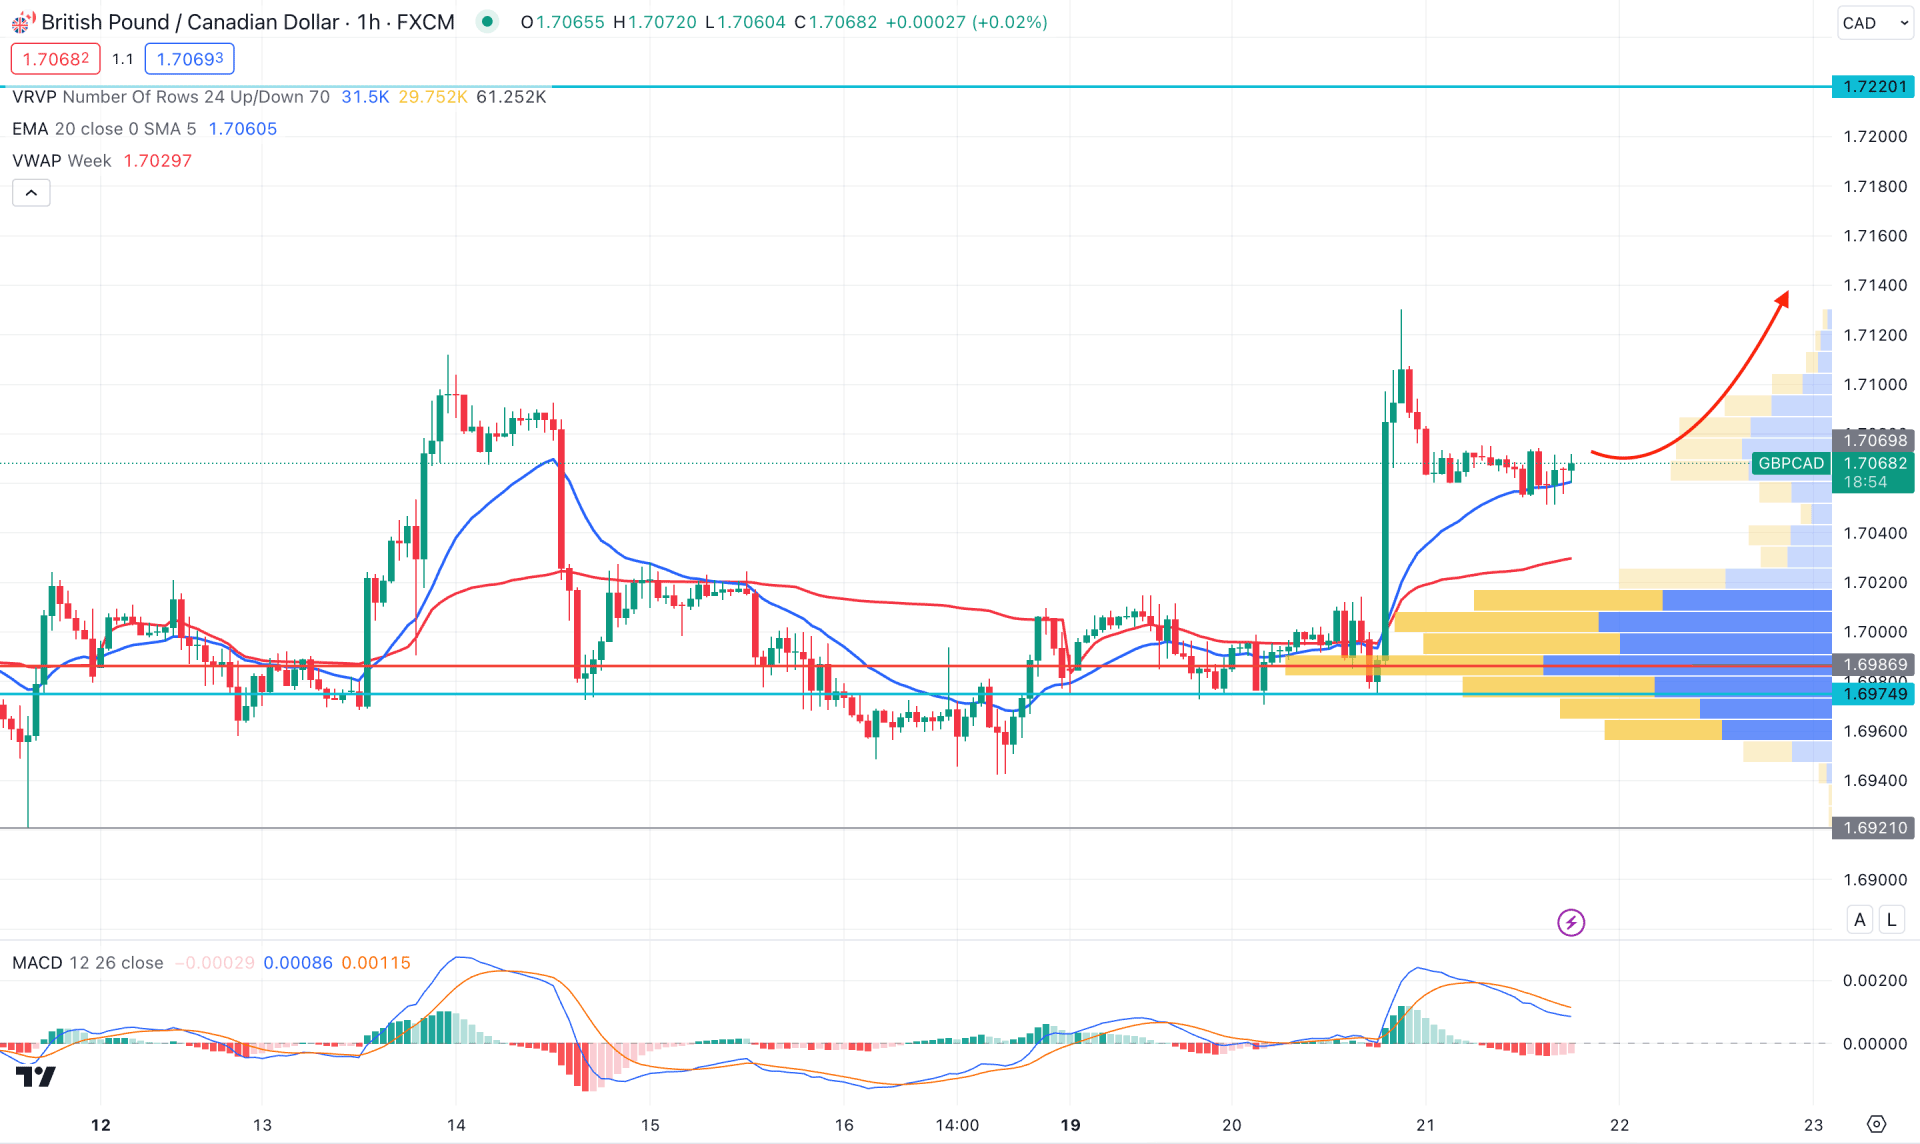
In the H1 chart, the overall market pressure is bullish, with a strong bullish breakout above the dynamic 20 EMA. Moreover, the visible range high volume level is below the current price, working as a strong support.
In the secondary window, the MACD Histogram reached the neutral level while the Signal Line was bullish.
Based on this outlook, additional buying pressure from the dynamic VWAP level could be a strong buying opportunity in this pair, targeting the 1.7200 level.
On the other hand, a downside correction toward the High volume level is possible, but a bearish close below the 1.6980 level could extend the correction toward the 1.6800 area.
Based on the current market structure, GBPCAD is more likely to extend the buying pressure in the coming days. However, a potential bullish trendline breakout is pending, which could activate the possible bull run toward the critical Fibonacci Extension level.


