
Published: August 31st, 2023
The British Pound (GBP) is exhibiting a corrective movement as investors seek new signals regarding interest rates. Positive market sentiment and the expectation that the BoE's 15th consecutive interest rate hike will reduce policy divergence with the Canadian Dollar.
Surprisingly, business confidence in the United Kingdom increased in August, driven by firms' expectation that the central bank will shortly raise interest rates. Companies are optimistic about the economy's future, expressing confidence in ongoing wage growth and predicting increased production-level prices for products and services.
On the other hand, Loonie bulls have become limited after preceding the publication of data with a decline in Canada's primary export commodity.
In the meantime, WTI crude oil is reversing its gains from a two-week high and experiencing small losses near $81.30. The performance of oil is influenced by contradictory data on China's PMI (Purchasing Managers' Index) and new information regarding stimulus measures.
The bearish continuation in the Crude Oil price could be a negative signal for CAD buyers, resulting in a bullish trend continuation in the GBPCAD price.
Let’s see the complete price outlook from the GBPCAD technical analysis:
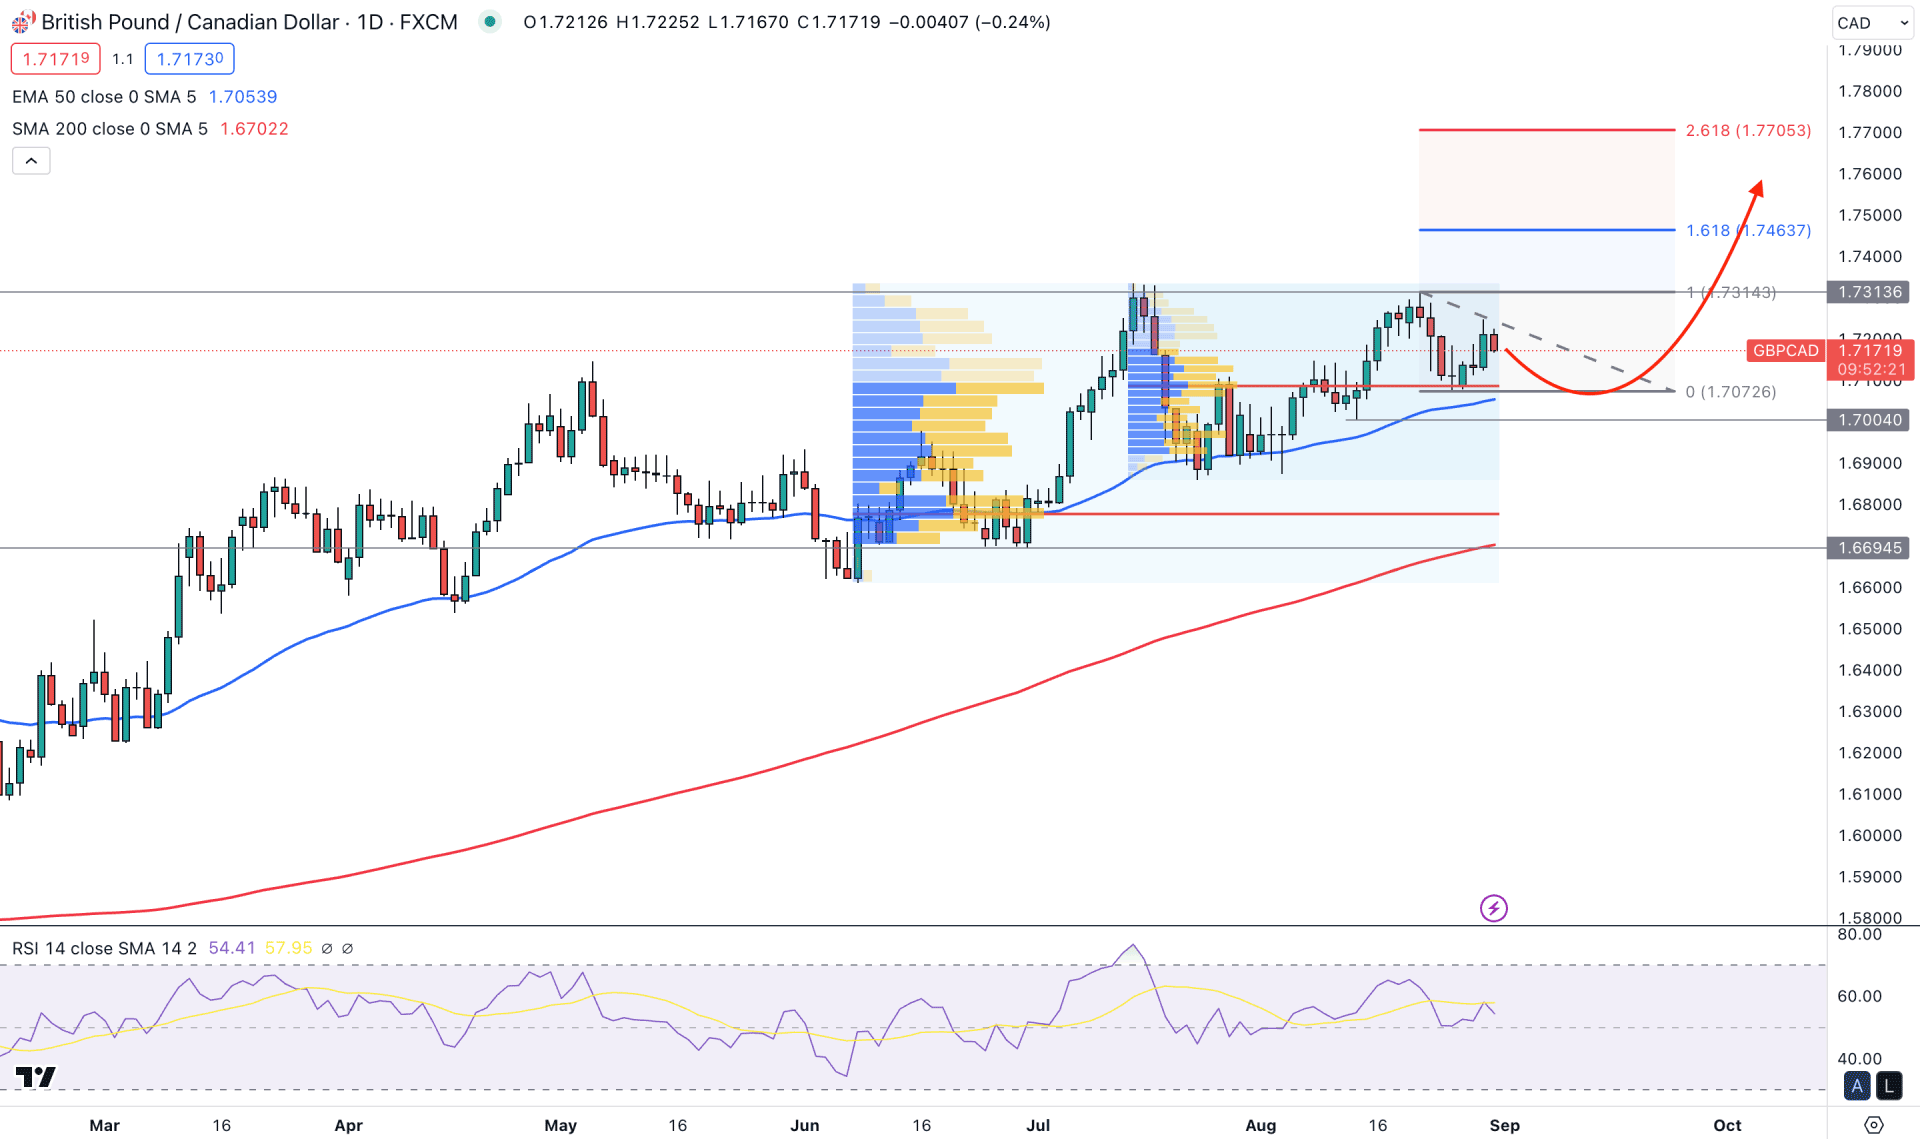
In the daily price of GBPCAD, the broader market direction is bullish, where institutional investors support a trend continuation opportunity.
Based on the volume structure, the highest activity level since the June 2023 low is at 1.6800 level, which is below the current price. As the price is trading above the major high volume level, we may consider active buyers' presence in the market. Moreover, the latest high volume level since the July swing is at 1.7092 level, which is also below the current price.
In the higher timeframe, the monthly candlestick shows a bullish trend continuation, while the latest weekly momentum is corrective after a bull run. Any bullish signal in the daily chart could sync the weekly direction as a trend continuation.
In the daily price, the overall structure is bullish, where a pre-breakout possibility is potent from the 50-day EMA carry. In this structure, the Golden Cross continuation strategy might be profitable, where a bullish signal might come from dynamic levels.
In the indicator window, the 14-day Relative Strength Index (RSI) shows a corrective momentum hovering above the 50.00 neutral line. Therefore, as long as the RSI holds the momentum above the 50.00 line, we may consider the market trend as bullish.
Based on the daily structure, the ideal trading approach is to look for long trades as long as the price holds momentum above the 200-day SMA level. Any bullish rejection from near-term levels could open a long opportunity, targeting the 1.7463 level, which is a significant Fibonacci Extension area.
The alternative approach is to look for short trades if the daily candle comes below the 1.7000 psychological level. In that case, the next target area for the downside momentum would be at the 1.6820 level.
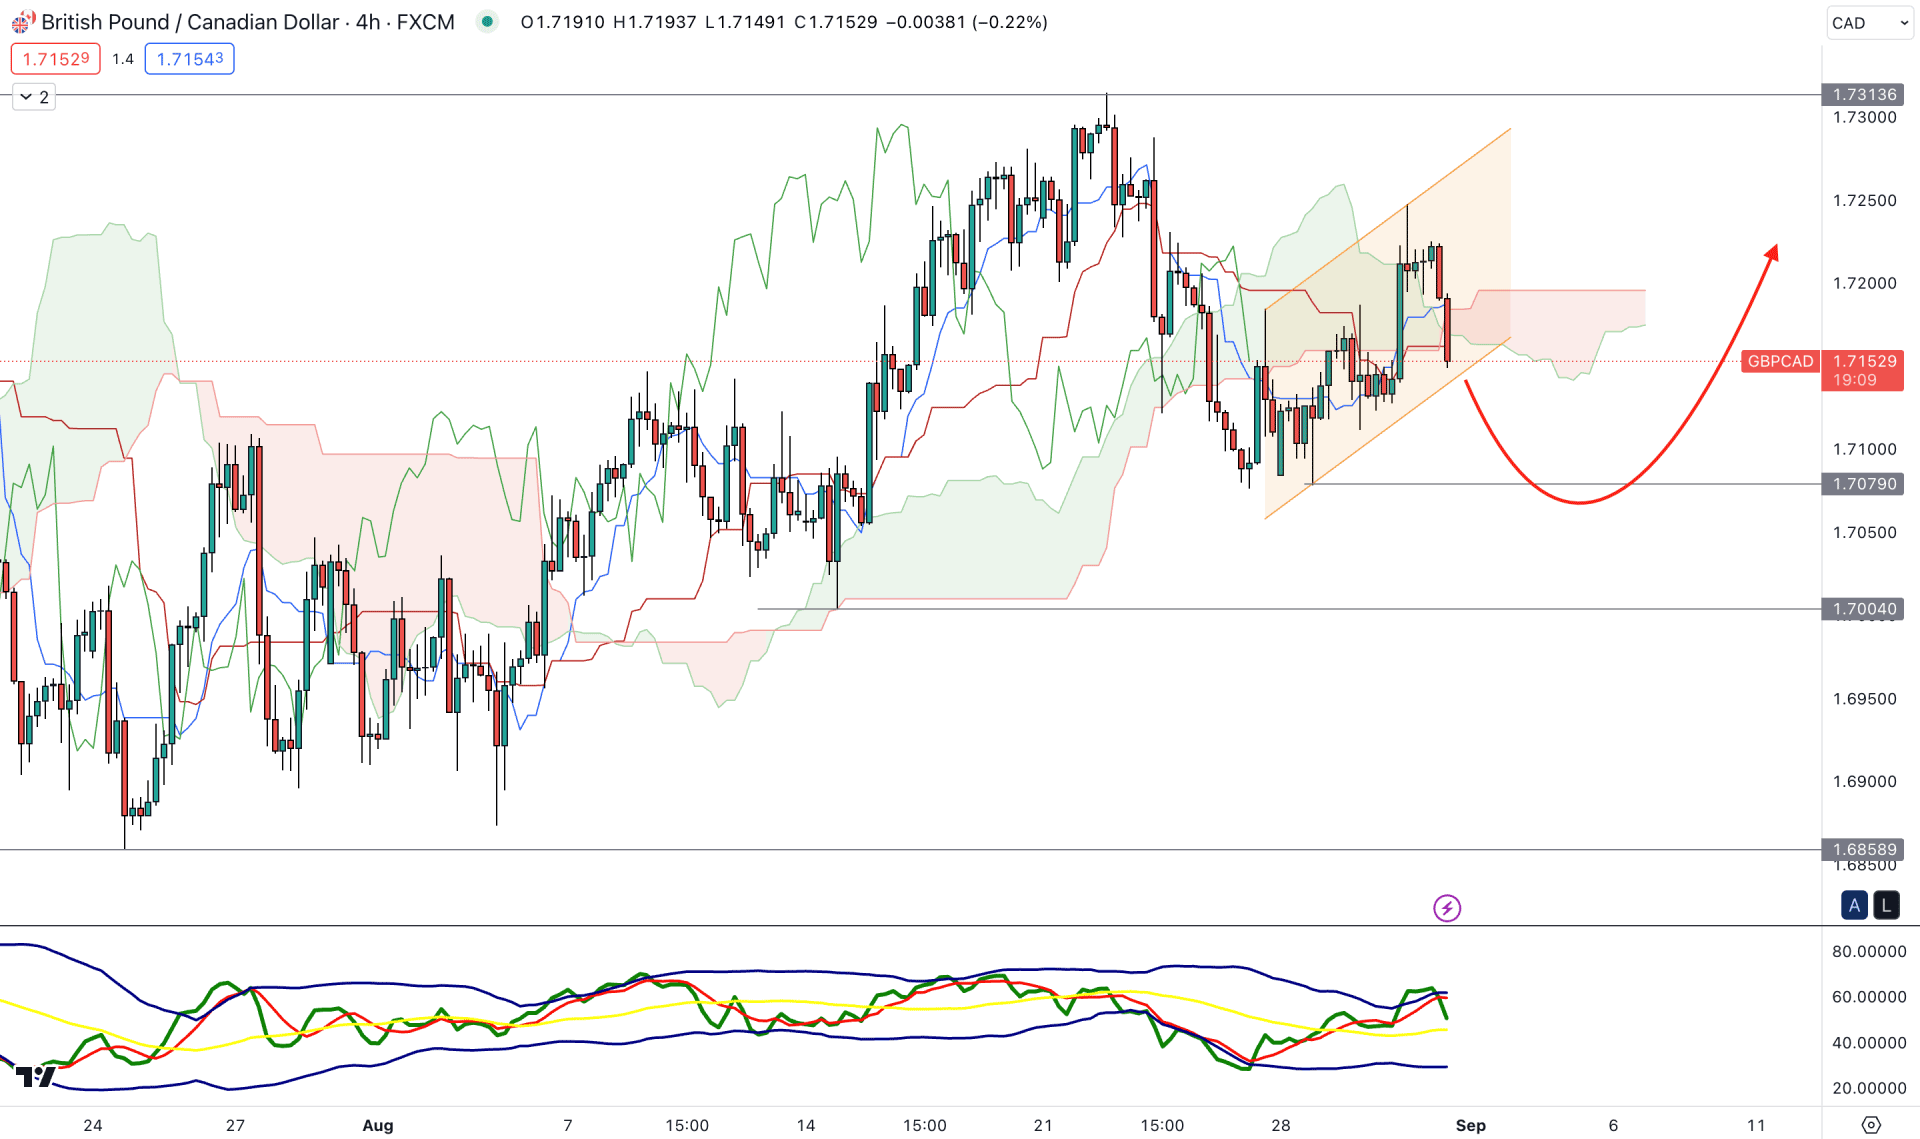
In the H4 timeframe, the overall market direction is bullish, but the near-term price action shows a corrective momentum. In that case, a solid price movement might come after grabbing enough liquidity.
In the future cloud, the overall momentum is corrective as the Senkou Span B is flat. Although the Senkou Span A is below B, an upward slope is present, which signals a buyers’ presence in the market.
In the indicator window, the current TDI level shows a downside pressure by rejecting the upper band zone, while the current level is still above the neutral 50.00 level.
Based on the H4 structure, a bearish channel breakout could increase the possibility of grabbing liquidity from the 1.7079 to 1.7004 zone. For taking a long trade, a stable momentum above the Kijun Sen is needed before aiming for the 1.7300 area.
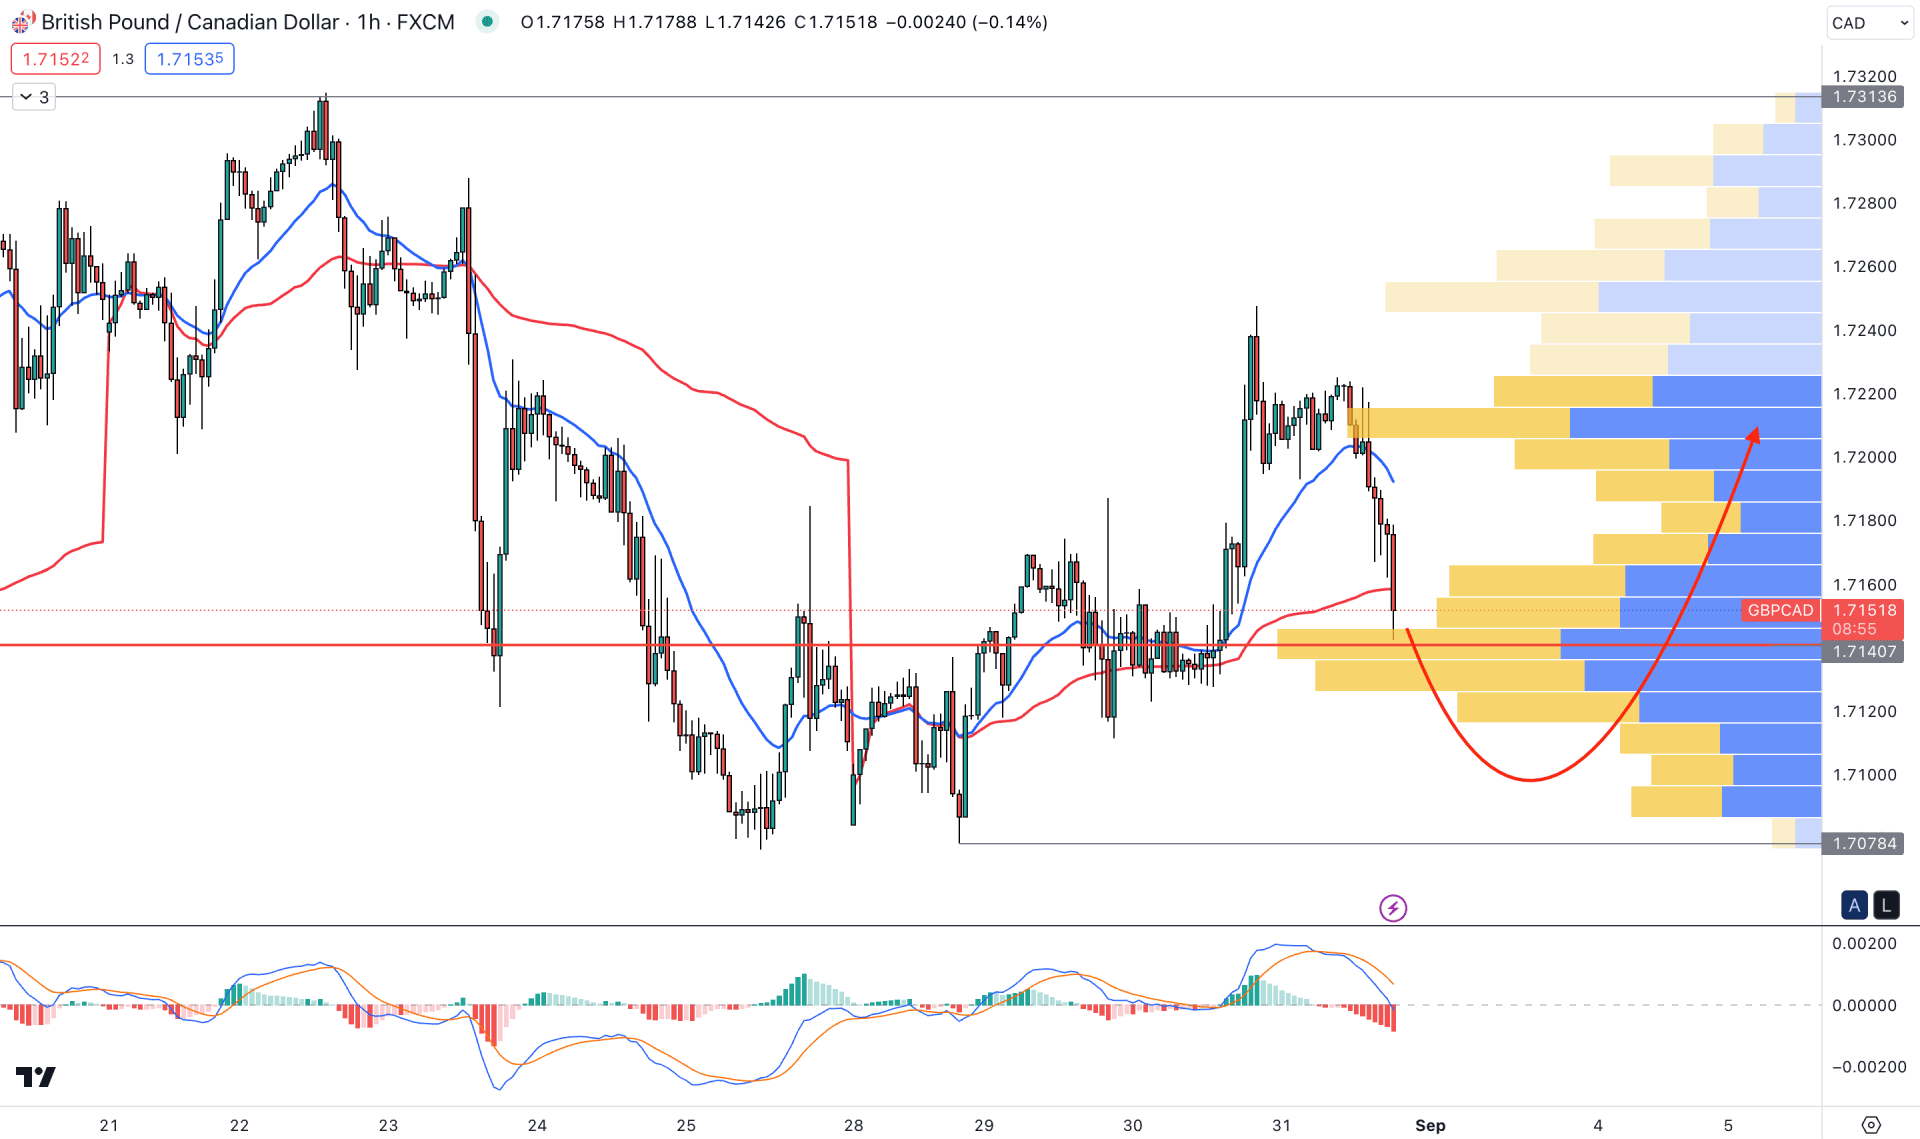
In the H1 time frame, the current price trades within a volatile structure, where the visible range high volume level is a major support. However, a selling pressure is present from dynamic 20 EMA, while the MACD Histogram is at the oversold zone.
Based on the H1 momentum, a bullish recovery with an H1 close above the dynamic 20 EMA could be a long signal, aiming for the 1.7300 level. However, the selling pressure is still potent, where a bearish H1 close below the 1.7078 level could be a short opportunity.
Based on the current market outlook, GBPCAD could resume the bullish trend, but a proper bullish breakout is needed to validate the trend continuation. Investors should closely monitor the intraday price as a strong bullish range breakout in the H4 timeframe could be an early buying opportunity.


