
Published: November 15th, 2022
In the UK, the Preliminary GDP for Q3 came in at -0.2% q/q vs. expected -0.5% q/q. Production fell 1.5% q/q, services were flat, construction output increased 0.6% q/q, and the bank holiday for the State Funeral of Her Majesty Queen Elizabeth II affected the reading, as ONS notes.
Like business investment, actual household consumption declined 0.5% q/q, while actual government spending increased 1.3% q/q. Import volumes fell -3.2% q/q while export volumes were 8% q/q up.
The UK media report published that the government plans fiscal tightening to around £60bn. Tightening will occur through spending cuts (around £25bn) and tax cuts (around £35bn). Pill, the BOE chief economist, stated that the bank will have to continue monetary policy tightening and added that they would not be on a predetermined path. He also added in their decision-making process; they will have to incorporate a broader economic outlook.
China's trade balance data for September saw a widening surplus from $84.74bn in August to $85.15bn, whereas the expectation was $95.75bn. Since May 2020, exports declined -0.3% y/y for the first time, while imports dropped -0.7% y/y. As China is the biggest trading partner of Australia, the current macro outlook is positive for AUD until a negative result comes from this week’s employment report.
Let’s see the future price of the GBPAUD from the GBPAUD technical analysis:
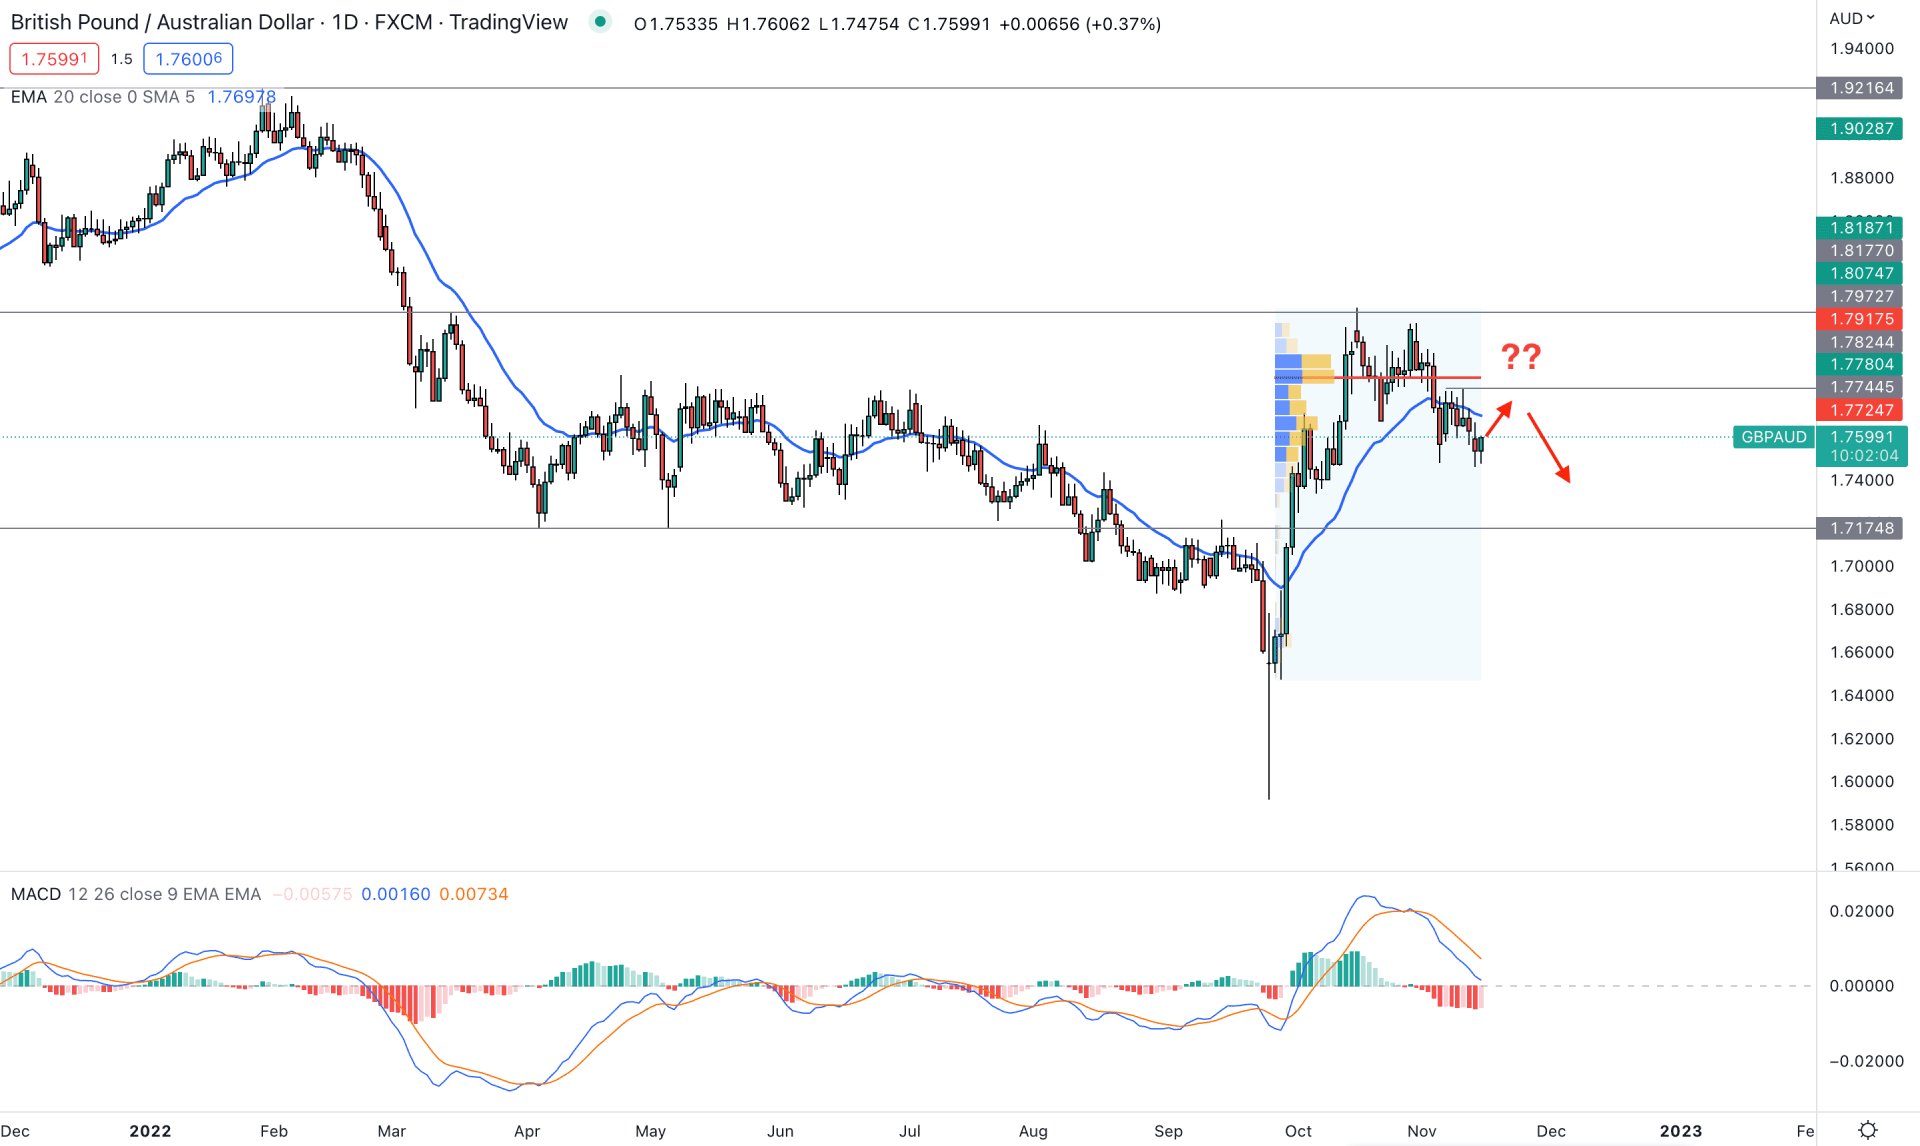
In the daily chart, the bullish exhaustion in September 2022 came with a change in volume from where massive 2264 pips upside momentum were seen. However, sellers grabbed the wheel after tapping into the March 2022 high. The bearish pressure from the 1.7972 key resistance level has become potent as it came with a new high volume level at 1.7882 level. Therefore, the primary trading idea of this pair is to look for a bearish opportunity as long as it remains below the high volume level of 1.7882.
According to the market structure, a strong consolidation after a massive 2000 pips upside pressure indicates a sign that bulls need to lose momentum before aiming higher. Meanwhile, a bearish correction has become pending after the long impulsive trend, creating a short-term trading opportunity.
The dynamic 20-day Exponential Moving Average currently trades above the price, while the 1.7744 level acts as an immediate static resistance level. The indicator window also represents a bearish possibility where the current MACD Histogram is below the neutral line.
Based on the daily structure, the bearish possibility in the GBPAUD pair is solid, where a bearish signal in the intraday chart could open a short opportunity targeting the 1.7174 support level. The alternative approach is to wait for a daily candle above the 1.7744 high volume level, before aiming for the 1.7972 resistance level.
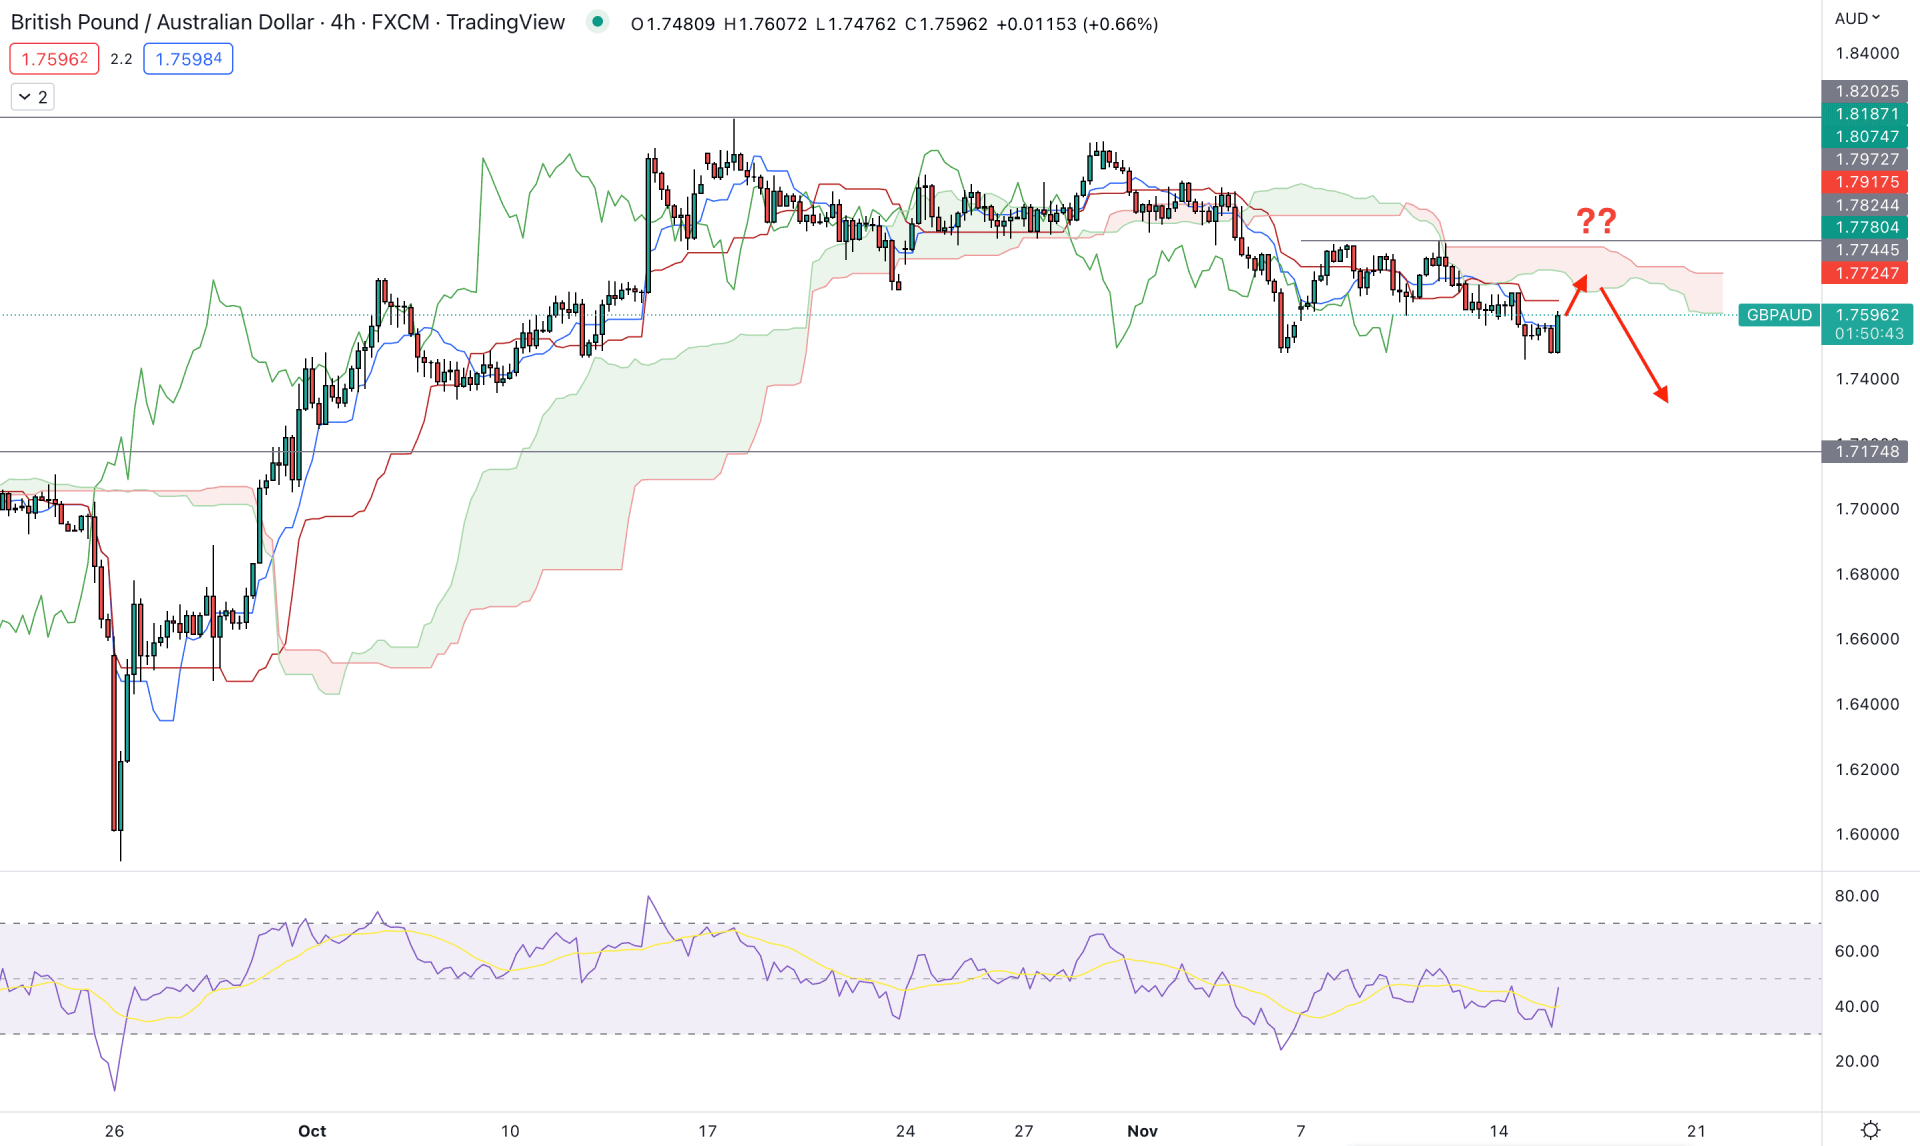
In the intraday chart, the bearish trend continuation opportunity is visible from the GBPAUD H4 chart.
The current H4 price of this pair is trading below the Ichimoku Kumo Cloud, whereas the Future cloud is bearish. The Senkou Span A and B are aiming down, whereas the Senkou Span B is below the A. It is a sign that short-term bears are more aggressive in the market than medium-term bears.
In the indicator window, the Relative Strength Index (RSI) shows selling pressure as it trades below the 50% neutral level. Moreover, the Tenkan Sen and Kijun Sen are above the current price, acting as a resistance level.
Based on the current price outlook, any bearish rejection from the dynamic Kijun Sen could open a short opportunity, targeting the 1.7174 support level. On the other hand, a bullish recovery needs an H4 close above the 1.7744 level, before aiming for the 1.8200 resistance level.
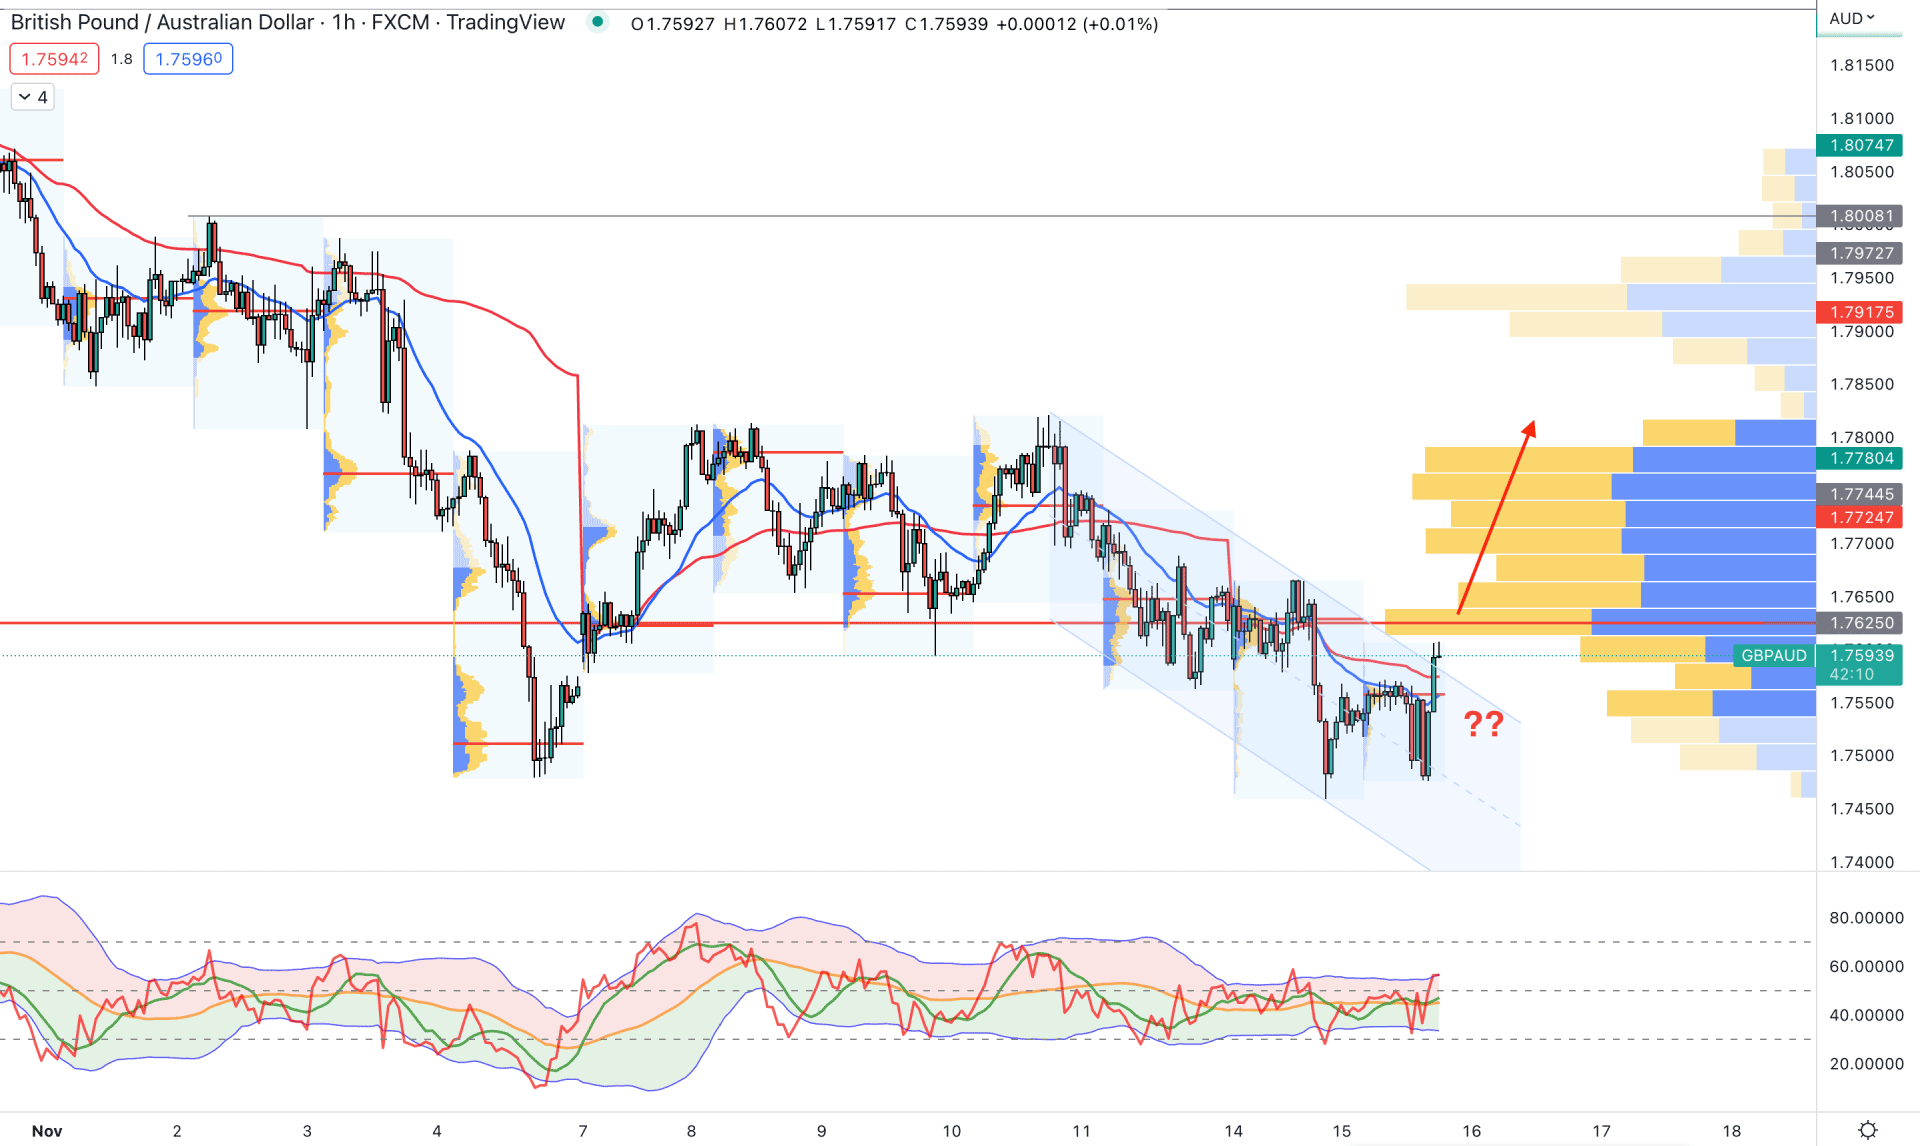
In the Hi1 timeframe, the price shows a different story as it is trading within a descending channel. Moreover, the current price is trading above the dynamic 20 EMA and weekly VWAP, while the latest intraday high volume level is below it.
However, the visible range high volume level is still above the current price, where a bullish recovery above this level is needed to form a bullish trend trading opportunity. The indicator window shows the same story where the current TDI level is at the upper band zone.
Based on the H1 price outlook, a bearish recovery with an H1 candle below the weekly VWAP is needed to form the bearish trading opportunity. On the other hand, a bullish H1 candle above the 1.7650 level could open a long opportunity, targeting the 1.8000 level.
Based on the current multi-timeframe analysis, the bearish outlook of this pair is solid for the coming days. However, investors should closely monitor how the price completes the bullish correction and form bearish rejections before opening a short opportunity.


