
Published: July 20th, 2023
The GBP has resumed its decline against the Australian Dollar as it has met significant resistance above 1.9300. The GBP/AUD pair has taken a bearish turn as investors anticipate that the Bank of England (BoE) will not implement a significant interest rate hike due to inflation responding positively to producers' reduced food prices.
However, the BoE's tightening measures will continue if inflation in the UK remains above the target rate. The decision on the interest rate will be made in August, and a 25 basis point (bps) increase would bring policy rates to 5.25 percent.
On the other hand, the Australian Dollar (AUD) is rising in response to positive domestic employment data, which indicates a tight labor market and will likely prompt the Reserve Bank of Australia (RBA) to contemplate another interest rate hike in August.
In addition, the recent euphoric run on global equity markets benefits the risk-sensitive Australian Dollar. Concerns regarding China's slowing development, deteriorating US-China relations, and geopolitical risks continue to dampen the overall optimism. In addition, concerns about the Federal Reserve adopting a more dovish policy posture help limit the dollar's losses.
Let’s see the upcoming price direction of the GBPAUD pair from the multi-timeframe analysis:
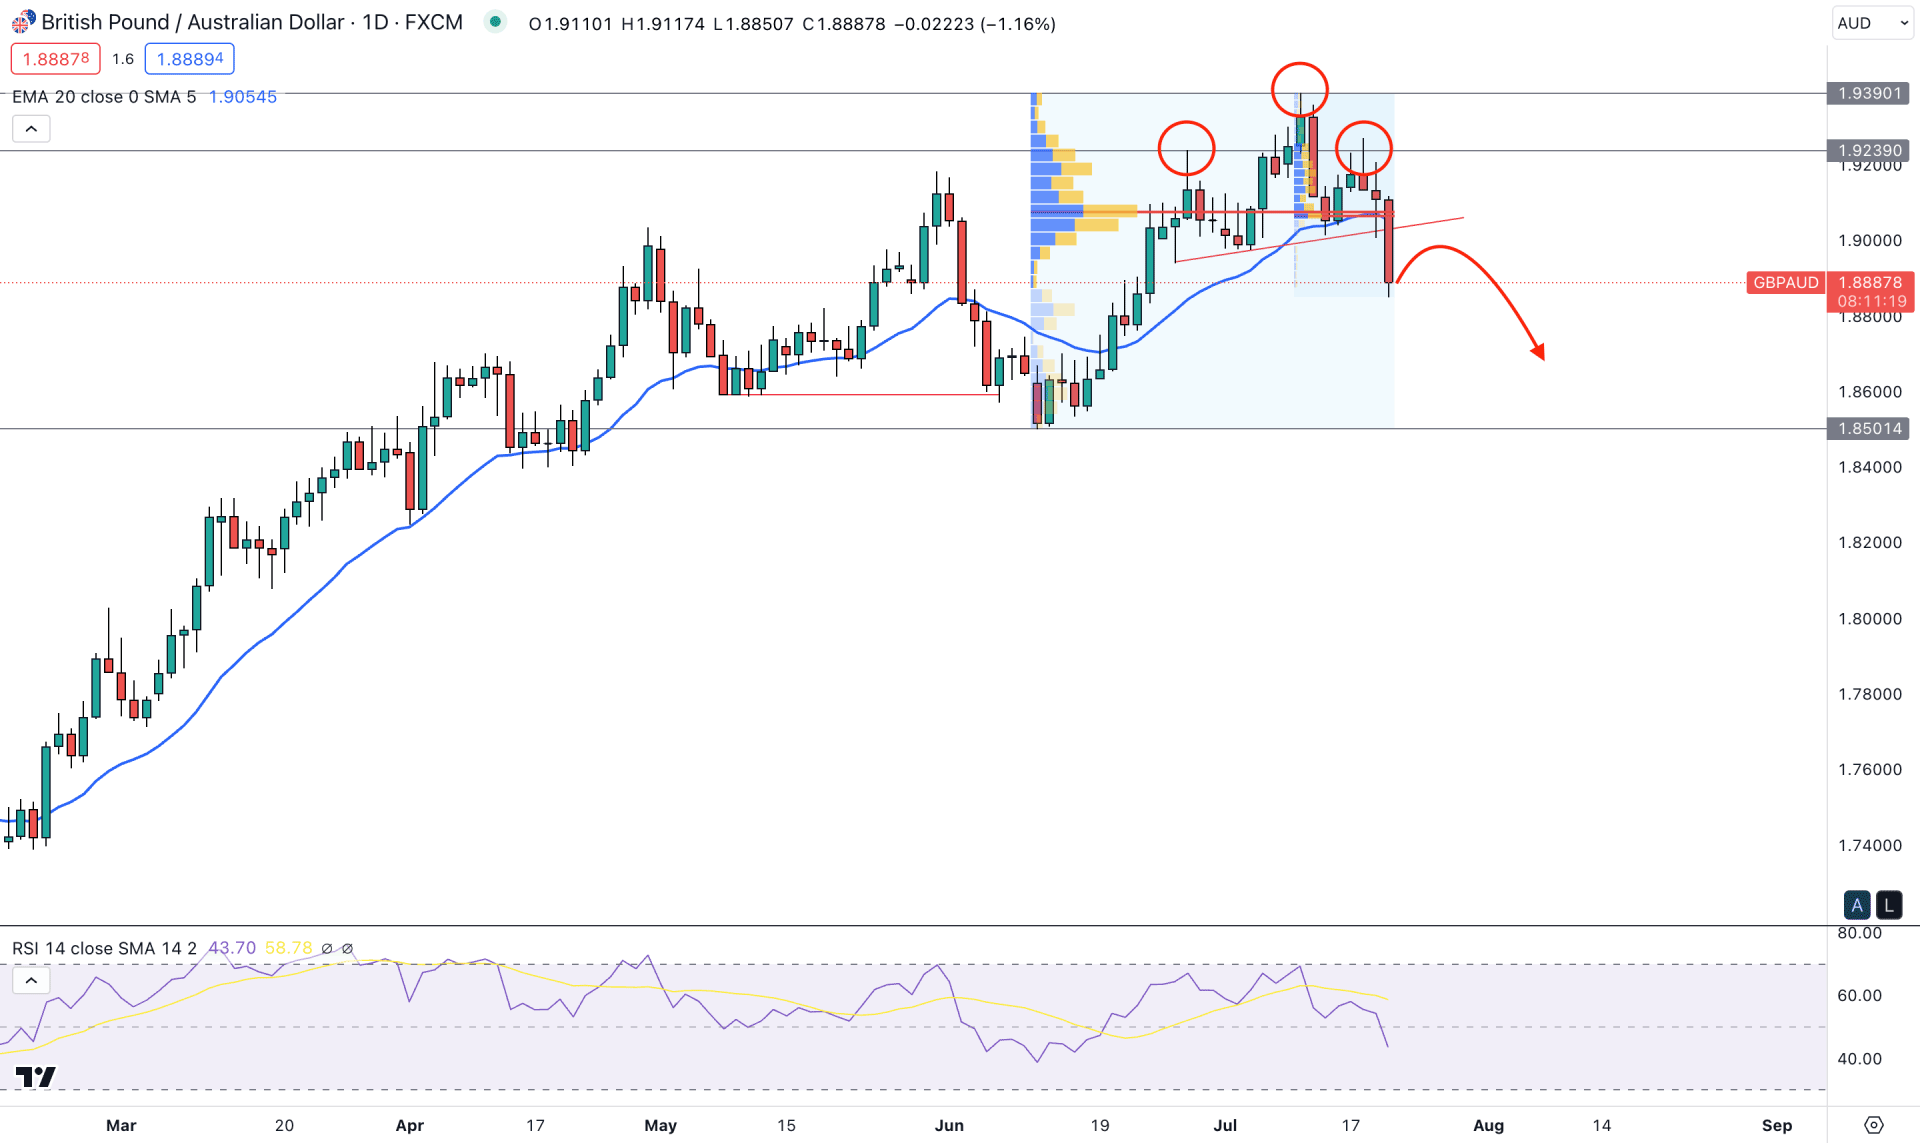
In the daily price, the overall market trend is bullish in the GBPAUD price, but the recent market behavior shows a strong consolidation at the top. It is a sign that bulls are getting out of the market and sellers are grabbing orders by forming a Change-Of-Character.
In the higher time frame candlestick, the last monthly candle closed as a Hammer, which often works as a strong reversal indication by forming at the top. Also, the selling time frame supports the weekly possibility as a strong buy-side liquidity sweep from the 24 January high is clearly visible.
Coming to the daily timeframe- the most reliable trend indicator for this instrument is the Head and Shoulders formation, where the latest daily candle validated it by forming a neckline breakout. As a result, the bearish possibility is potent as long as the price trades below the 1.9100 key psychological level.
On the other hand, a strong bearish pressure with a D1 candle close is seen below the dynamic 20 EMA level. Also, the selling pressure is supported by the new high volume level at the 1.9070 level.
In the indicator window, the current RSI is aiming below the 50.00 line, backed by a strong bearish rejection at the 70.00 level.
Based on the daily price outlook GBPAUD is more likely to extend the bearish pressure in the coming days. The first target of the downside momentum is at the 1.8600 level, but breaking below the 1.8500 level could lower the price towards the 1.8000 area.
On the other hand, a strong bullish breakout above the Head and Shoulders neckline could resume the existing trend, targeting the 1.9239 resistance level.
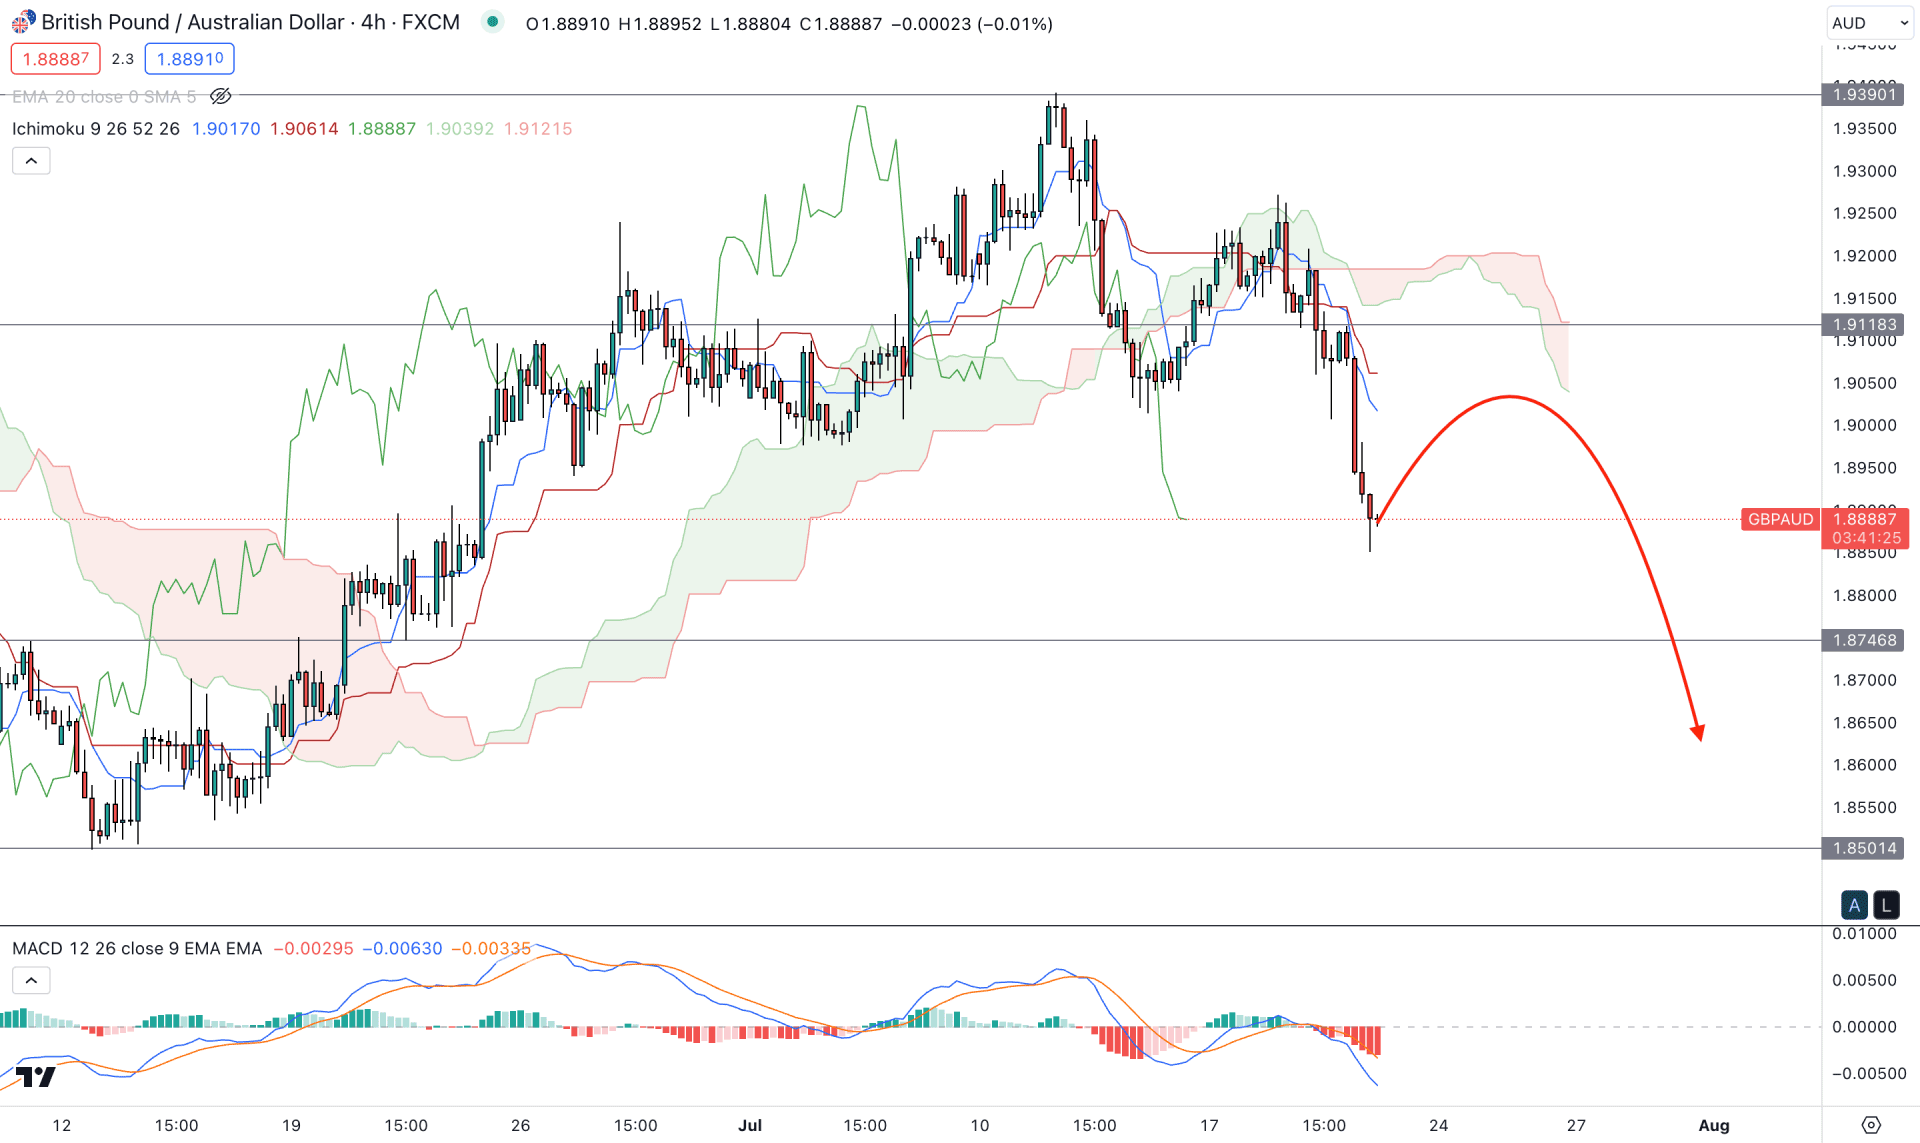
In the h4 timeframe, a strong bearish breakout is seen below the Ichimoku Kumo Cloud support area. The new bearish pressure below the key support with the second consecutive lower formation indicates a strong bearish possibility for the coming hours. In this context, the ideal trading approach is to wait for a valid pullback and a rebound from the reliable resistance area before anticipating that trend continuation.
In the indicator window, the current MACD Histogram reached the oversold area, with no sign of a divergence.
Based on the H4 chart, a decent bullish recovery is still pending, and a new bearish rejection at the dynamic Kijun Sen or 1.9000 key level could lower the price towards the 1.8700 area.
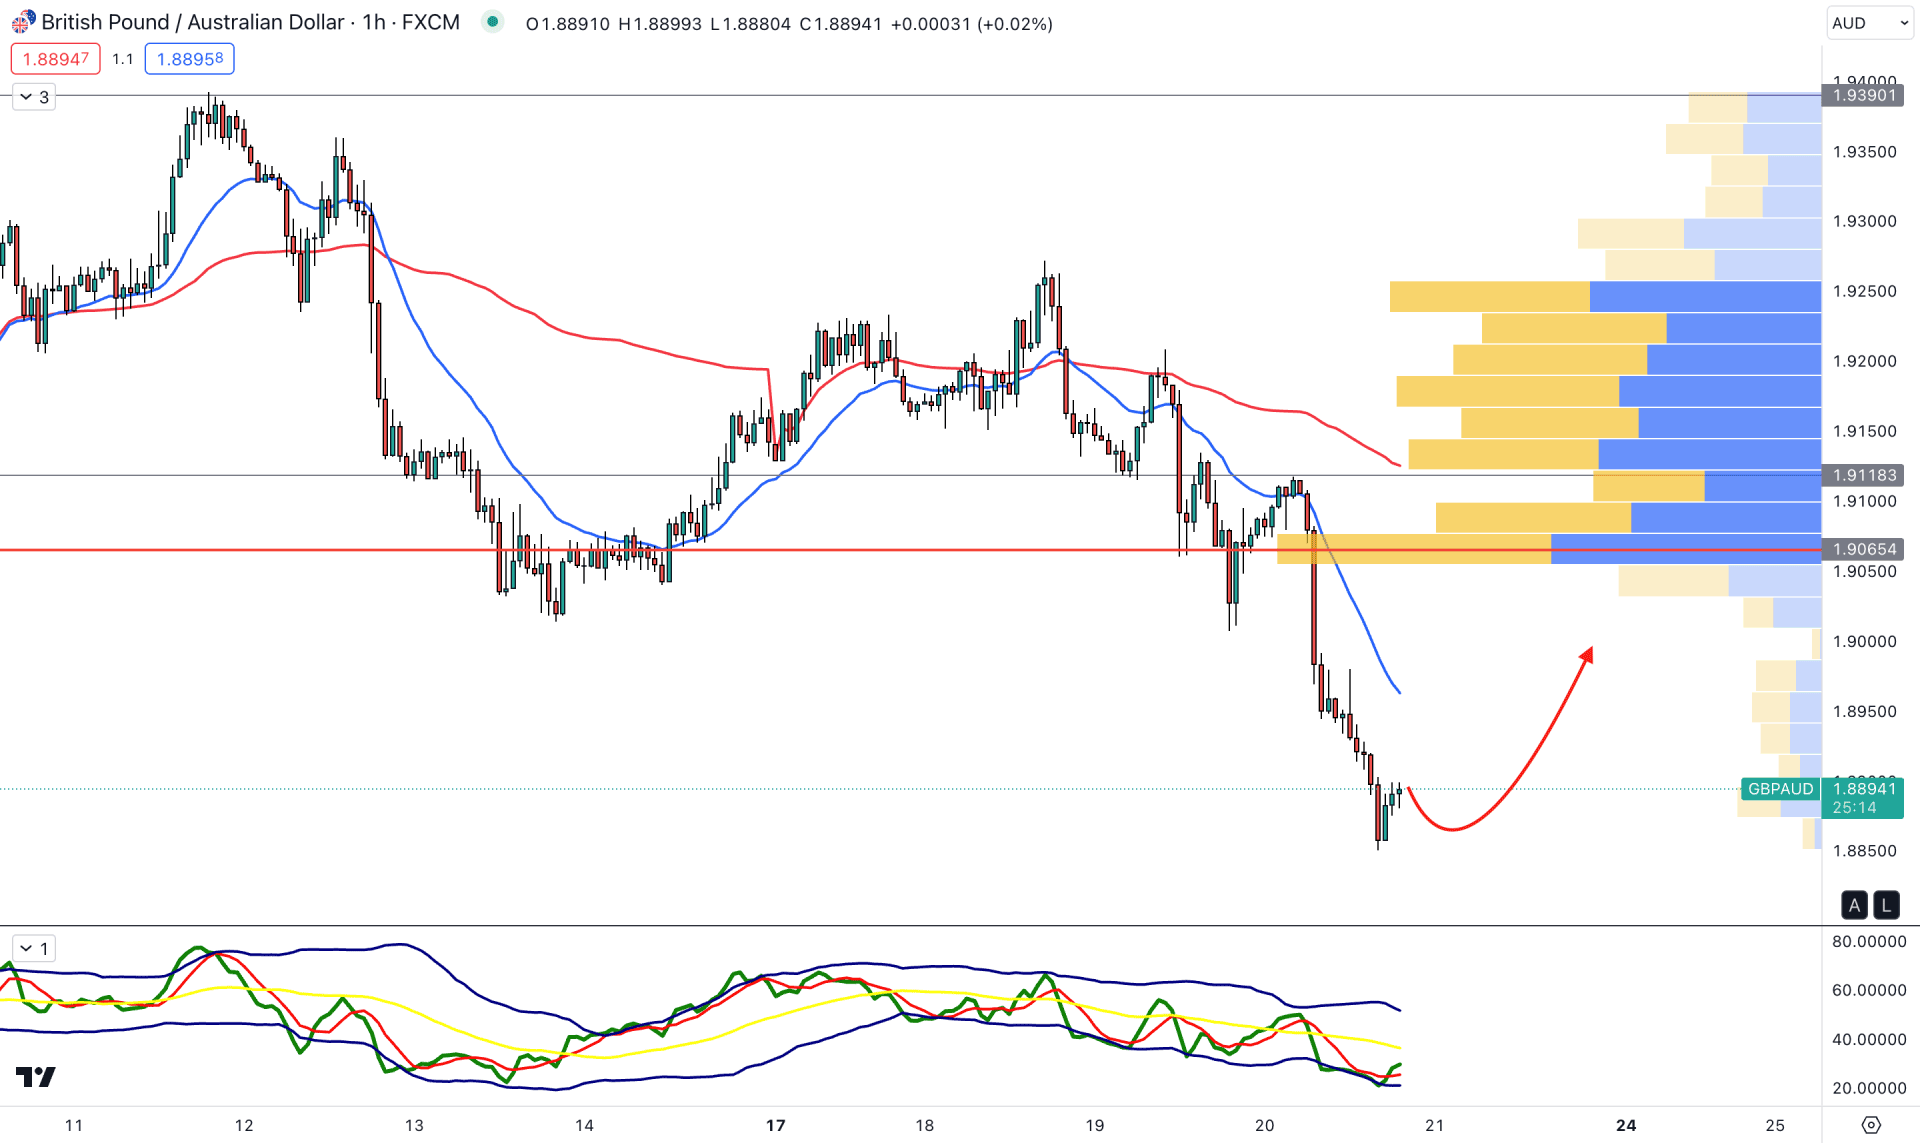
In the H1 chart, the current price trades below the visible range high volume level, but the gap is higher. Also, the dynamic 20 EMA and weekly VWAP are above the current price, with a possibility of a bullish correction as a mean reversion.
The current Traders Dynamic Index (TDI) indicator shows an oversold position in the indicator window, indicating that a considerable bullish correction is pending.
Based on the H1 outlook, investors may experience a bullish correction during the mid-US session, but any strong bearish rejection from the 1.8900 to 1.9000 area could be a valid selling point. On the other hand, breaking above the 1.9065 level could increase the price towards the 1.9250 area.
Based on the current market outlook, GBPAUD sellers may regain the momentum as the bearish pressure is supported by the valid Head and Shoulders breakout. However, the intraday price is still oversold and considerable bullish correction is needed before anticipating a trend reversal.


