
Published: April 17th, 2025
After Australia's employment data was released on Thursday, the. The data indicated that the country's unemployment rate increased to 4.1% in March, which was somewhat lower than the market's projection of 4.2%. In the meantime, employment change was 32.2K, which was lower than the 40K consensus estimate.
Following US President Donald Trump's announcement of exemptions for important technological products from the planned "reciprocal" tariffs, the AUD saw some support from improving sentiment regarding global risk. These exemptions mostly benefit products made in China, Australia's biggest trading partner and a significant purchaser of its commodities. These products include computers, smartphones, solar cells, semiconductors, and flat-panel displays.
Despite the RBA's suggestion that the May conference could be a suitable moment to review monetary policy, no definitive decision has been taken. A 25 basis point rate drop in May is presently priced into the market, with an additional 120 basis points of loosening anticipated over the next year. The focus now shifts to Thursday's employment data, which may provide important labour market information and direct the RBA's upcoming policy action.
During Wednesday's previous European session, the GBPAUD exchange rate increased and reached its highest level since early October, surpassing 1.3290. While the immediate future technical view continues to emphasise overbought conditions, the pair fixes lower on the most recent UK data but stays in positive territory.
According to a study released on Wednesday by the British Office for National Statistics (ONS), annual inflation, as determined by changes in the Consumer Price Index (CPI), decreased from 2.8% in February to 2.6% in March. This result, which was below the 2.7% market forecast, hindered the GBPAUD exchange rate's ability to gain more upward momentum.
Let's see the further aspect of this pair from the GBPAUD technical analysis:
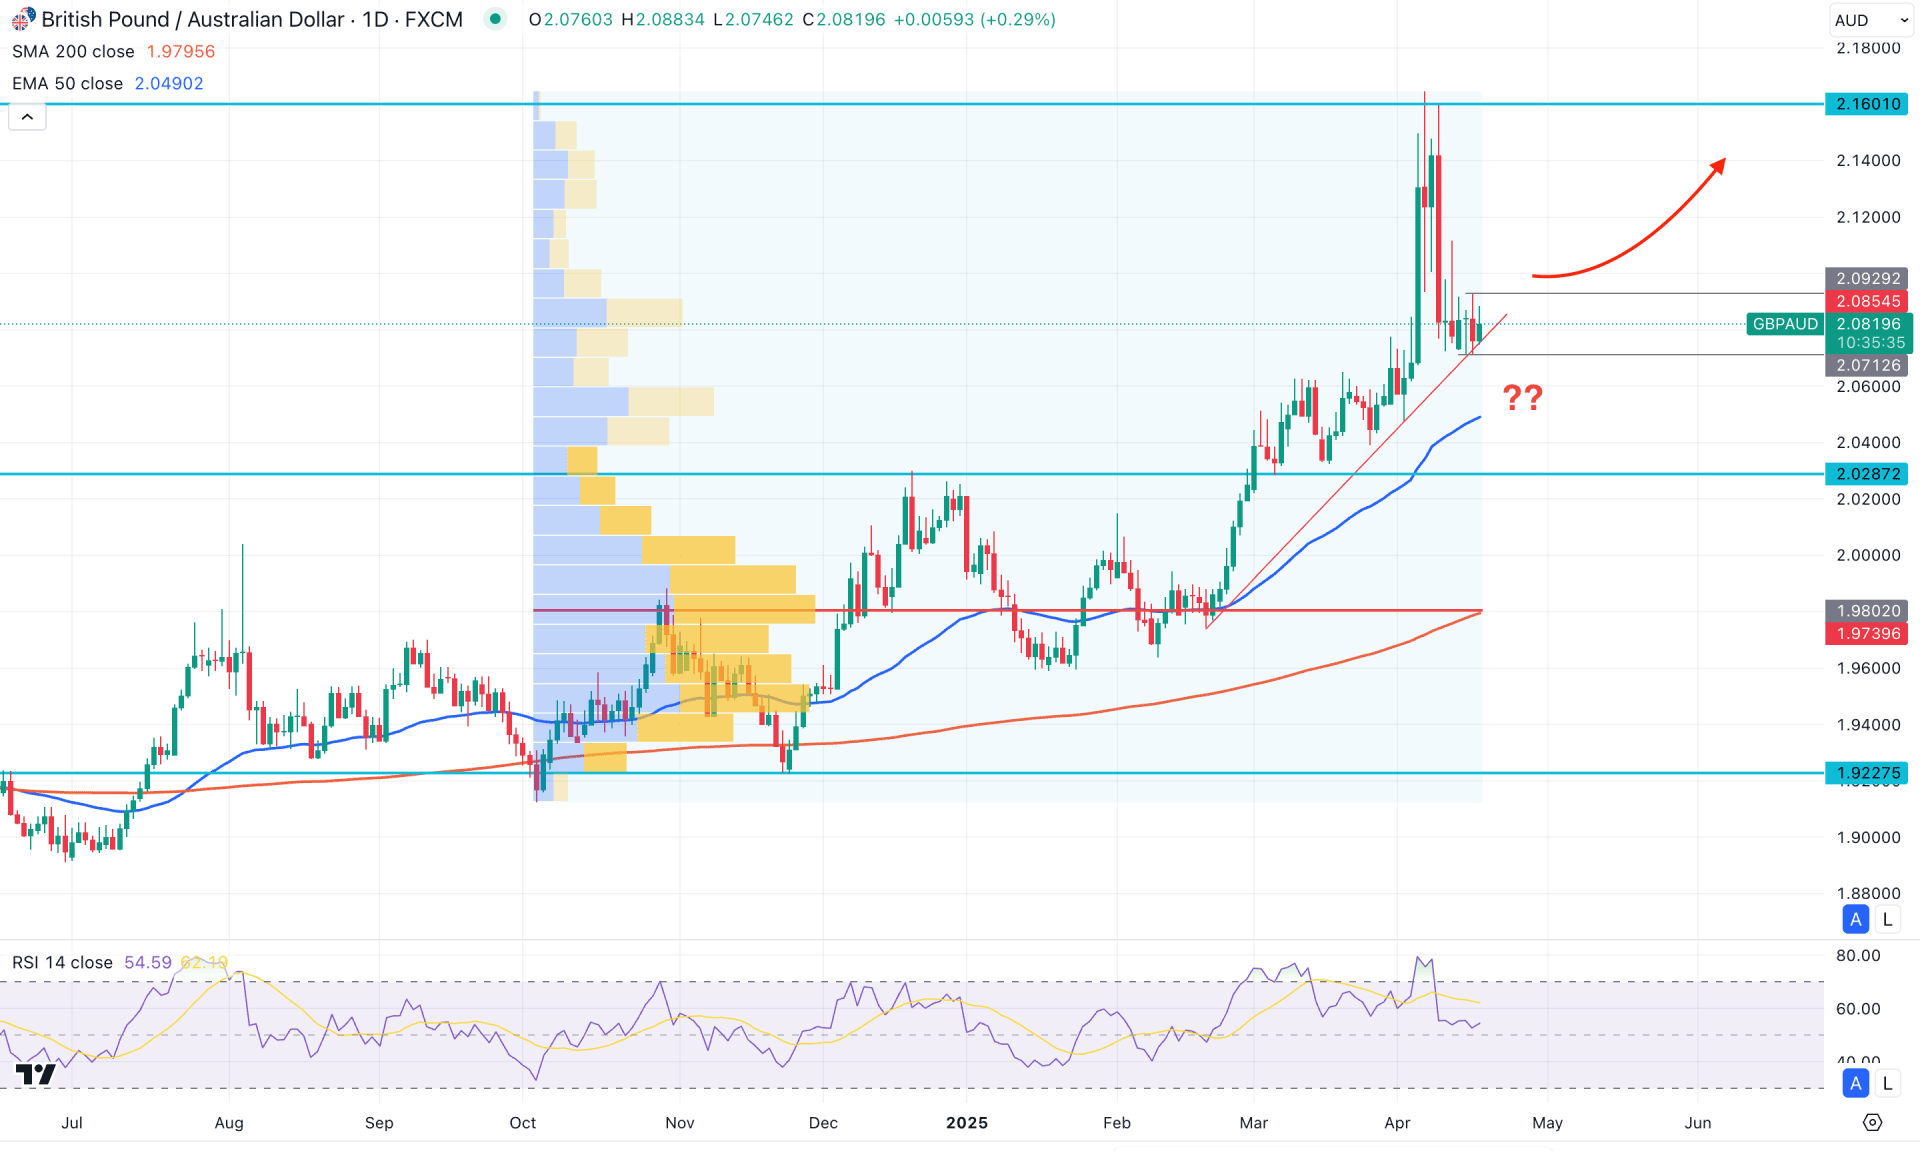
In the daily chart of GBPAUD, the overall price trend is bullish, as consecutive higher highs are clearly visible. Moreover, the extensive bullish pressure with an immediate recovery in April 2025 could be a challenging factor, as it signals a possible exhaustion at the top. In that case, investors should closely monitor how the price reacts within the existing range before anticipating future movements.
Looking at the monthly chart, the ongoing upward pressure is supported by an inside bar formation in January 2025, which created the potential to test the 10-year high. A bearish rebound is highly possible as the price struggles to maintain momentum after tapping the 2.1600 level. The weekly time frame already shows a bearish reversal signal; however, the most recent red candle failed to close below the 2.0513 low. As long as the buying pressure is supported by a rising trendline channel, we can expect one more push higher before confirming the top.
From a volume structure perspective, the extensive volatility at the top occurred without forming any significant high-volume activity. According to the volume indicator, the highest level of activity since October 2024 is at the 1.9800 level, which is well below the current price.
On the other hand, the 200-day simple moving average is positioned below the 2.0000 psychological level, while the 50-day exponential moving average is just under the immediate static support level. As long as both dynamic indicators remain below the current price with a bullish slope, we may expect upward pressure to continue in the coming days.
Although the price has extended above the 2.1600 level, the Relative Strength Index (RSI) indicator has not formed a significant divergence. Since the current RSI line is hovering near the 50.00 level, we may need a clear breakout from the existing range before anticipating future price movement.
Based on our overall market outlook, bullish momentum remains strong for GBPAUD, with the most recent price action finding crucial support from a rising trendline. Although significant retail liquidity is present below the 2.0712 level, any bullish rebound from the 2.07–2.02 area could validate a bullish continuation, targeting the 2.1500 level.
Conversely, a bearish break with an immediate rejection from the 2.0900 level, positioned below the 50-day exponential moving average, could increase the bearish potential, targeting the 1.9500 area.
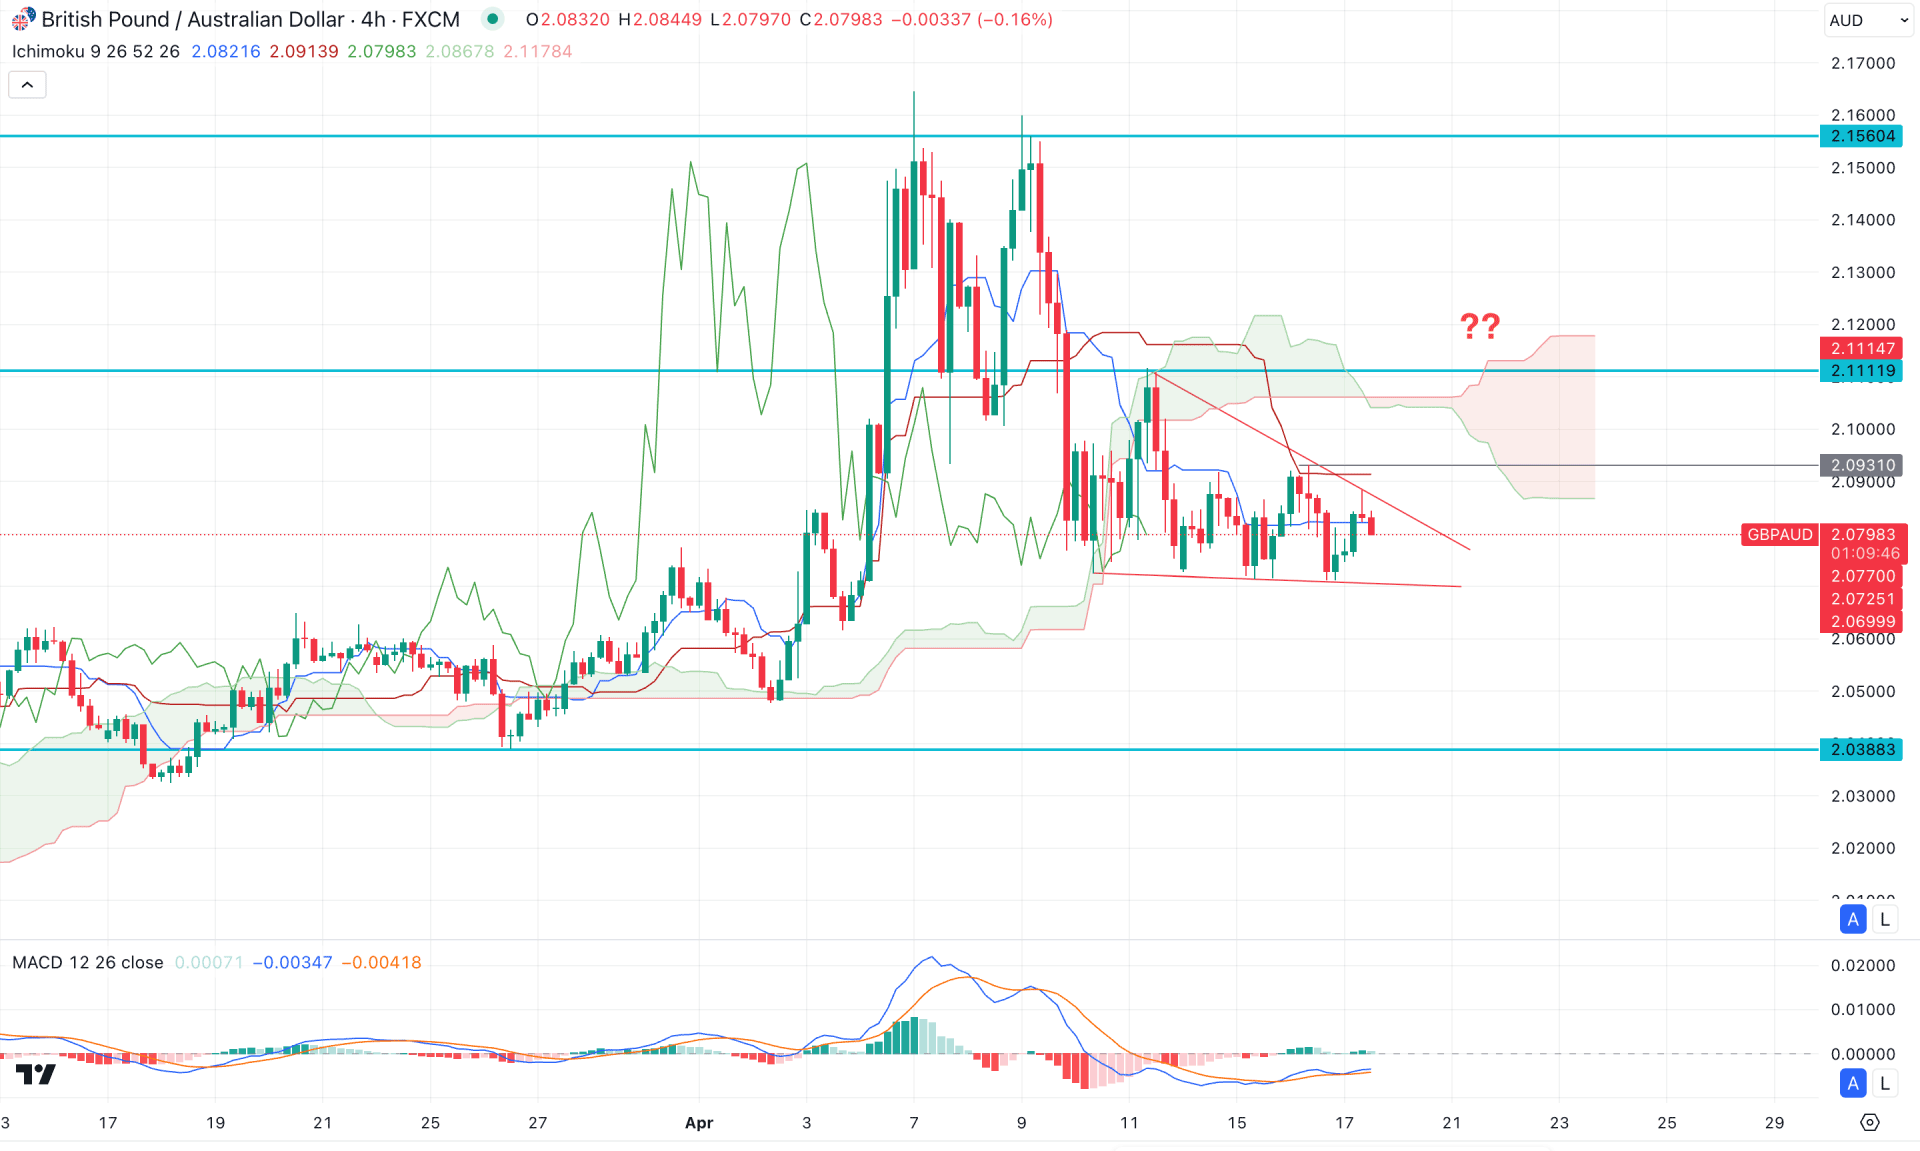
In the H4 timeframe, the recent price action shows corrective pressure below the Kumo Cloud area. Moreover, the Future Cloud appears flat, as both lines remain sideways.
The MACD histogram remains flat around the neutral zone in the secondary indicator window, indicating weak momentum. The MACD signal line is also flat below the neutral point, suggesting a possible bottom formation.
Based on this outlook, downside continuation remains likely as long as the price stays below the Cloud. In that case, a bullish push above the 2.0930 level, followed by an immediate bearish reversal below the key area, could validate a short opportunity targeting the 2.0300 level.
On the other hand, an extended buying pressure above the 2.1110 level could signal a trend shift, potentially opening the room for a rally toward the 2.1560 level.
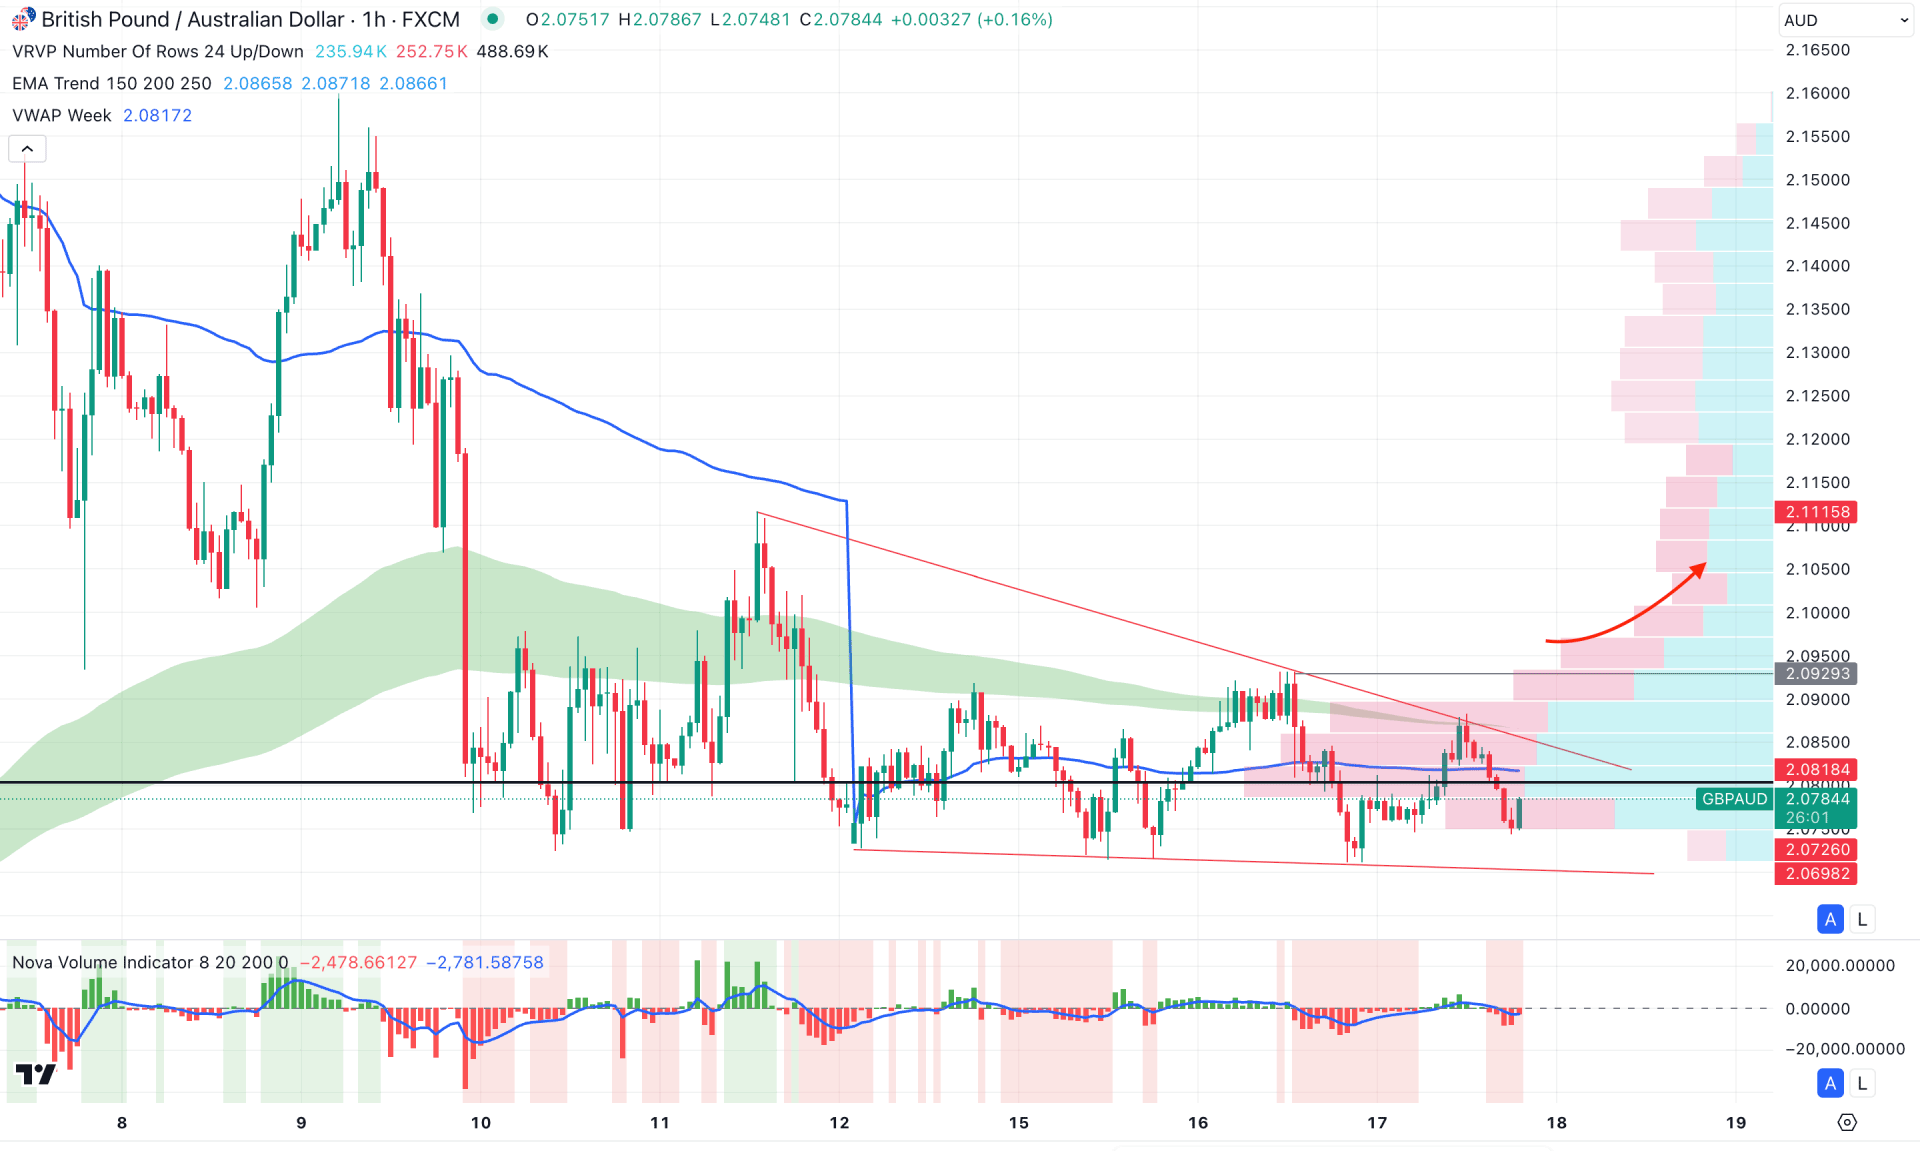
In the hourly chart, the recent price is trading within a falling wedge pattern, where the high volume line is positioned close to the current price. Although the moving average wave is above the current price, it remains flat, aligning with the trendline resistance.
In the secondary window, the volume histogram suggests a potential dip in selling pressure, as the most recent bar has flipped to a neutral position.
Based on this outlook, an extended bullish breakout above the 2.0929 level could validate a long opportunity, targeting the 2.1400 area. On the other hand, a failure to hold above the 2.0900 level could be an alarming signal, potentially driving the price lower in the coming hours.
Based on the current market structure, GBPAUD remains in a strong bullish trend, and any intraday confirmation could help resume the momentum. Investors should closely monitor how the hourly price reacts at the trendline resistance, as a valid breakout could offer a trend continuation opportunity.
Conversely, more extended selling pressure with consolidation is needed before anticipating a potential market trend reversal.
Let me know if you'd like a version with a stronger call to action or adapted for a specific platform (e.g., newsletter, TradingView idea, or social media post).


