
Published: May 11th, 2023
As anticipated, the United Kingdom's central bank has raised its benchmark interest rate by 25 basis points to 4.50%. Due to persistent inflationary pressures, the accompanying monetary policy statement revealed that the bank anticipates further tightening. This move has supported the British Pound and helped the GBP/USD pair avoid a retracement slide from its recent high of 1.2680.
In the meantime, China's Consumer Price Index decreased to 0.1% YoY from 0.7%, falling short of market expectations of 0.3%. In addition, the Producer Price Index has decreased to -3.6% YoY, compared to the consensus forecast of -3.2% and the previous reading of -2.5%. In contrast, Australia's Consumer Inflation Expectations for May have increased to 5.0% from 4.6% previously.
Notably, the RBA documents disclose that if the cash rate remains at 4.8%, the Australian central bank expects inflation to reach its target in late 2024.
In addition, the market sentiment is supported by the forthcoming meeting between US and Chinese policymakers and Australia's desire to strengthen ties with China. This, in turn, supports the rise of the risk barometer duo.
Let’s see the possible price direction of GBPAUD from the current technical analysis:
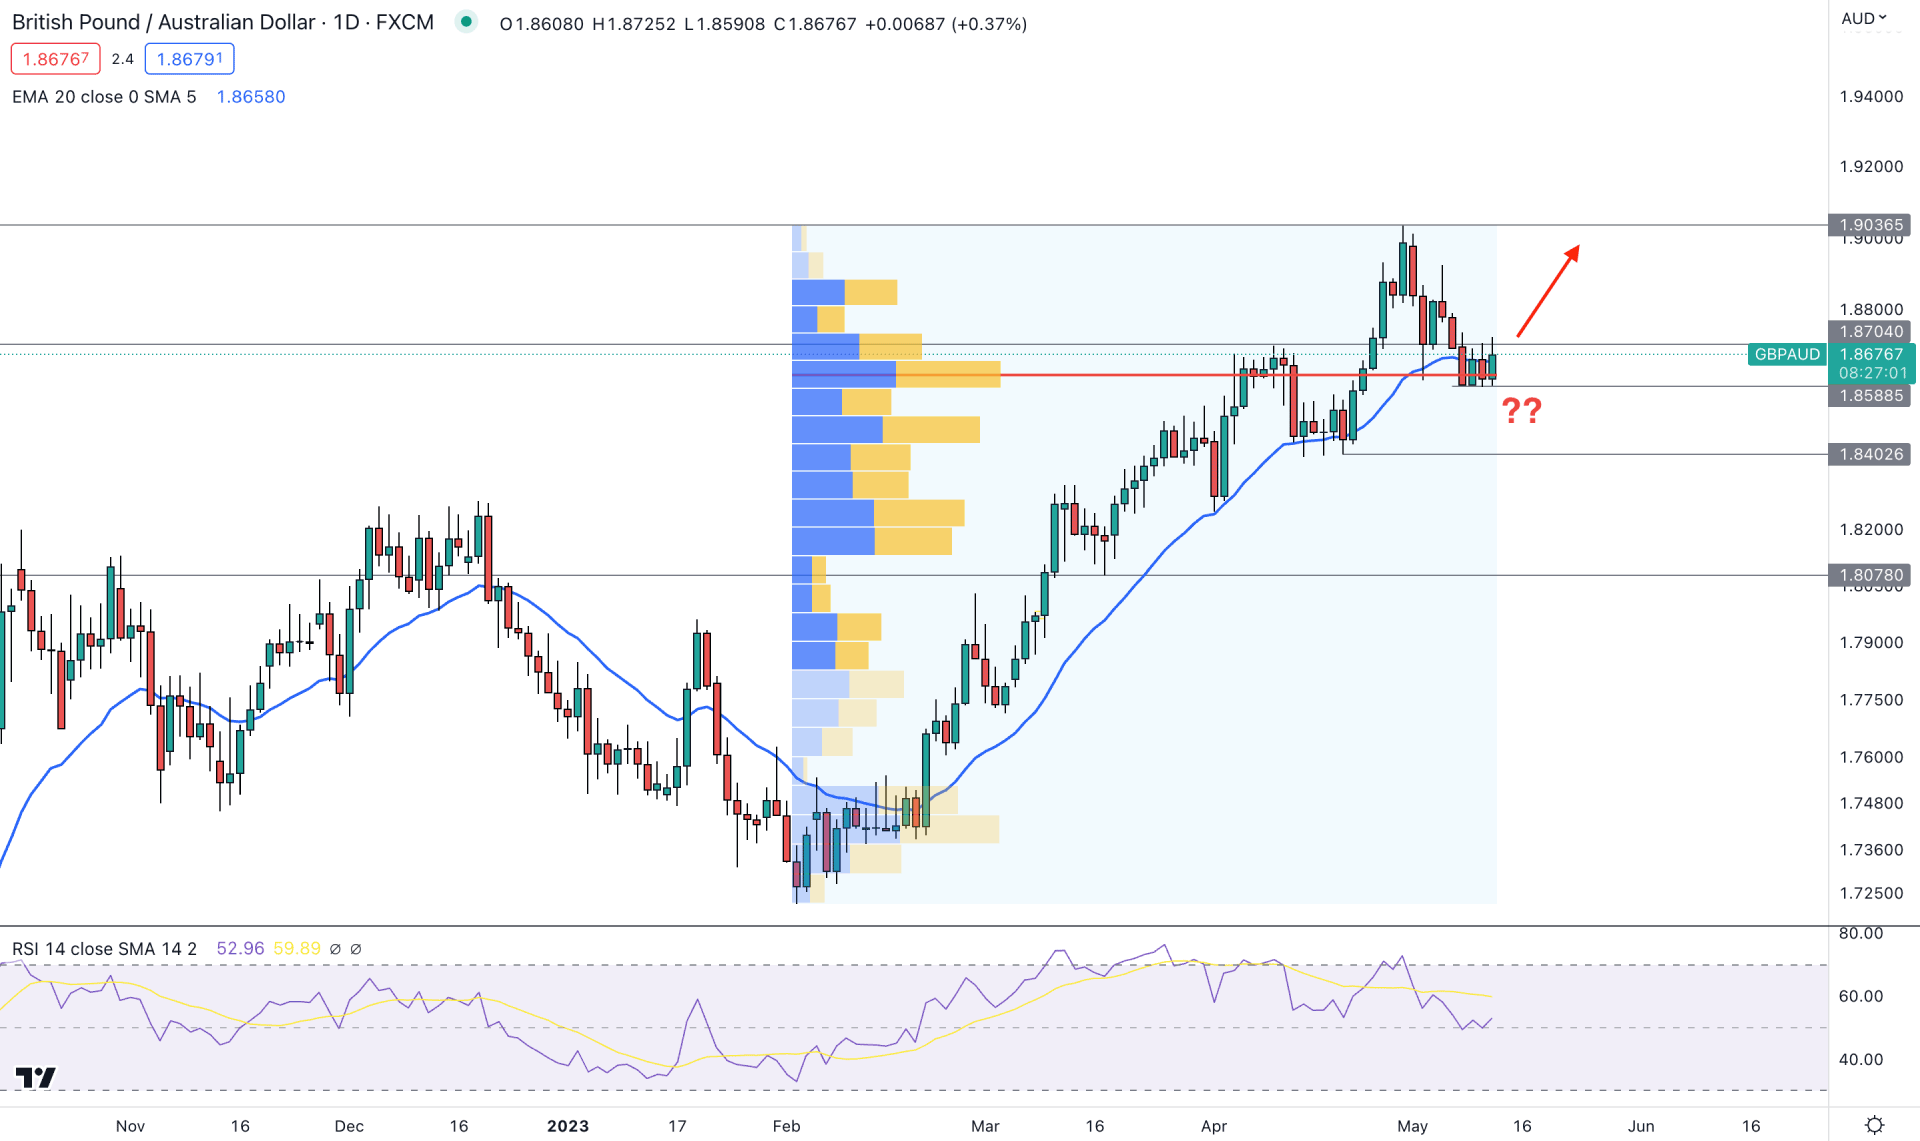
In the daily chart, GBPAUD is trending higher, which is a sign of a strong buying pressure. In that case, the primary intention of this pair is to look for long trades only. However, the strong bull run from 1.7219 might need some relief, increasing the possibility of a bearish correction. Until a proper change of character formation, bulls have a higher possibility of winning the battle.
In the higher timeframe price action, the buying pressure is questioned from last week's bearish W1 close. However, as long as the price is trading above the weekly support, a rebound is likely to occur.
This pair's volatility increases as the latest high volume level moves closer to the current price level. As per the current data, the Fixed Range High Volume level since February 2023 low is at 1.8620 level, which is just below the current price.
The current dynamic 20-day EMA level in the main chart window is closer to the price, where a strong daily candle above this level could offer a long signal.
In the secondary window, the current RSI is very corrective at the 50.00 level, from where a bullish breakout is needed to form a stable trend.
Based on the daily context, the bullish trend trading opportunity is valid in the GBPAUD pair, where the D1 candle above the 1.8704 level could offer a long opportunity, targeting the 1.9000 level.
On the other hand, a bearish swing low below the 1.8588 level would create a bearish Change-Of-Character, which may lower the price towards the 1.8400 area.
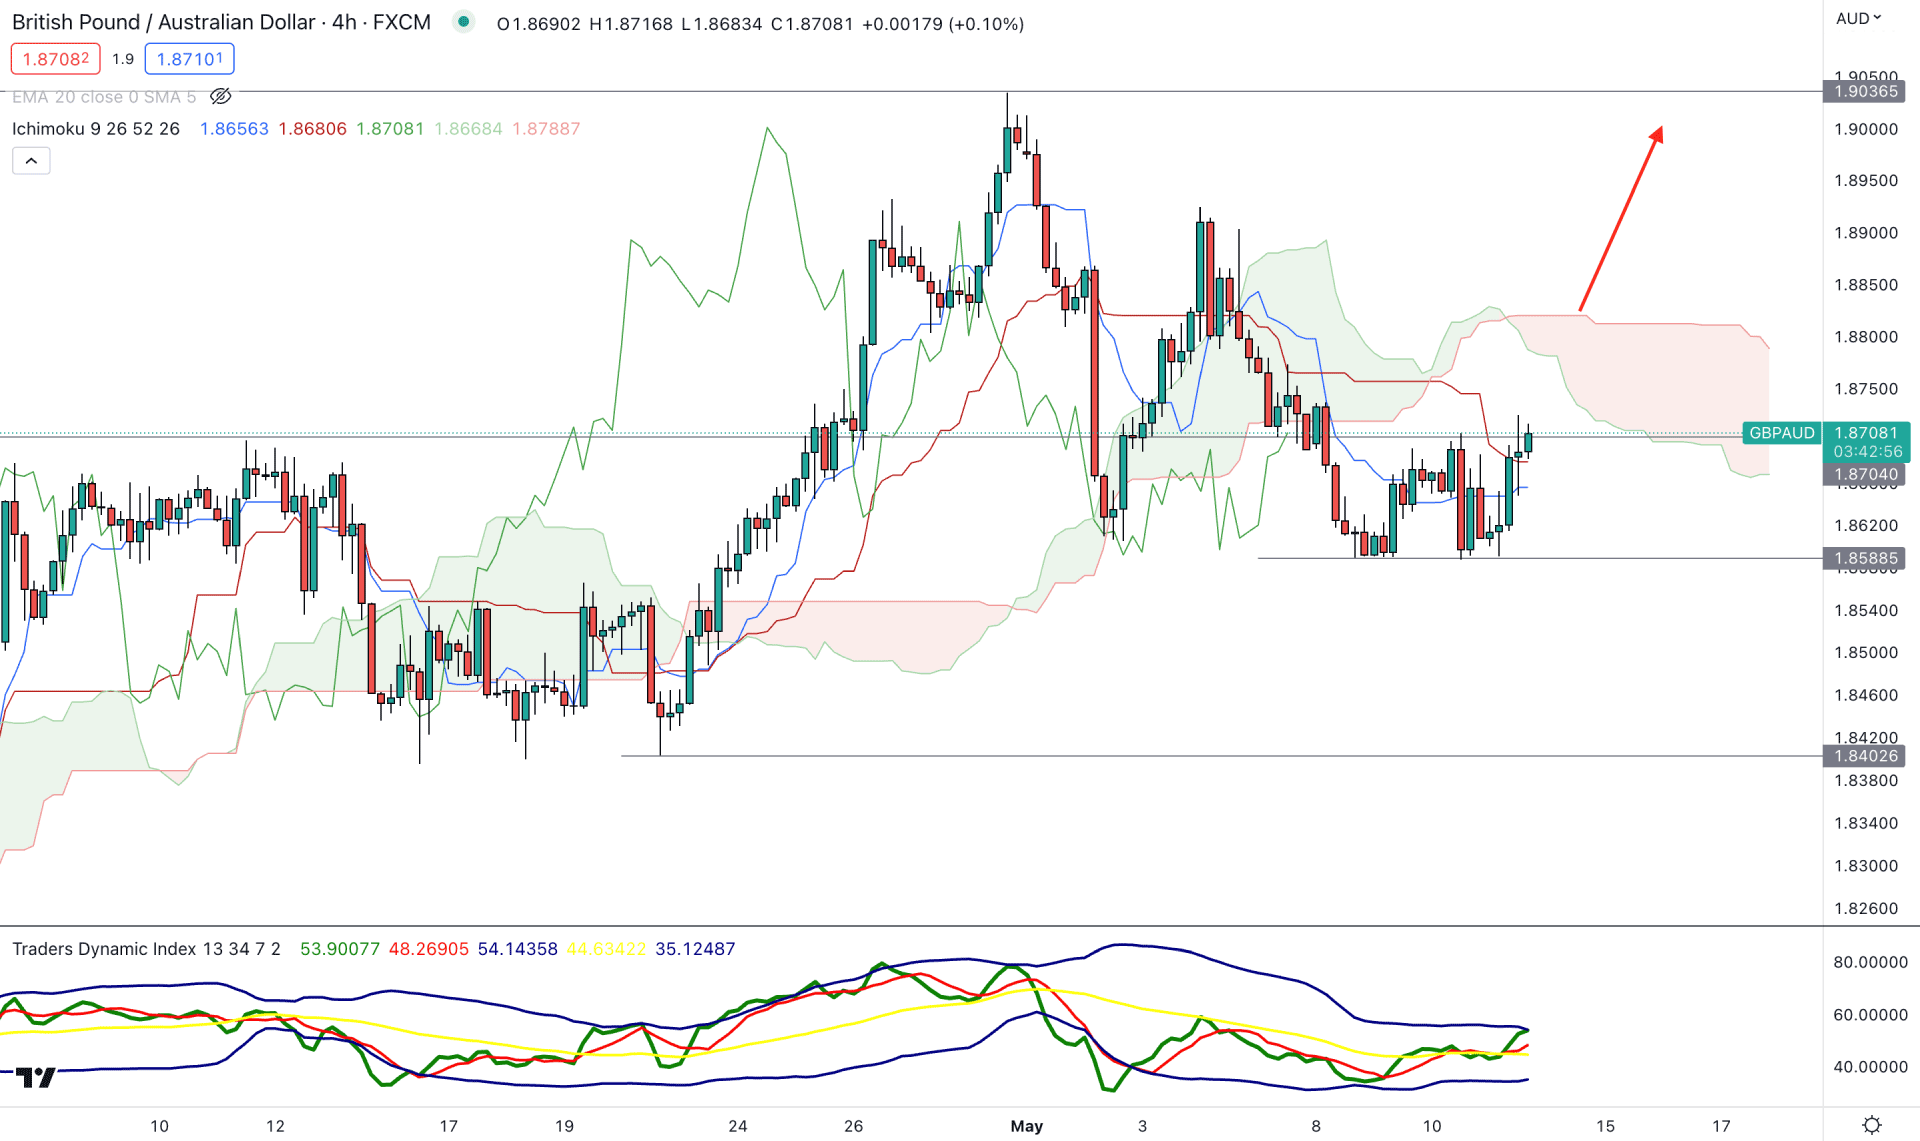
In the H4 chart, the buying pressure has faded from the strong consolidation at the current level. The price moved below the Ichimoku Cloud resistance while the current future cloud is bearish.
After making a strong bullish break, GBPAUD swung high at the 1.9035 level, from where a corrective bearish pressure came. However, the price went sideways after making a new low at the 1.8588 level. Therefore, investors might expect buying pressure in this pair as long as the 1.8588 level is protected.
In the indicator window, the current Traders Dynamic Index (TDI) is above the 50.00 line, aimed higher.
Based on the H4 structure, the bullish momentum might extend if an H4 candle closes above the 1.8800 psychological level. However, breaking below the 1.8588 level could lower the price towards the 1.8400 area.
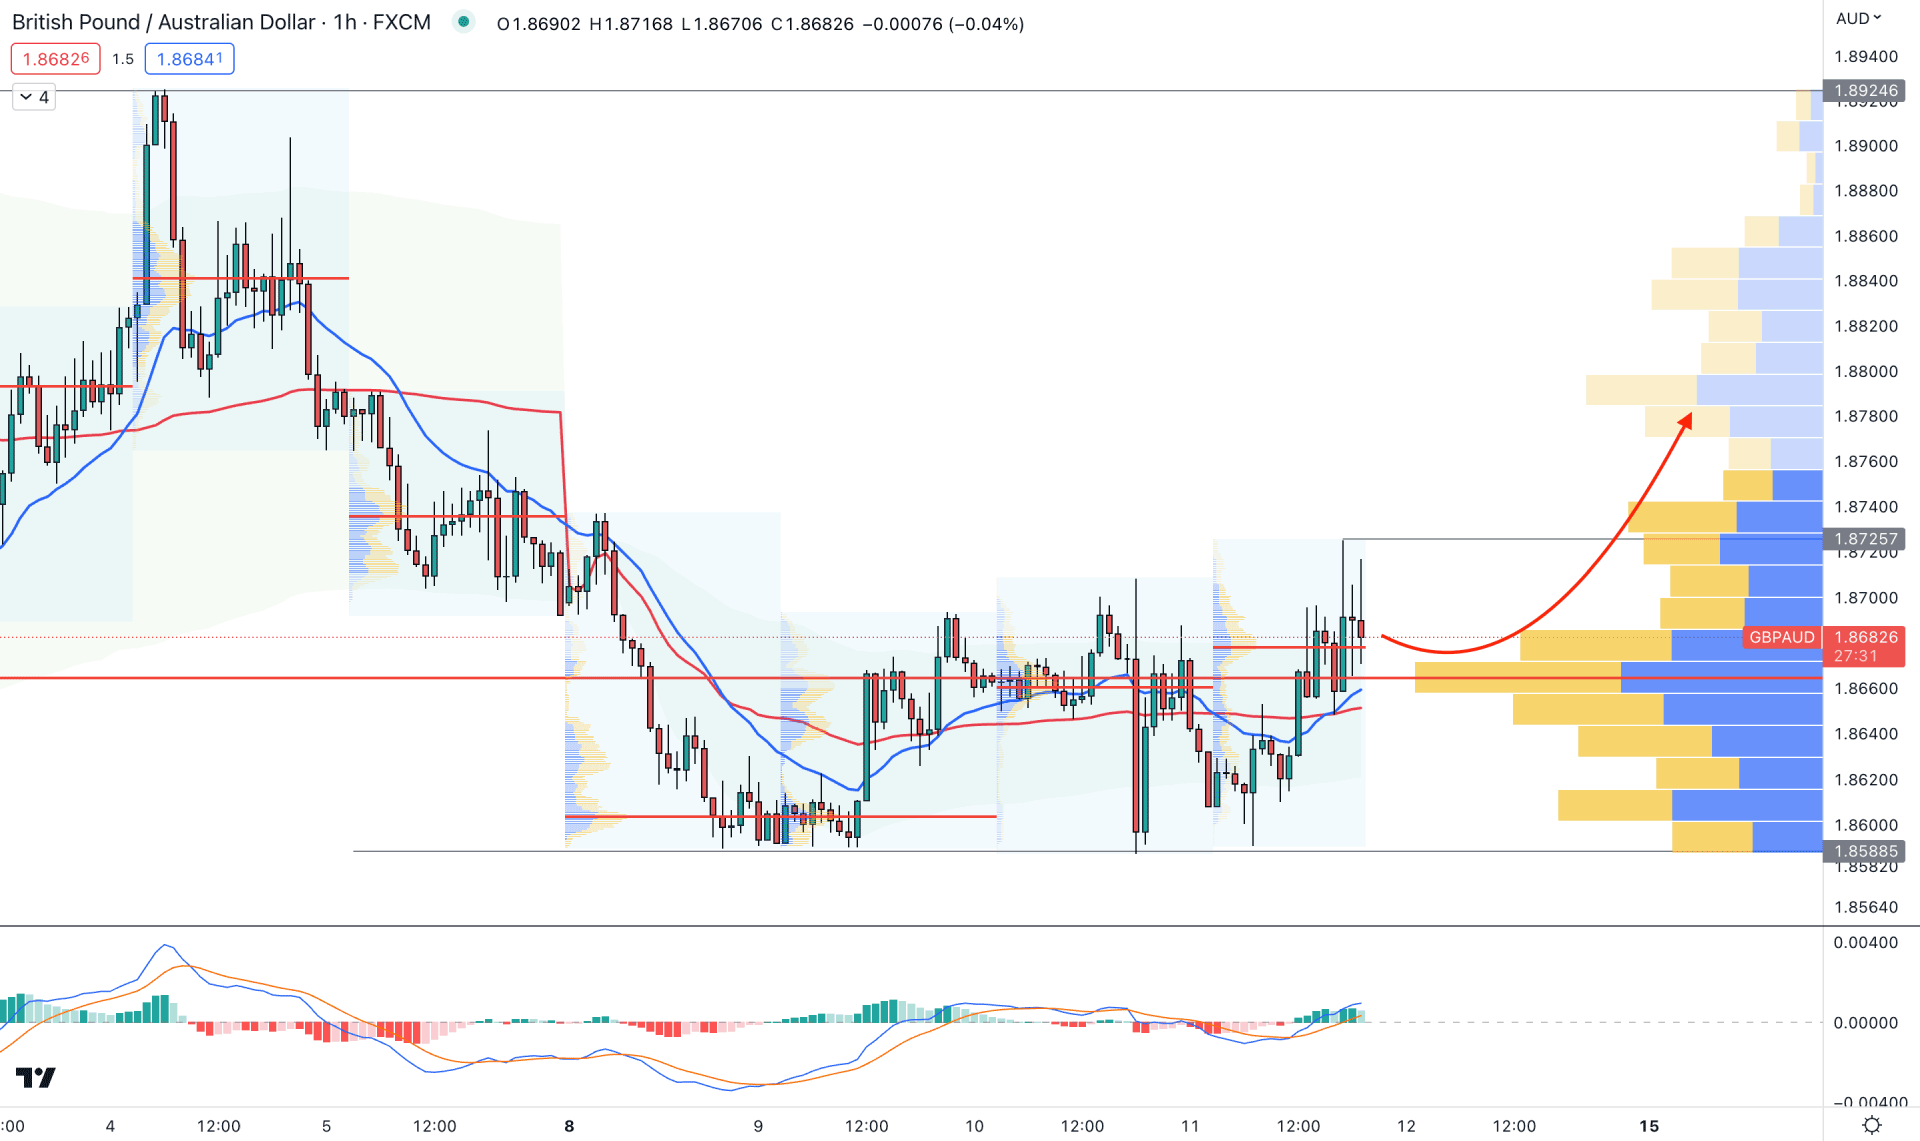
The hourly chart shows a strong consolidation on the current price, where the visible range high volume level is below it.
The indicator window shows buying pressure from the bullish Histogram, while the current 20 EMA support works as confluence support.
Based on this outlook, a bullish break above the 1.8725 level could initiate strong buying pressure in this pair toward the 1.8900 level. However, breaking below the 1.8588 level needs further bearish evidence before opening a short position.
Based on the current market outlook, GBPAUD could offer a bullish trend continuation opportunity after the intraday range breakout. Therefore, investors should closely monitor the near-term levels to find early opportunities.


