
Published: November 27th, 2020
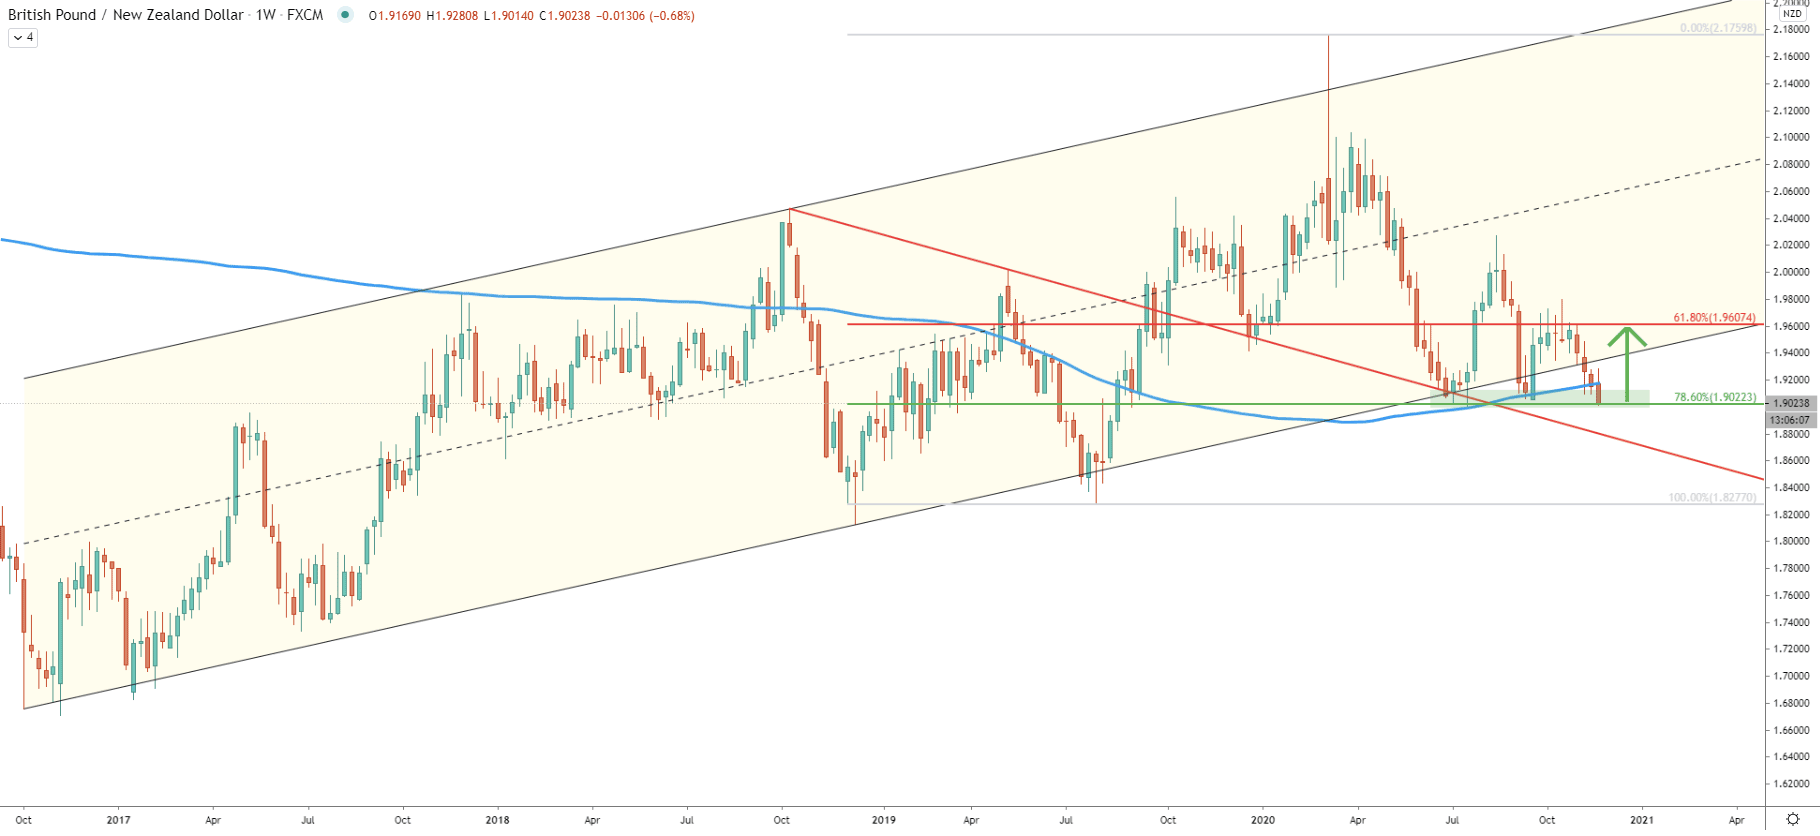
GBP/NZD overall trend is bullish, as the price continues to move within the ascending channel. Today pair could be producing a triple bottom, as it has yet again approached an extremely important support level at 1.9022. This is a 78.6% Fibonacci retracement level, which already got rejected cleanly, back in July this year. At the same time, there was a rejection of the 200 Exponential Moving Average, making the 1.9022 support level extremely attractive for buyers.
Today price could be producing yet another spike below this support although it will be important to see the price action on lower timeframes. But, if support will continue to be resected, GBP/NZD could be rising by 600 pips, because the previously formed resistance, as well as 61.8% Fibonacci, is located at 1.9600.
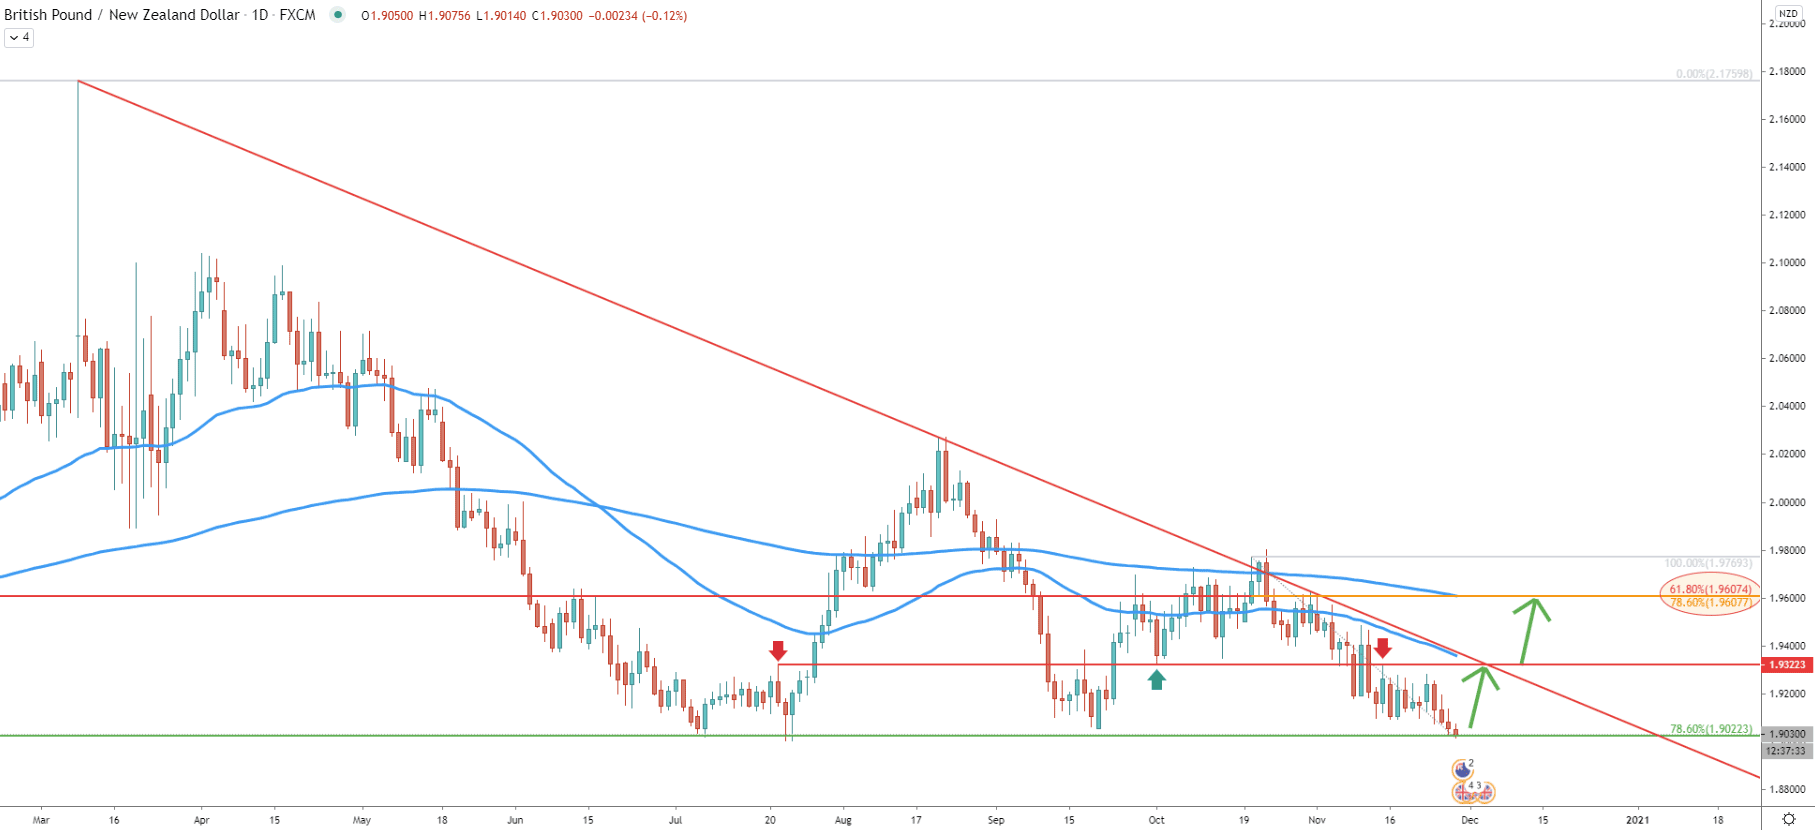
The daily chart clearly shows the formation of the triple bottom near the 1.9022 support area. If it holds, the price should be re-testing the simple downtrend trendline as well as 50 Exponential Moving Average. Both of these indicators correspond to the previously formed supply/demand level at 1.9322.
But if/when the uptrend will start and the price will break above the 1.9322 resistance, further growth should be expected towards the 1.9600 resistance. On this chart, this resistance is confirmed by 200EMA as well as two Fibs. First is 61.8% as per the weekly chart, and 78.6% Fibs applied to the last wave down, as can be seen on the chart.
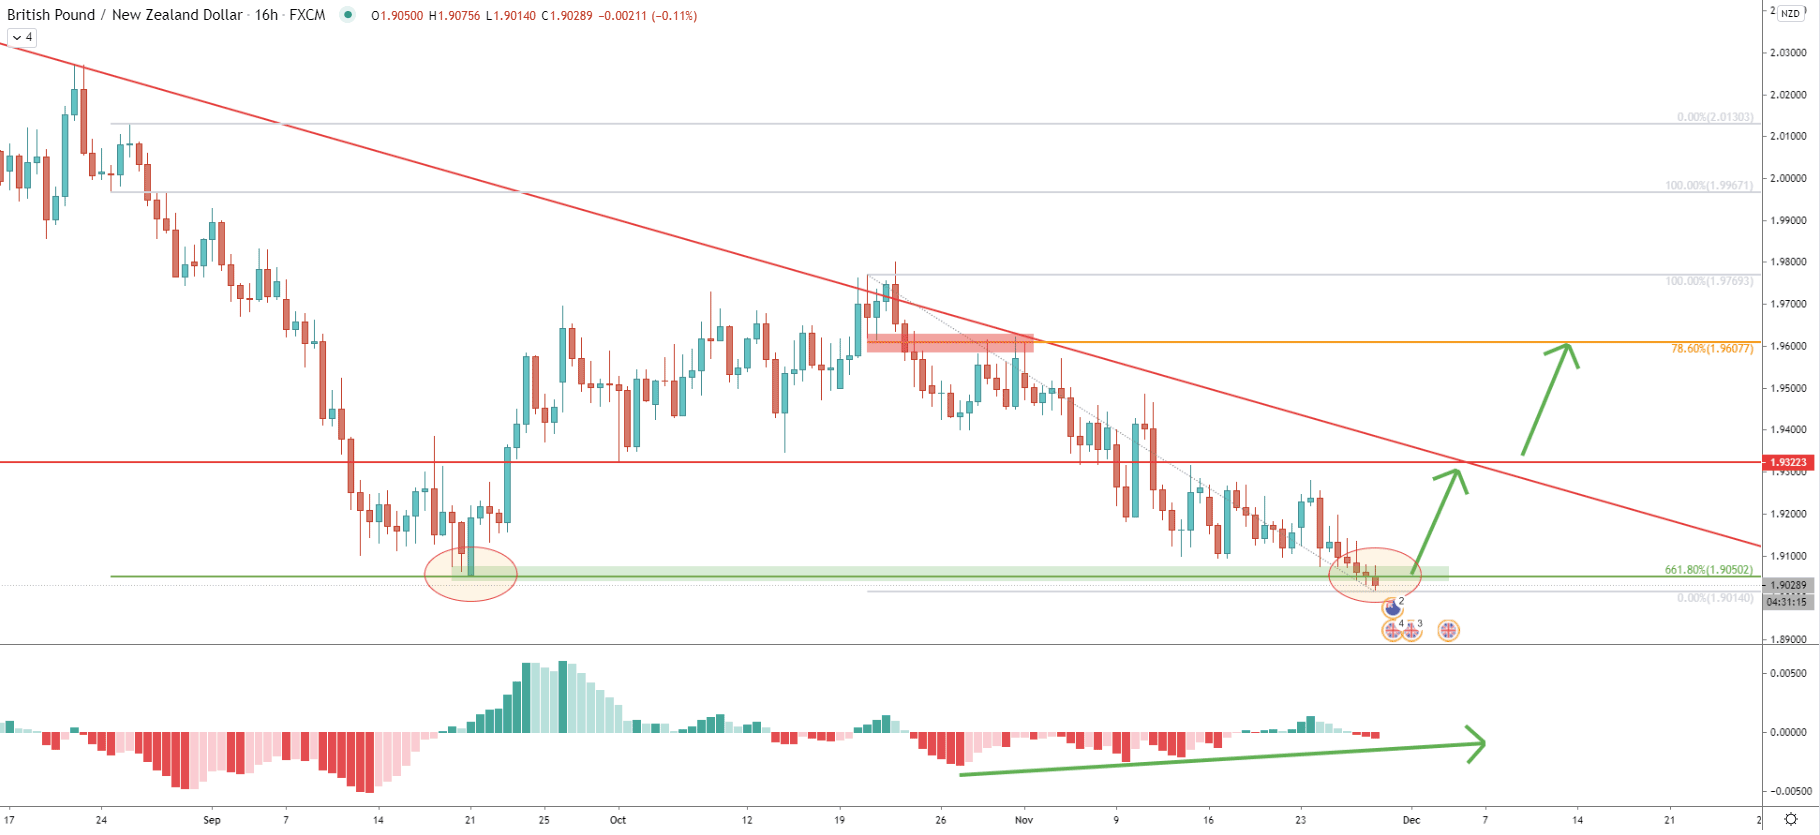
In September, GBP/NZD cleanly rejected 1.9050, which is a 661.8% Fibonacci retracement level. After over 2 months, GBP/NZD is re-testing this support level. Up until now, there was no confirmation of the break and close below, which still suggests the validity of this demand level. At the same time, the MACD oscillator is now forming a bullish divergence, which might imply that the trend is about to reverse to the upside.
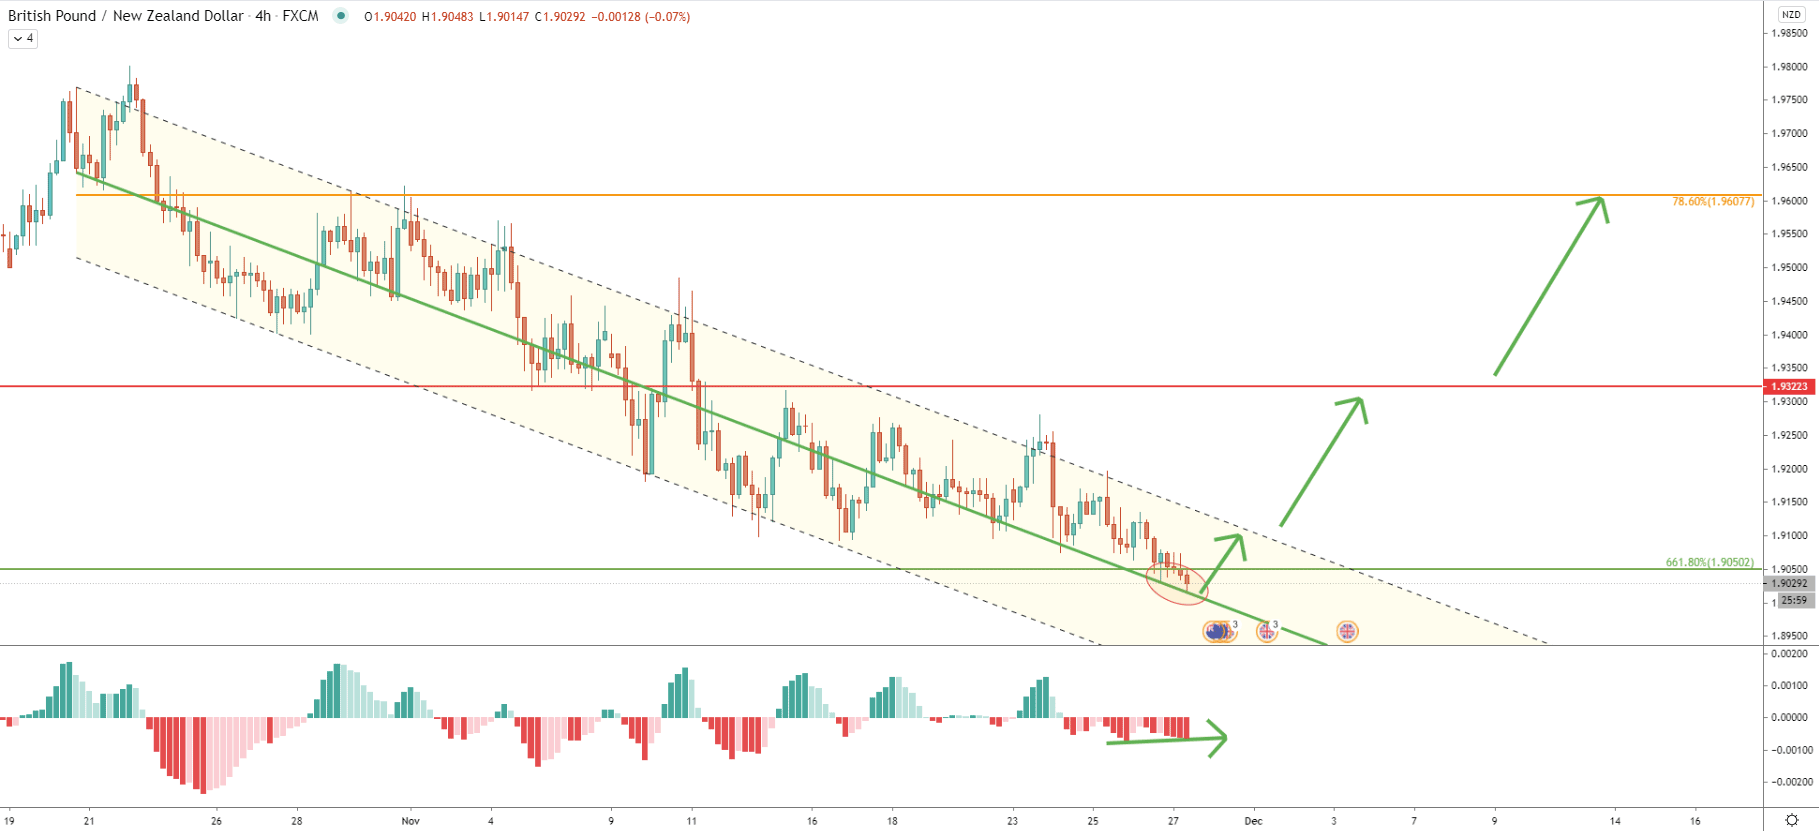
Since October 20, GBP/NZD has been consistently declining while moving within the descending channel. But throughout this week, there were two bounces off the middle trendline of the channel. Same as on the 16-hour chart, on the 4-hour chart the MACD is forming a bullish divergence, yet again suggesting a potential trend reversal.
The nearest obstacle for GBP/NZD, if an uptrend starts, will be the upper trendline of the descending channel. Perhaps only upon a break above the channel, strong bullish sentiment could be confirmed. And only than the 600 pip upside potential will become highly probable.
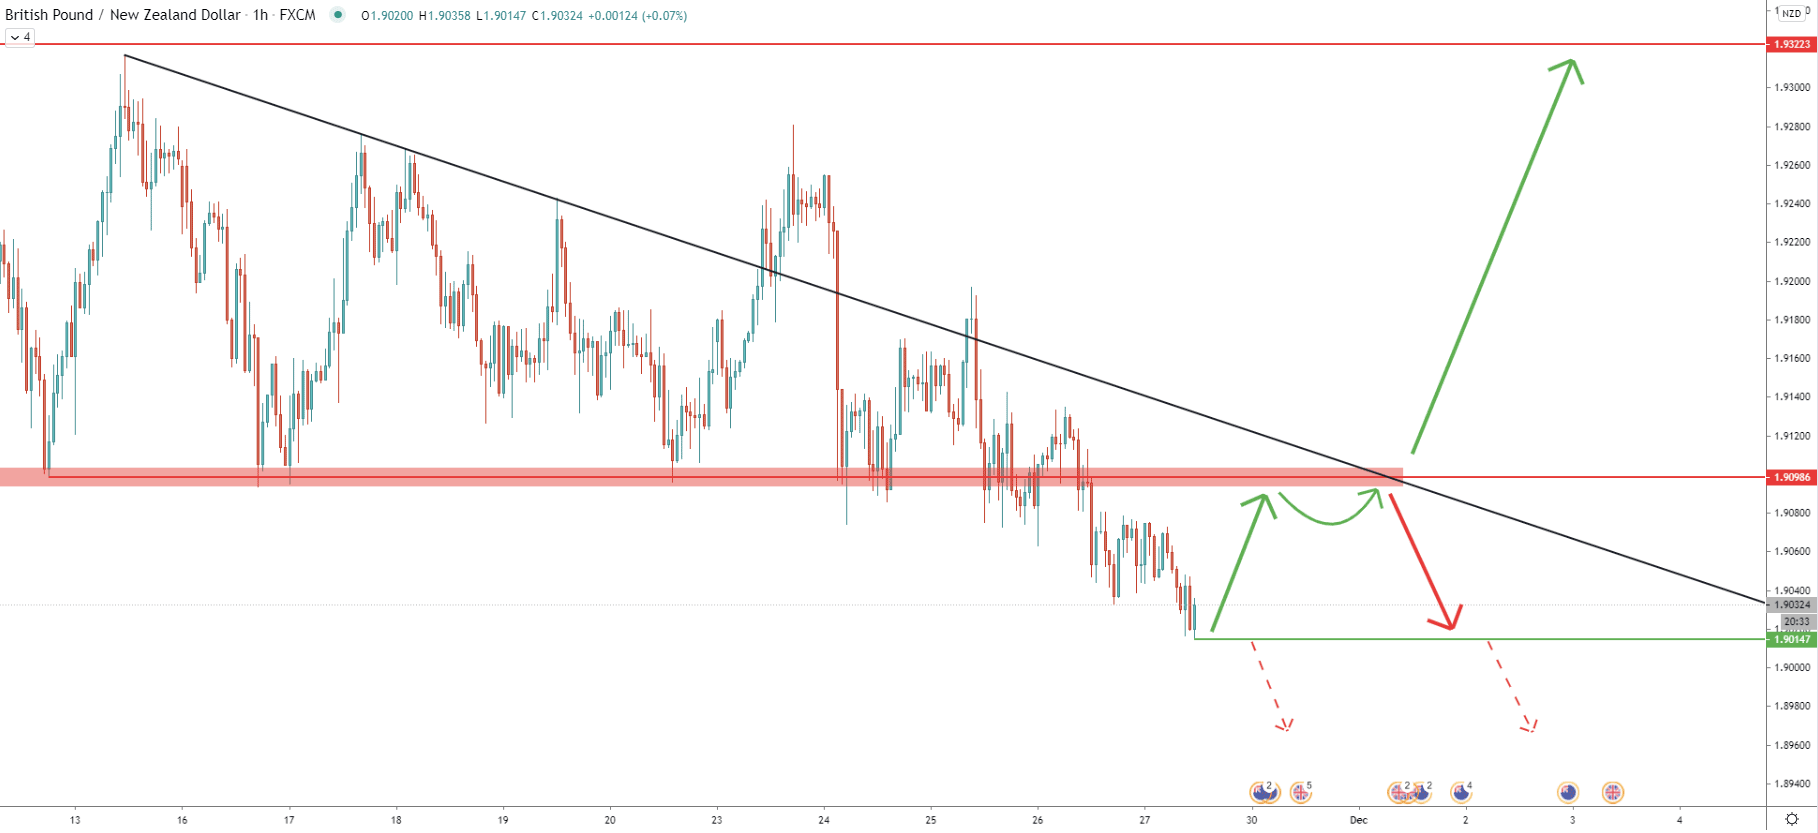
The nearest resistance to watch could be 1.9100 psychological level, which goes in line with the channel resistance as per the 4-hour chart. But right now GBP/NZD is very close to 1.9000 psychological support, and it is extremely important that the daily close will remain above this critical level. Perhaps today’s’ daily closing price could give more confidence about the potential uptrend or confirm further price decline, depending on the closing price.
GBP/NZD has approached a key support area, which is near 1.9000. It will either produce a triple bottom and reverse to the upside, or the downtrend will continue. Perhaps the time has come to find out where the price could be heading in the next couple of weeks or even months.
As per the daily chart, there are two key resistance levels to watch. The first is based on the supply/demand formed previously and is located at 1.9322. The second, based on two Fibonacci retracement levels are located at 1.9600 and should be considered as the final upside target for the potentially incoming uptrend.
Daily break and close below 1.9000 psychological support, will invalidate bullish scenario. If/when the breakout occurs, GBP/NZD long term downtrend should be expected to continue for the months to come.
Support: 1.9000, 1.9022
Resistance: 1.9100, 1.9322, 1.9600