
Published: January 15th, 2021
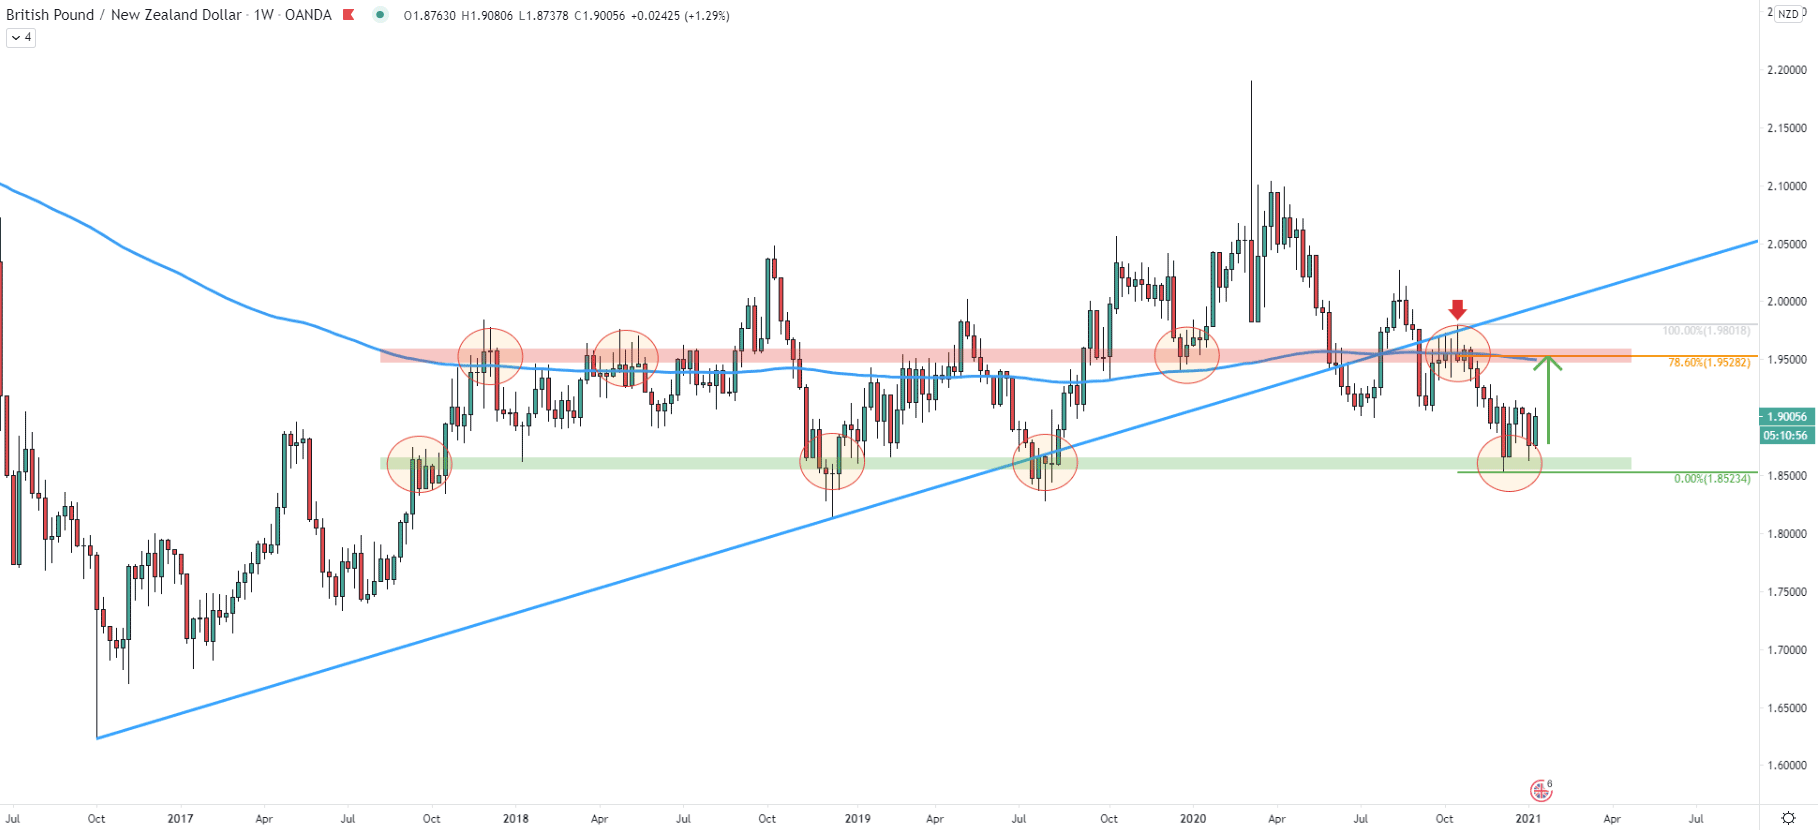
There is still some uncertainly about the GBP/NZD long-term trend perspective as right now the price seems to be stuck between the support and resistance area. The resistance can be spotted near 1.9528, which is the level where price first rejected the 200 Exponential Moving Average at the end of 2018. On the other side, the support is located near the 1.8500 psychological level, which along with the resistance area was rejected multiple times during the past 3 years.
At the same time, GBP/NZD broke below the downtrend trendline, and the sentiment seems to become bearish, but the rejection of the support doesn’t allow to be confident in a further price decline. Considering that the 1.8500 support area is being rejected for the 3rd consecutive time, it would be reasonable to assume that bull remains in control, at least in the medium term. For this reason, the price can be expected to move up once again, in order to test the 1.9528 resistance area, before/if a downtrend will take place.
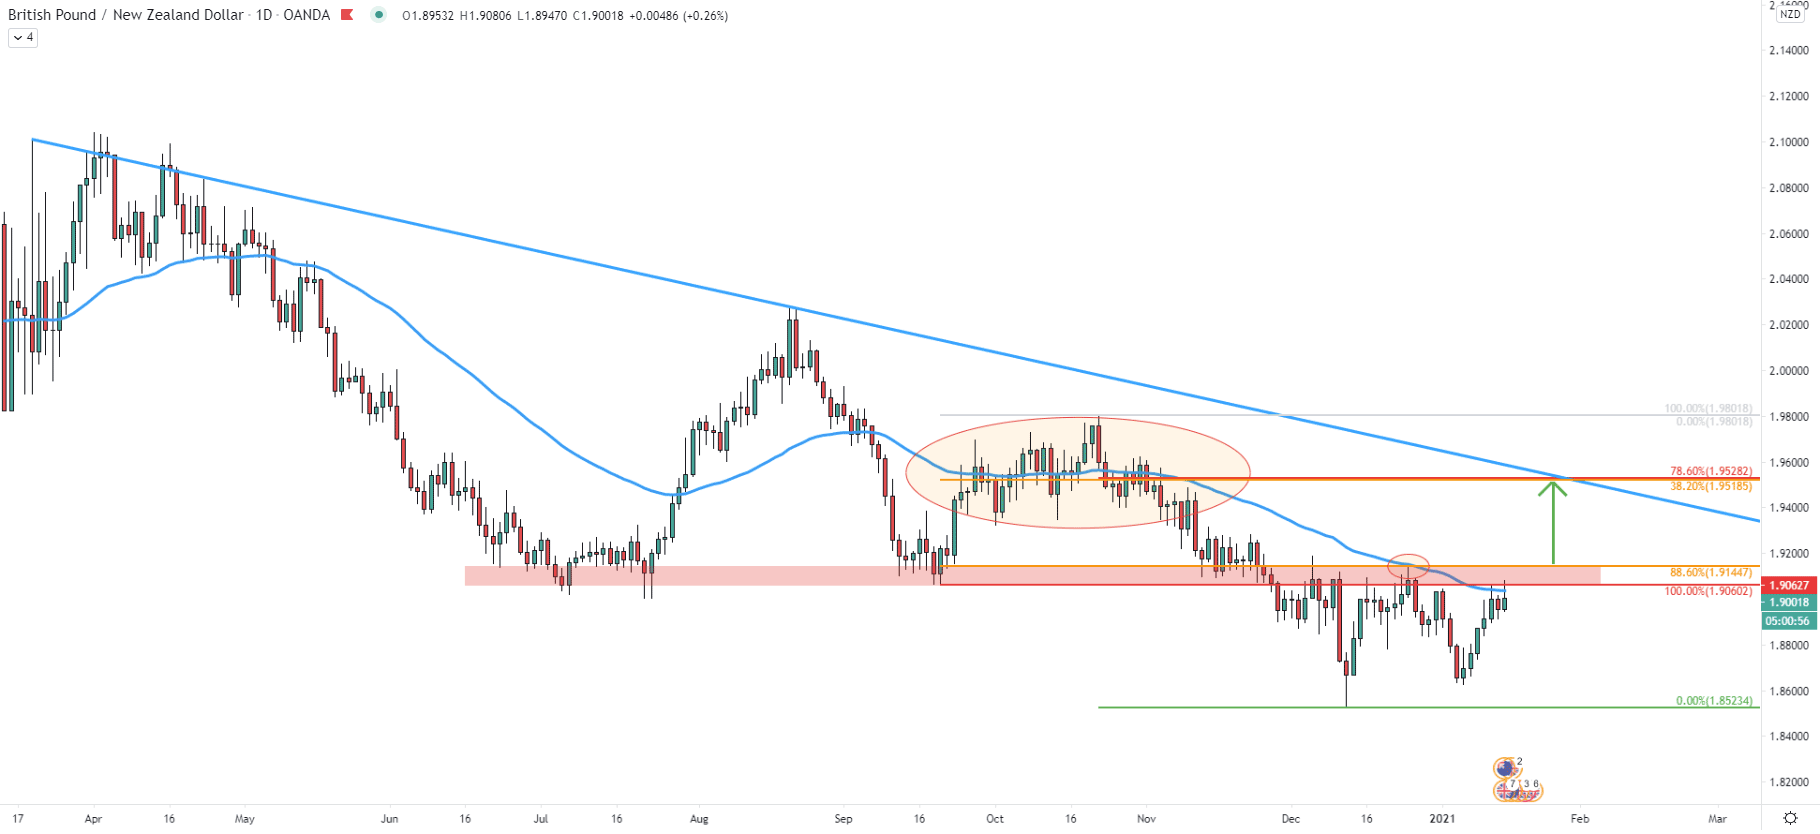
On the daily chart GBP/NZD continues to trade below the downtrend trendline. A few weeks ago, GBP/NZD has reached and rejected cleanly the 50 Simple Moving Average as well as 80% Fibonacci retracement level applied to the previous corrective wave up. After this, the price went down, but failed to produce a new lower low. Today GBP/NZD is attempting to break above the 50 EMA once again and for bulls, it could be very important that price will break above the EMA, as well as the 1.9144 resistance level.
In the scenario of the break to the upside, bing power is likely to increase substantially, and this might result in an immediate growth of the GBP/NZD exchange rate. The price can be expected to rise towards the 1.9500 psychological resistance, which corresponds to 78.6% as well as 38.2% Fibonacci retracement level as can be seen on the chart.
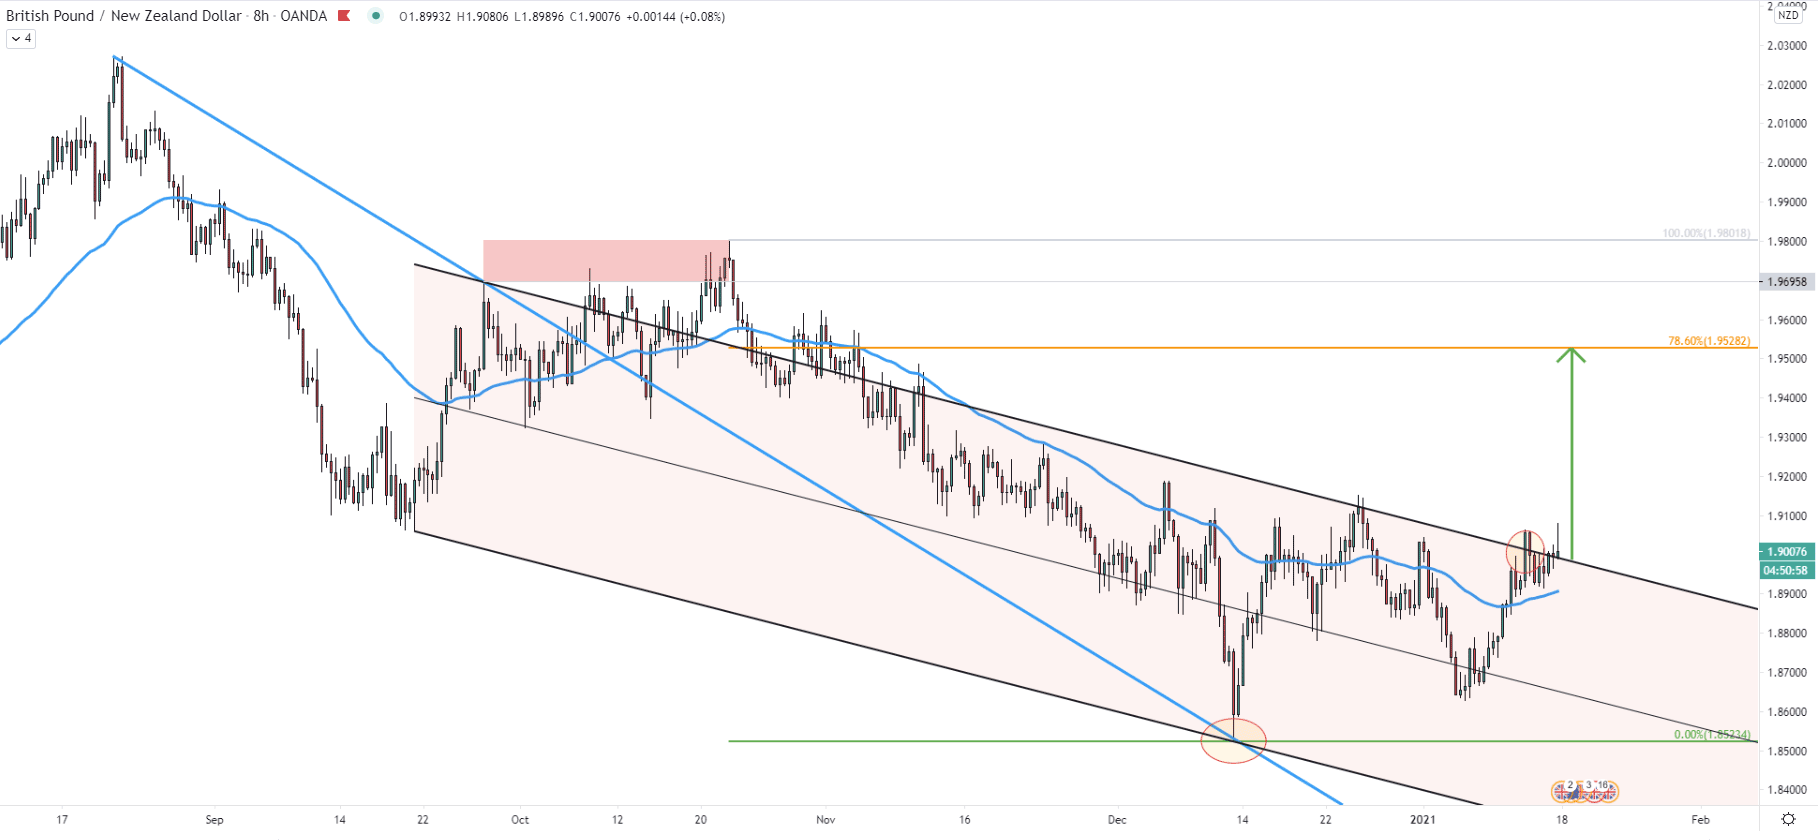
In the middle of December 2020, GBP/NZD has reached and cleanly bounced off the downtrend trendline, which acted as the support. Then the price went up and this week broke above the descending channel. It could be the first confirmation that the short-term trend is about to turn bullish, but as usual, the consolidation phase might take place prior to a further price increase.
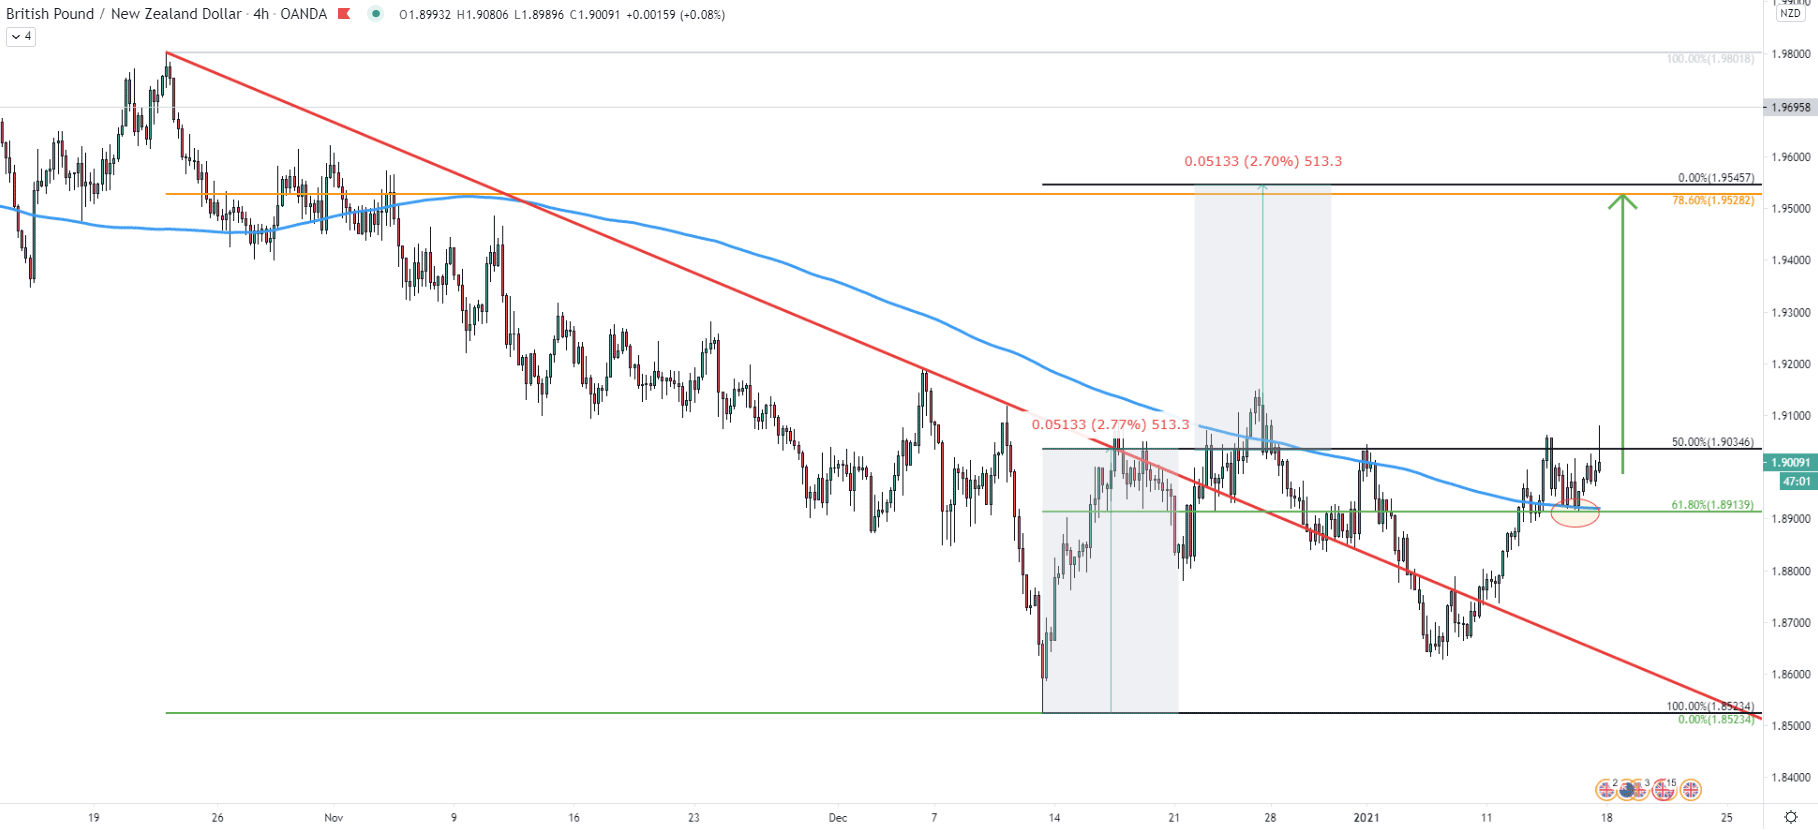
On the 4-hour chart, the pair broke above the downtrend trendline, followed by the 200 EMA breakout, suggesting the potential trend reversal to the upside. During the past several days, the price has been bouncing off the 200 EMA, which clearly is acting as the support right now. Along with it, 61.8% Fibs at 1.8914 was rejecting, increasing the probability of an upside move. The Fibonacci was applied to the trendline breakout point, and it shows not only that 61.8% is being the support, but also that 0% Fibs can be the final upside target. The 0% Fibs almost exactly corresponds to the previously discuss final resistance, making 1.9530 a strong supply area.
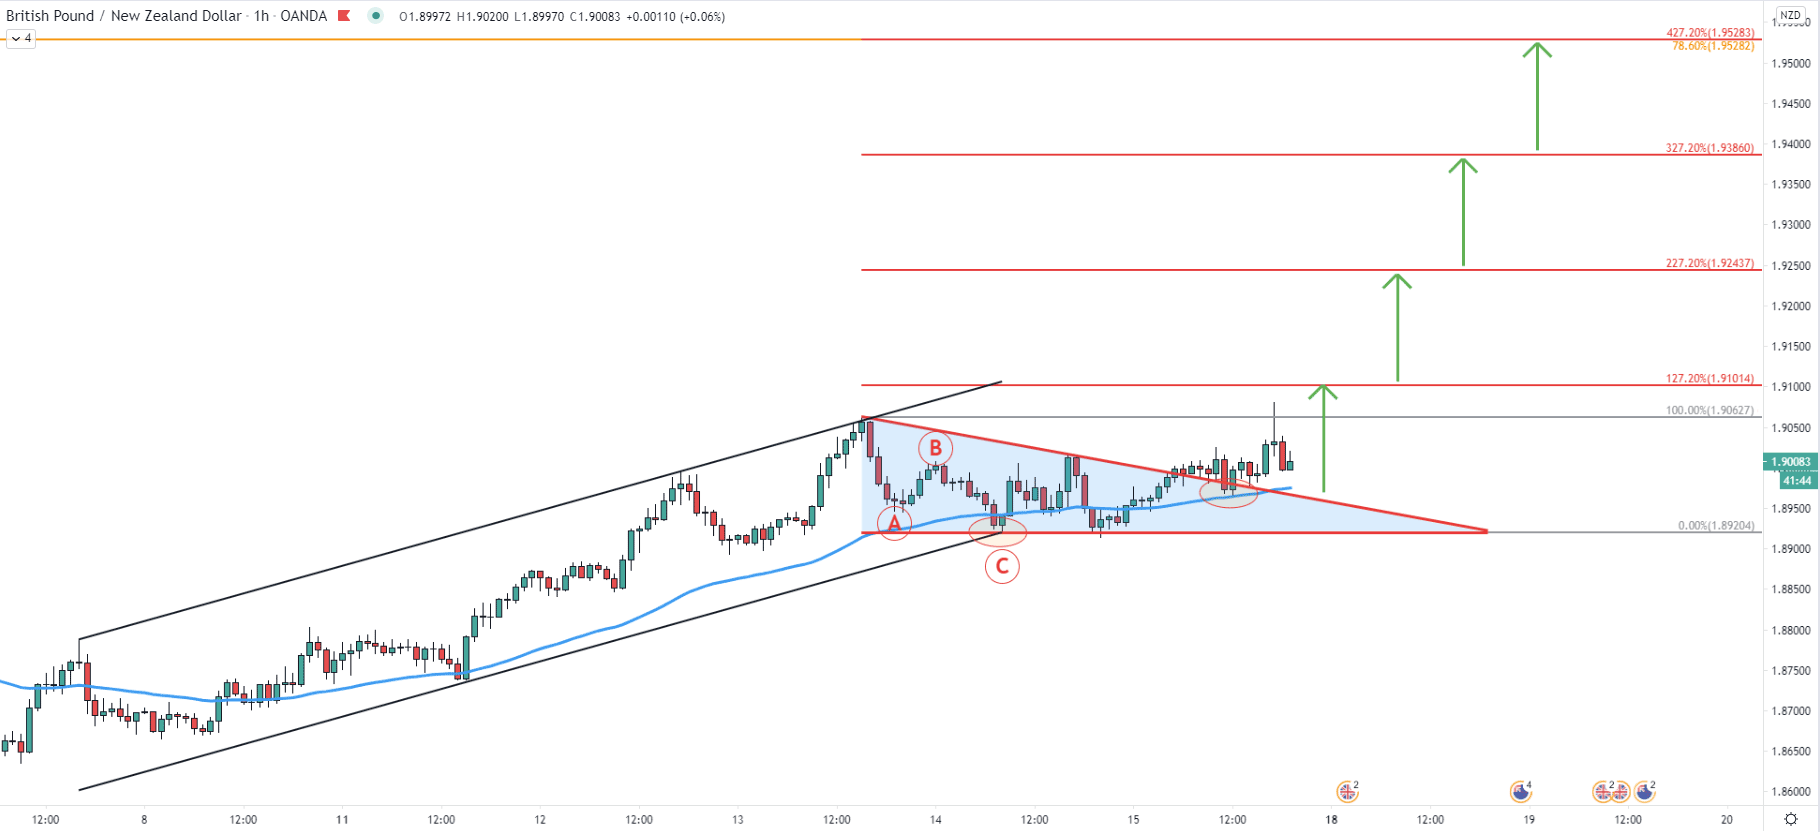
On the hourly chart, the price has bounced off the bottom of the ascending channel, validating the uptrend. At the time of a bounce, GBP/NZD could have formed an ABC correction pattern based on the Eliot Wave theory. Moreover, the triangle pattern has been formed and got broken to the upside today. After the breakout, the price corrected down, and reject the downtrend trendline of the triangle as well as 50 Simple Moving Average.
Righ now, higher highs and higher lows pattern is in place, and as long as the 1.8920 support area is being respected, the uptrend can be expected to continue. Fibonacci applied to the ABC correction, shows that there could be several resistance levels to consider. But most importantly, is that 1.9528 resistance now corresponds to 78.6% and 427.2% retracement levels.
On the higher timeframes, it can be seen that GBP/NZD remains between the support and resistance area. Recently price bounced off the support, and lower timeframe analysis shows us that the probability is currently in favor of the uptrend, in the short to medium term.
As per the weekly, daily, 4-hour, and 1-hour chart, there is once key resistance confirmed by 4 different Fibonacci retracement levels. It is located near 1.9530, suggesting the potential price increase by over 500 pips.
As per the 4-hour chart, the key local support is located at 1.8914. 1-hour and/or 4-hour close below this support level will immediately invalidate the bullish outlook. In that case, sellers are likely to step in, sending the price towards 1.8500 support.
Support: 1.8914, 1.8523
Resistance: 1.9100, 1.9144, 1.9243, 1.9386, 1.9538


