
Published: December 23rd, 2020
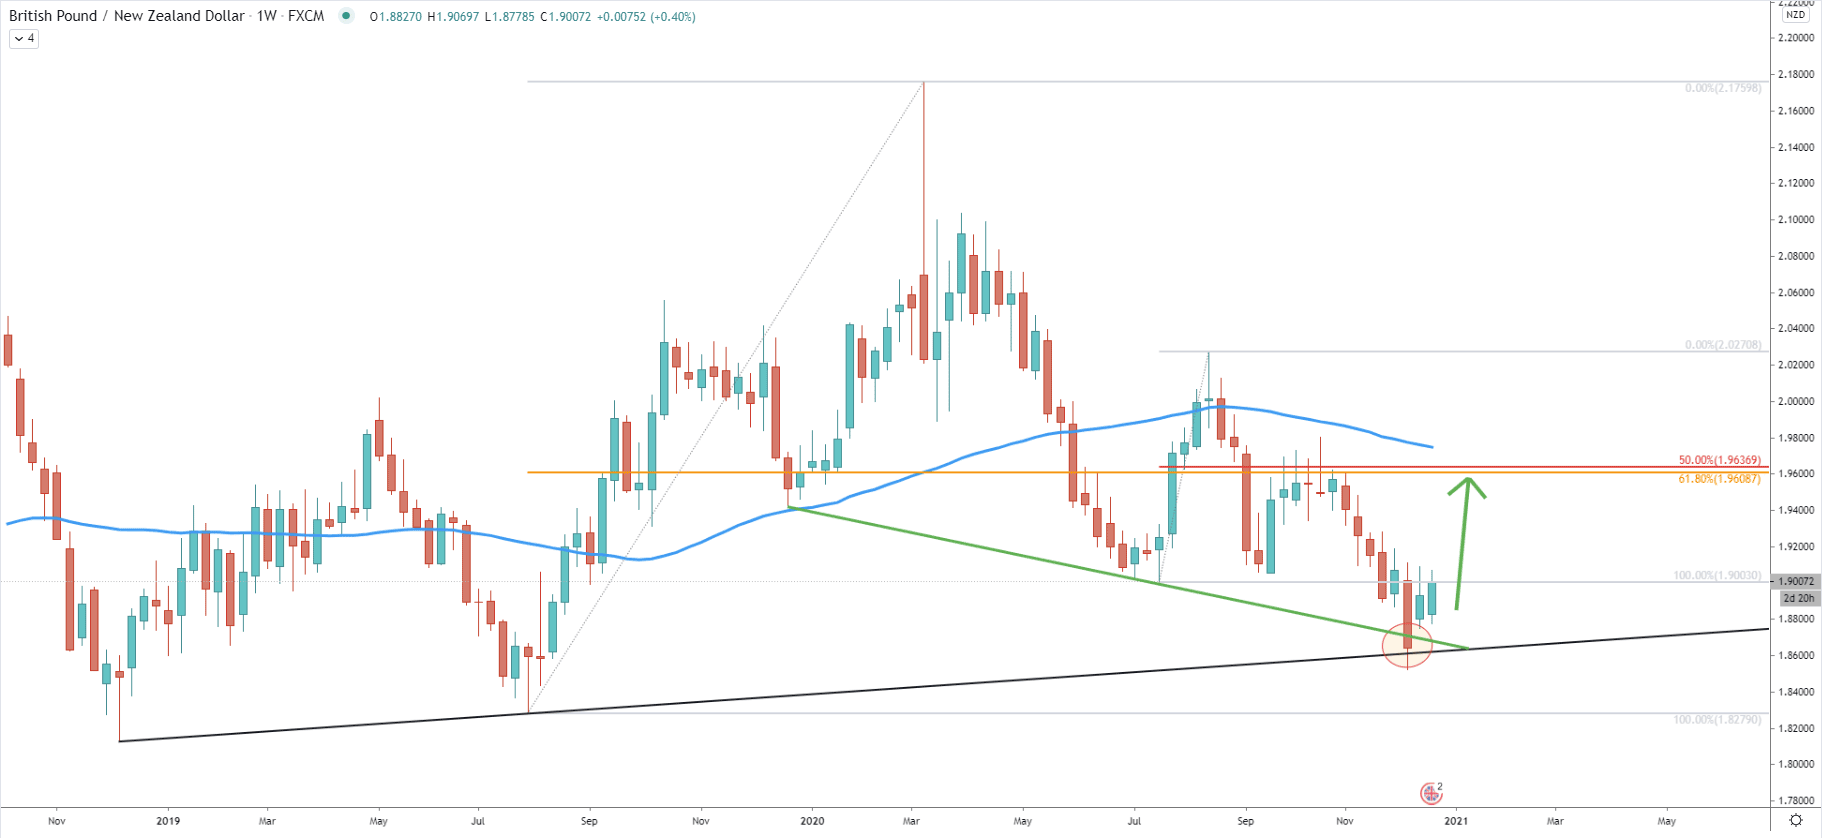
GBP/NZD has been trending down since the beginning of the year when the price topped out at 2.1760. Throughout the year the price has fallen by nearly 15%, which equals a 3236 pip drop. In the first week of this month, GBP/NZD could have finally formed the bottom while testing 1.8523 low. At this time there was a rejection of the two trendlines. The first was the simple uptrend trendline and the second was the support downtrend trendline.
This clearly is a strong demand zone as the price has managed to recover quite fast during the past few weeks. It might be reasonable to assume that the price will continue the recovery or the correctional phase, which might bring the price towards the 1.9600 resistance area. This resistance is confirmed by two Fibonacci retracement levels, these are 61.8% and 50% Fibs as can be seen on the chart. At the same time, the resistance goes in line with the 200 Simple Moving Average, which most likely will also be considered as a potential resistance when/if tested.
On the daily chart, GBP/NZD is forming a wedge pattern and right now price could be preparing to move toward the top of it. It can be seen that on this chart, there was no daily break and close below the support downtrend trendline, which increases the probability of a correctional upside move. The previously mentioned resistance near the 1.9600 psychological level is confirmed by the 200 Simple Moving Average, which goes in line with the downtrend trenldine or the top of the wedge. Also, 1.9600 previously also acted as the supply zone, and back in October, there were multiple rejections of this area, along with the 50 SMA.
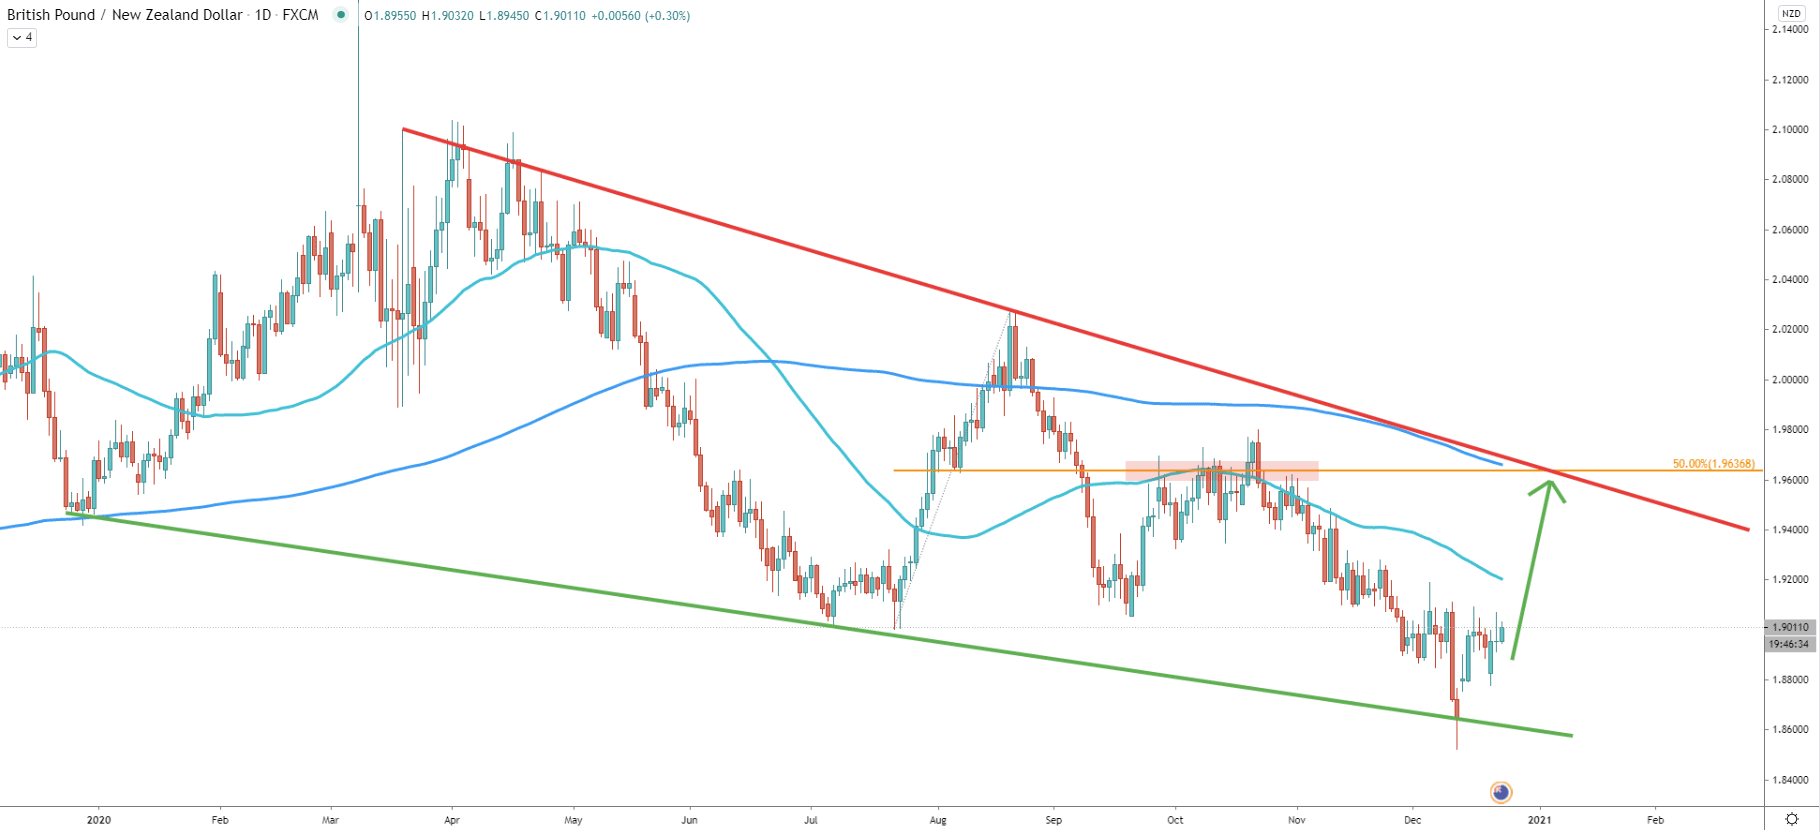
While the correction up is expected, the price still remains within the descending channel, validating the long-term downtrend. Nonetheless, recently price broke above the 50 SMA as well as the simple uptrend trenldine, suggesting an incoming upside pressure. After the break above the SMA and the trendline, correction down followed, and GBP/NZD rejected cleanly the 38.2% Fibonacci retracement level at 1.8770. Perhaps this price has become a key support level and as long as GBP/NZD remains above it, the short to medium-term uptrend should be expected.
On this chart, the resistance near 1.9600 is confirmed by yet another Fibonacci retracement level. This Fibs was applied to the previous corrective move up, which occurred back in September. It shows that 23.6% Fibs at 1.9625 almost exactly corresponds to the 50% Fibs at 1.9636
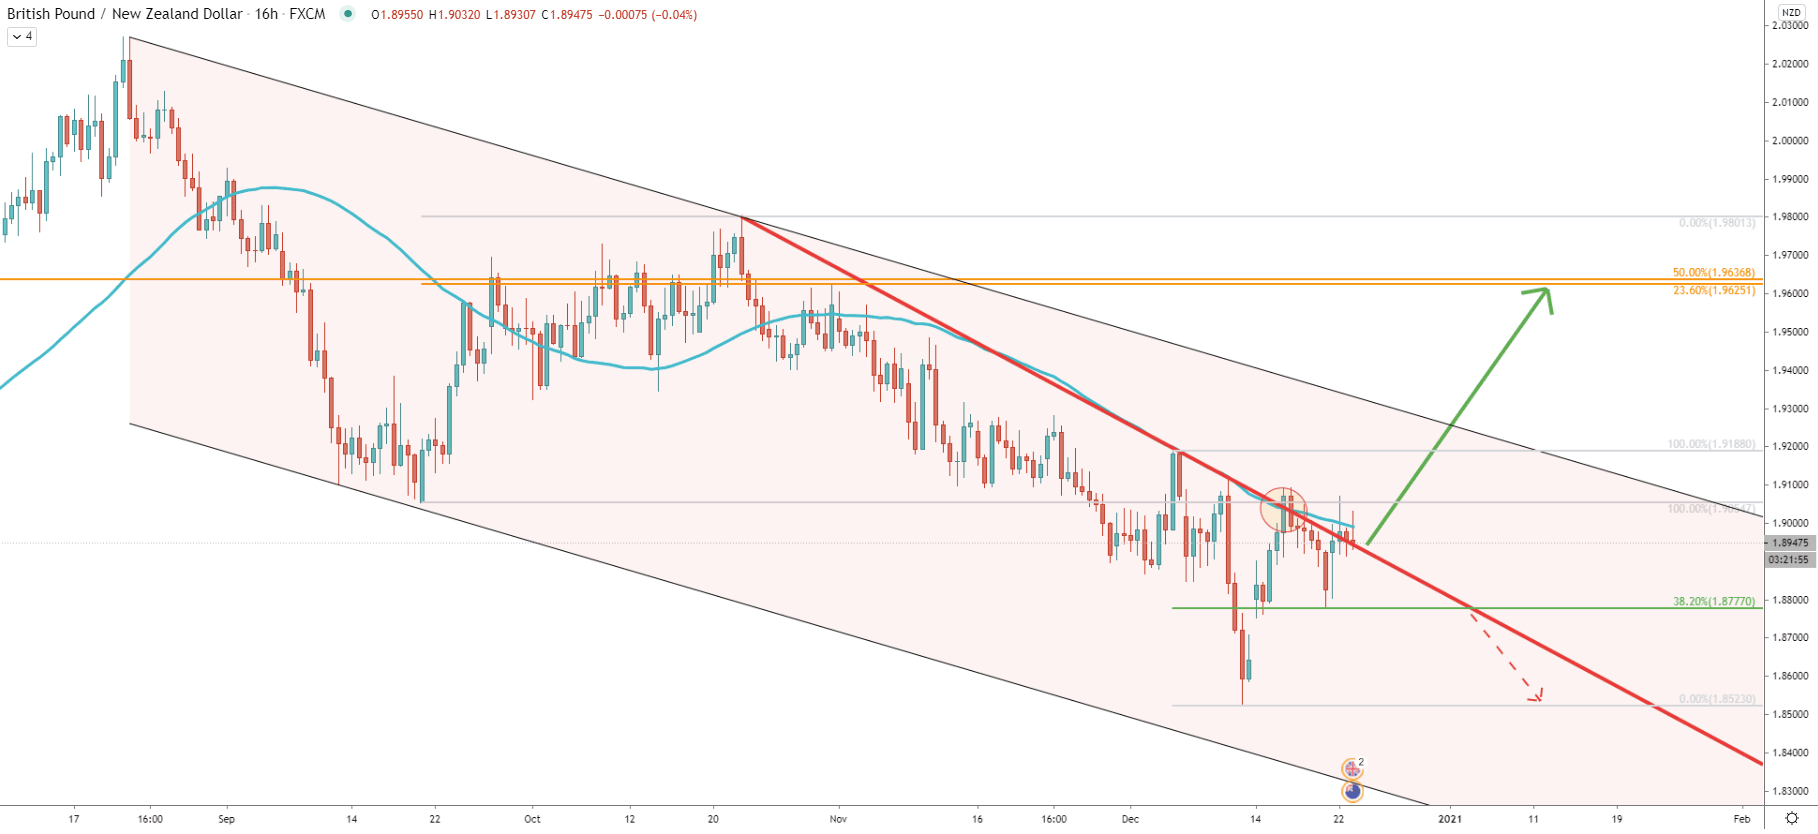
By looking at the 4-hour chart, it can be seen that yet another descending channel has been formed and got broken. On December 16, there was a clear rejection of the upper trendline of the extended descending channel, where price also rejected the 200 Simple Moving Average. This goes to show, that 1.9100 is an extremely strong supply area, which is being respected still.
On the other hand, the local support has been formed at 1.8920, where price rejected the 50 Simple Moving Average. Right now GBP/NZD could be stuck between 1.8920 support and 1.9100 resistance. Perhaps traders would be waiting for a breakout, either to the upside or the downside. Break to the upside is likely to trigger a strong buying pressure, which the next key resistance is 600 pips away. But, a break to the downside, most likely will result in a re-test of the 1.8780 support area, before/if the uptrend continues.
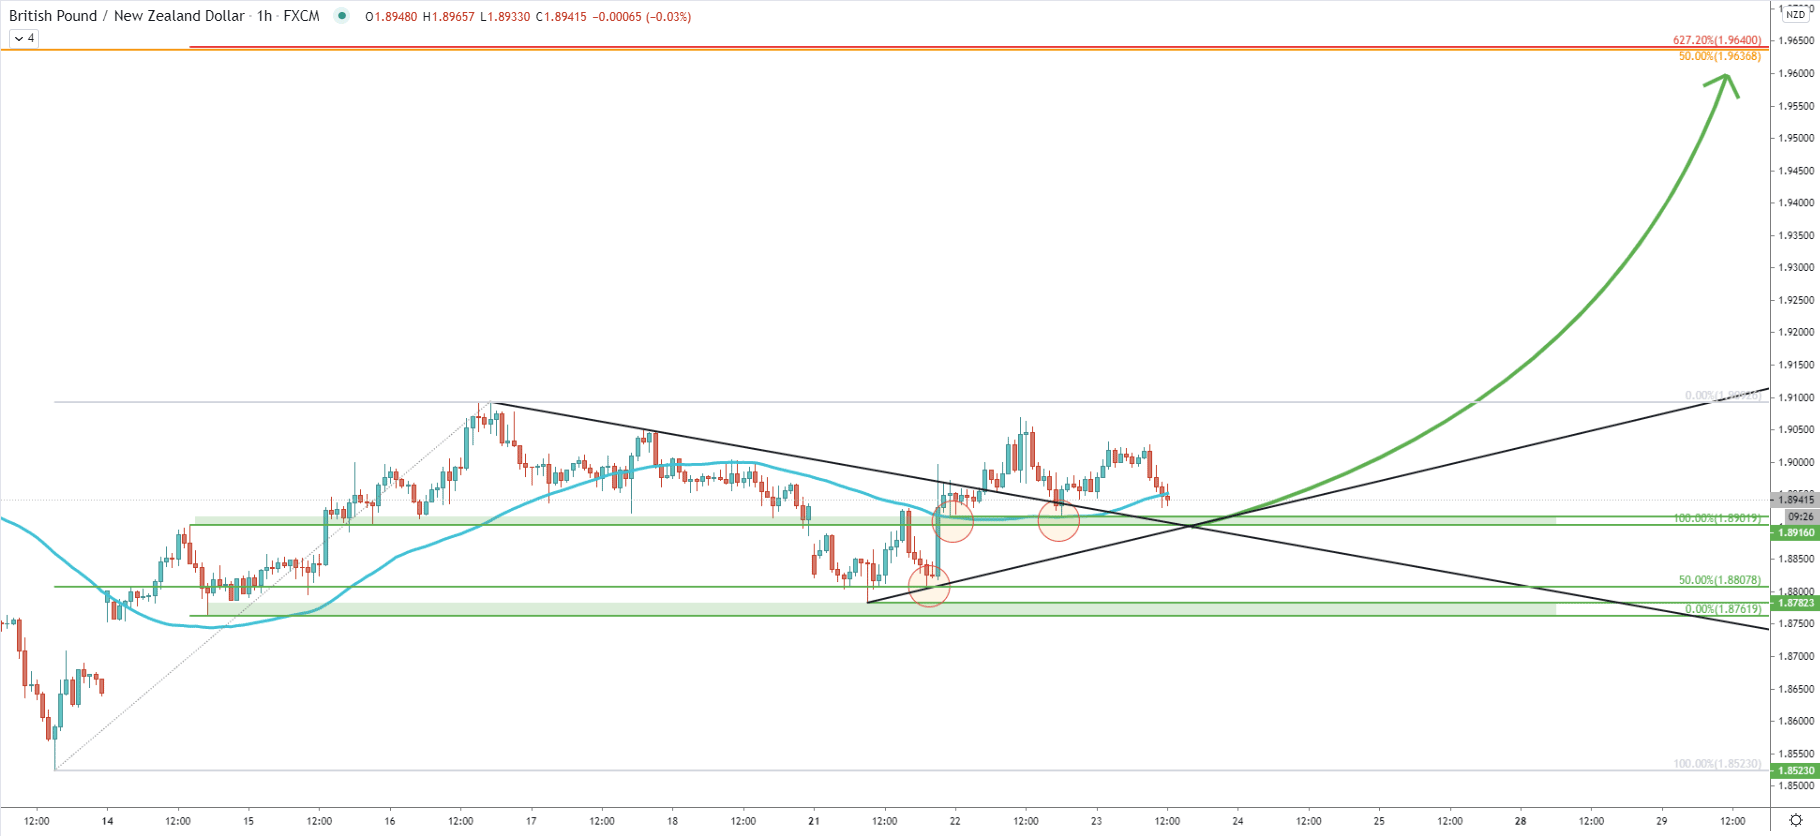
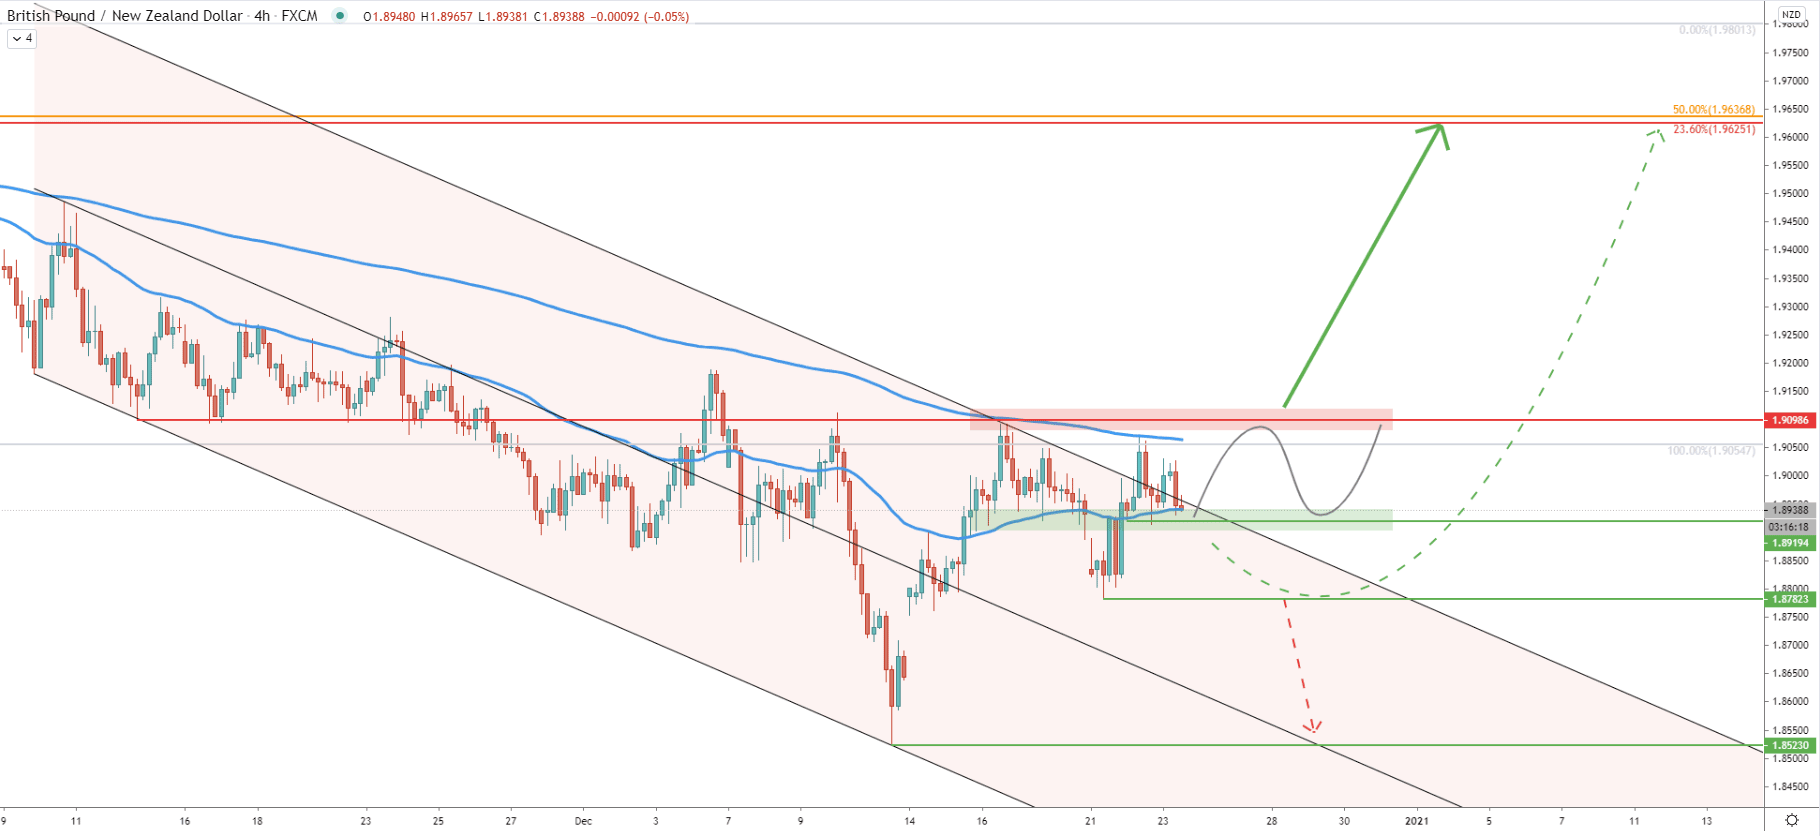
It can be seen that GBP/NZD cleanly rejected the 50% Fibs at 1.8807 on December 21. Then the price went up and broke above the 50 SMA along with the downtrend trenldine. After the breakout, a pullback followed and the price has formed the support area near the 1.8900 psychological level. There were at least 2 rejections of the 50 EMA and perhaps right now we are witnessing the third one.
1.8900 could be a very important level for buyers and GBP/NZD might move lower to test it once again. If that will be the case, the downtrend trendline, which got broken, could be acting as the support, along with the simple uptrend trenldine. And if this support holds, buyers are likely to step in, and the new higher high should be produced as soon as the end of this week.
Finally, it is worth mentioning that on this chart, the 1.6930 resistance area is now confirmed by yet another Fibonacci retracement level. This is 627.2% Fibs applied to the corrective move down after the price broke above the 50 SMA back on December 14. It makes 1.9600 - 1.9640 and an extremely strong supply zone, where buyers are likely to fix the profit if the uptrend will take place.
GBP/NZD could have bottomed out, while first signs of a potential trend reversal are being produced on multiple timeframes. Nonetheless, the price is currently stuck between the support and resistance, and only upon the break above the resistance, the 600 upside growth potential will be presented.
As per the weekly, 16-hour, 4-hour, and 1-hour chart, the key resistance area is located between 1.9600 and 1.9640. This supply zone is confirmed by 4 different Fibonacci retracement levels, making it an extremely important price rage.
As per the 4-hour chart, only a break below the 1.8780 support area, with a daily break and close lower, will invalidate the bullish forecast and the expected upside correction. In this case, the downtrend continuation is likely to take place and GBP/NZD should be expected to decline at least towards the previously established low at 1.8523
Support: 1.8920, 1.8780 1.8520
Resistance: 1.9100, 1.9600, 1.9640


