
Published: March 1st, 2021
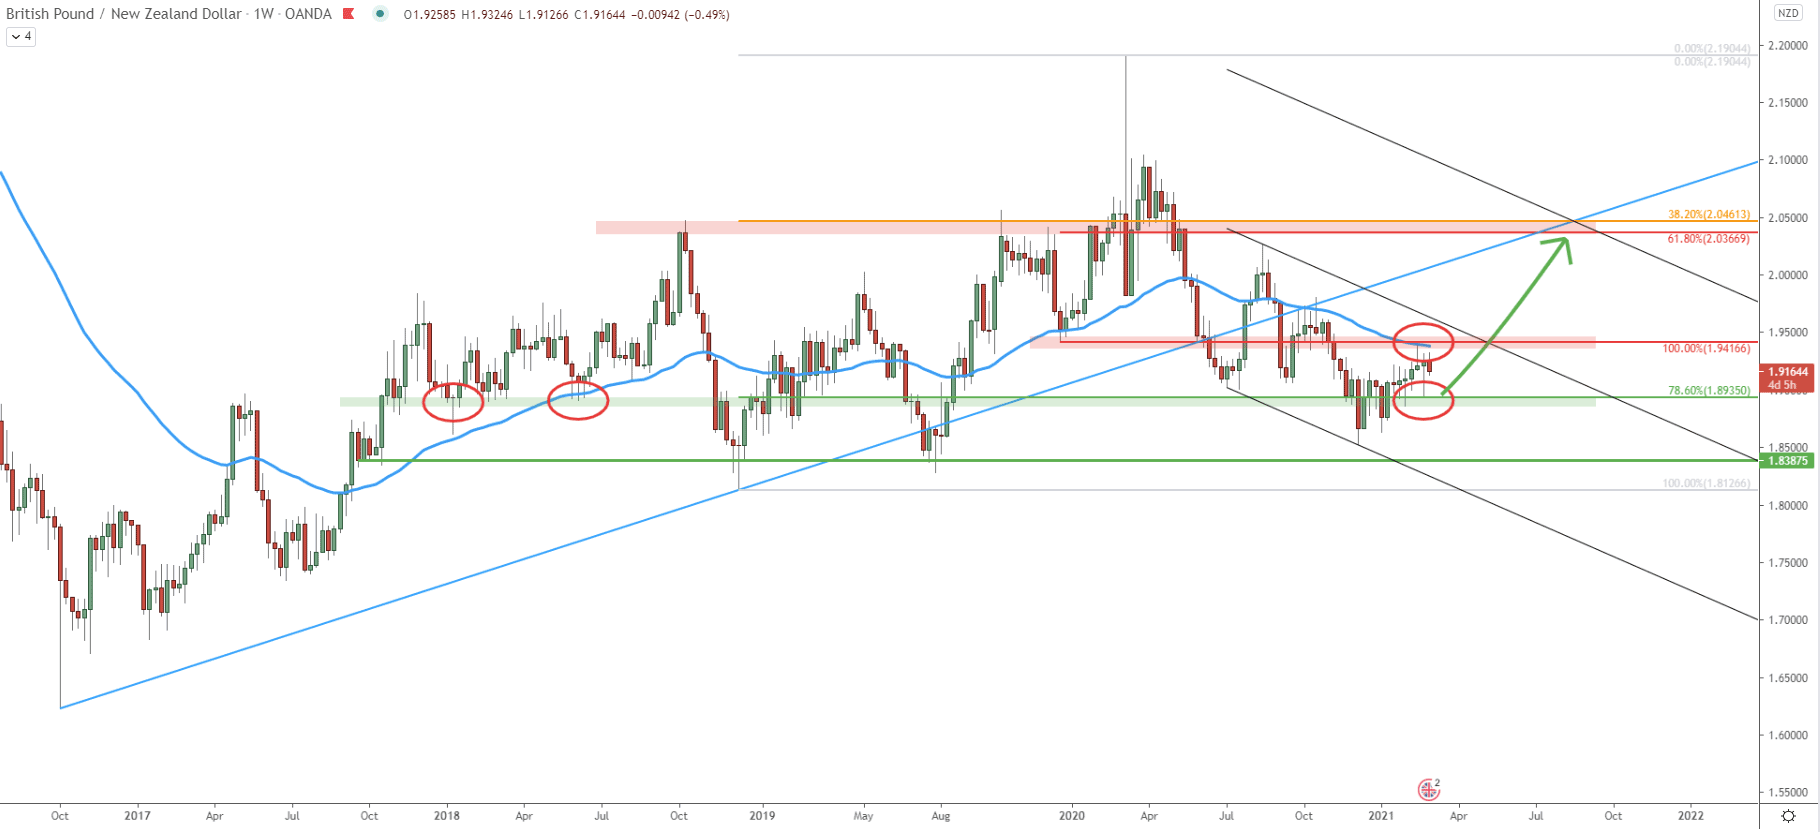
On the weekly chart, GPB/NZD price action seems to be mixed. This is because continues to range between the key support area near 1.8387 and resistance near 2.0461. It is clearly visible that these levels were acting as the support/resistance at least a few times in the past. But while there is no clear direction on the weekly chart, on the lower timeframe analysis, the trend will become more obvious.
But already on this chart, it can be seen that 78.6% Fibonacci retracement level at 1.8935 has been rejected cleanly last week. On the other hand, the previous support, which is the current resistance at 1.9416 was also rejected. This goes to show that there is yet another minor range trading zone between 1.8935 and 1.9416.
As long as the price remains above the 1.8935 support, the probability will remain of an uptrend continuation, simply because GBP/NZD is still printing higher highs and higher lows, suggesting the validity of an uptrend. In this scenario, the price might rise as high as the 2.0366 resistance area. This resistance corresponds to two Fibonacci levels, 61.8%, and 38.2% Fibs as can be seen on the chart. At the same time, it corresponds to the upper trendline of the extended descending channel, suggesting that this might be a long-term price increase.
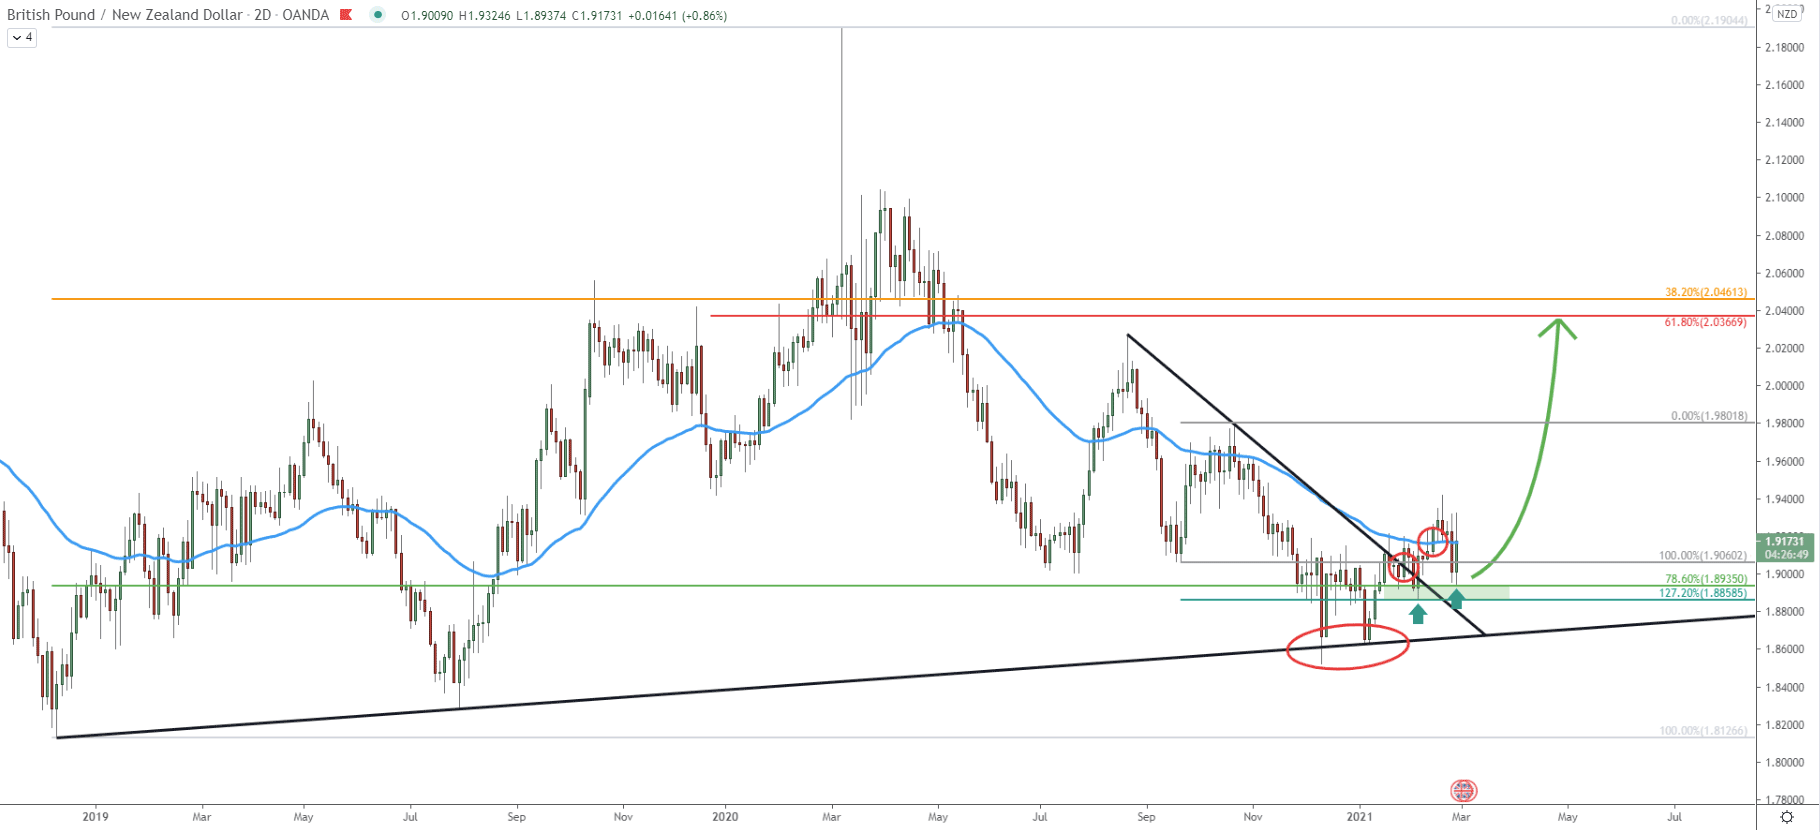
On the 2-day chart, things are getting more clear. At the end of 2020 GBP/NZD bounced off the simple uptrend trendline for two consecutive times. Then the price went up and broke above the downtrend trendline followed by the 50 Simple Moving Average. There were two small pullbacks, where each of them resulted in the rejection of the Fibonacci support. The first is the 127.2% Fibs at 1.8858, applied to the last corrective move up where 50 SMA was rejected. And the second Fibs is 78.6% at 1.8935, applied to the overall move up.
This provides a strong support area formed between these two levels and as long as the price remains above, bulls will have complete control over the GBP/NZD. It is very likely that there will be a consolidation phase, perhaps lasting for the next couple of days. But at the end of this week or the beginning of the next week price can be expected to start rising.
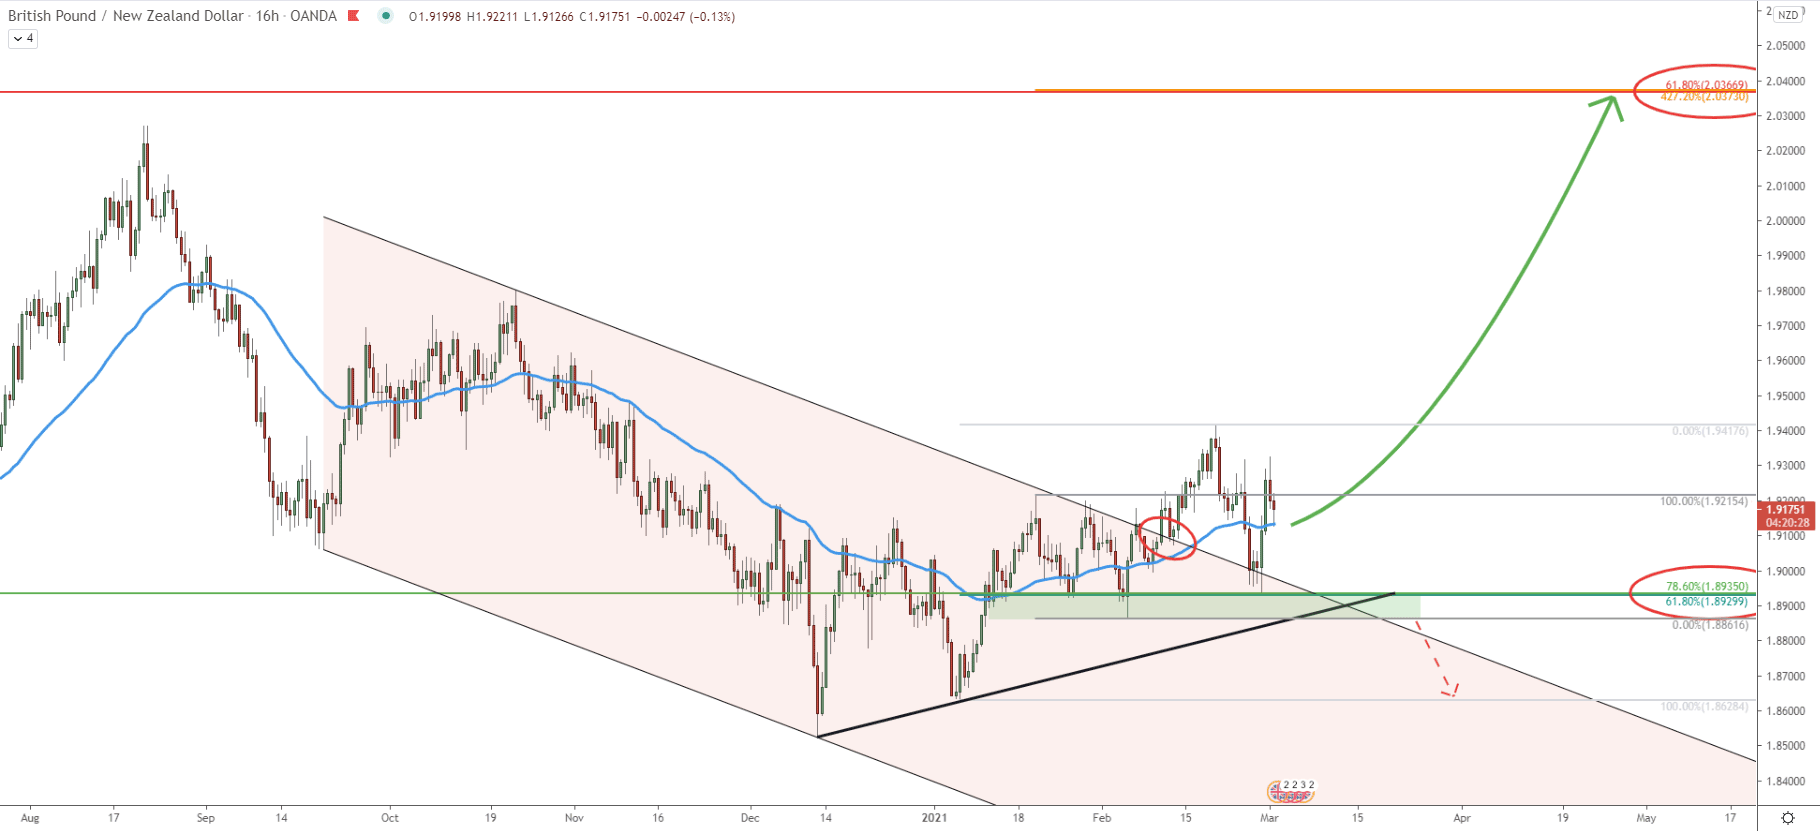
From September 2020 up until February 2021, GBP/NZD was moving within the descending channel. In February this year price finally broke above the channel as well as the resistance area near 1.9215. It can be clearly spotted that the support area has been formed near 1.8930, which is the support level confirmed by two Fibonacci retracement levels, 78.6%, and 61.8%. This week this support was rejected cleanly, implying the trend reversal to the upside.
All-in-all, the support area is between 1.8860 and 1.8930, which was heavily defended by the buyers during the past several months. There were at least 3 bounces off this support area, which shows that the trend remains bullish in the short to medium term.
Fibonacci applied to the first correction, where the 1.8930 support was rejected, shows that 427.2% Fibs corresponds exactly to the 0.0370 resistance area as per the weekly chart. This means that there could be a growth potential of over 1000 pips in the coming weeks.
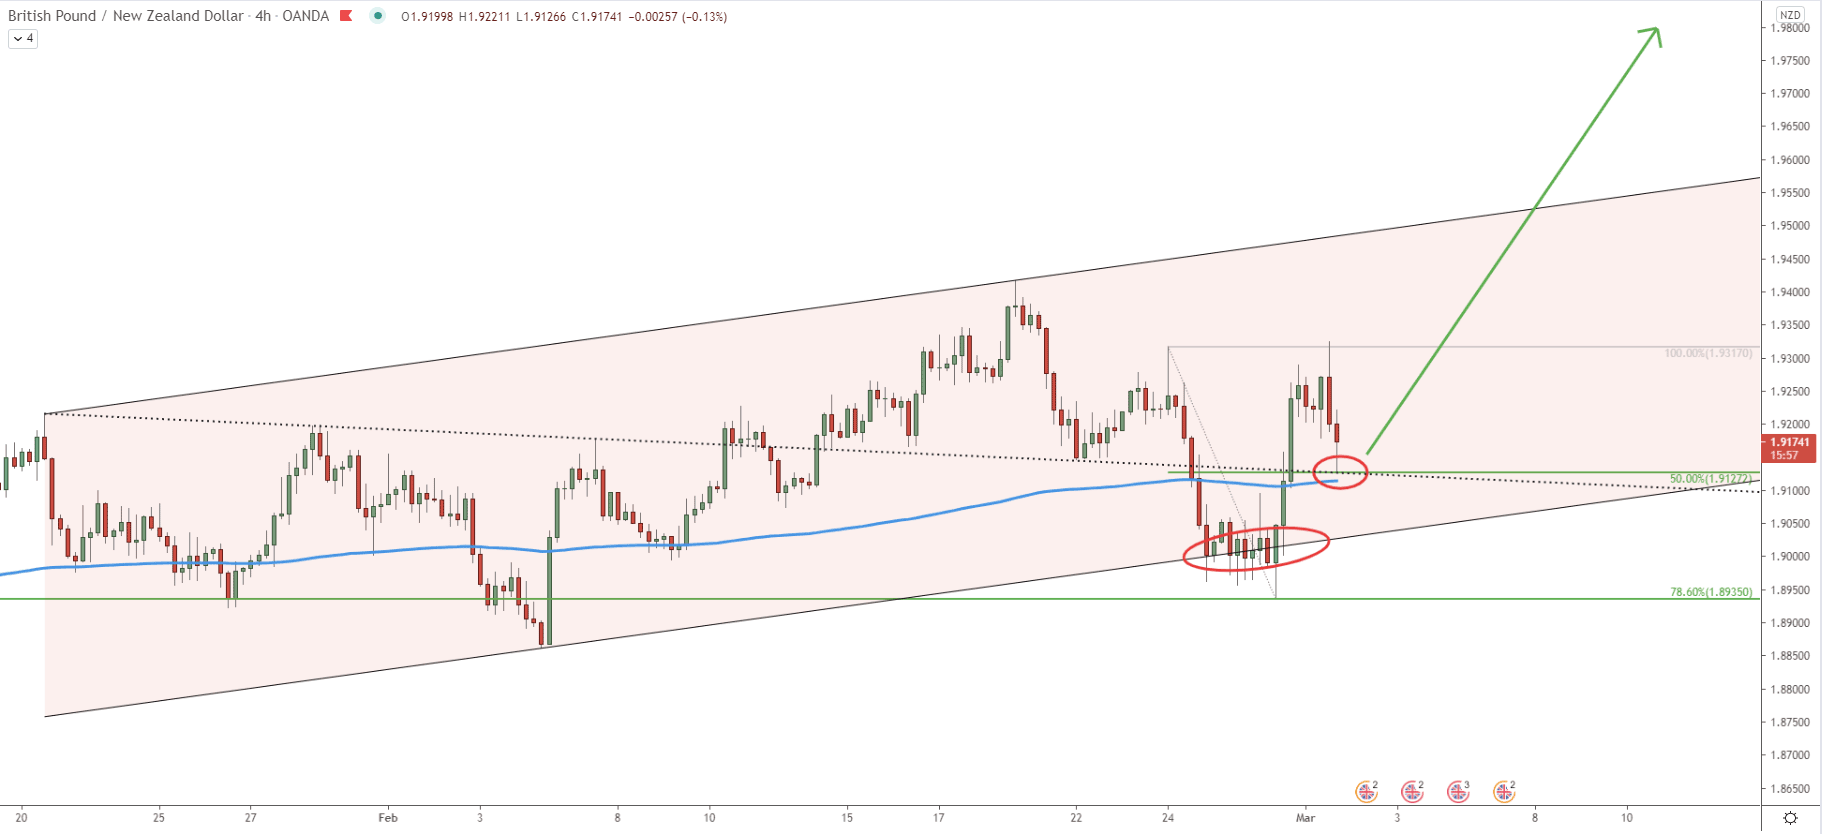
On this chart, the price is already moving within the ascending channel. At the end of March GBP/NZD bounced off the bottom of the channel as well as 78.6% Fibonacci level. Then price broke above the average-price downtrend trendline and 200 SMA. The current pullback was stopped right at 1.9127, which is the 50% Fibs. Along with the SMA, this price area could be a strong demand zone. It is possible that GBP/NZD will attempt to produce a spike below this level. Nonetheless, if the daily closing price will remain above this support, GBP/NZD will remain heavily bullish.
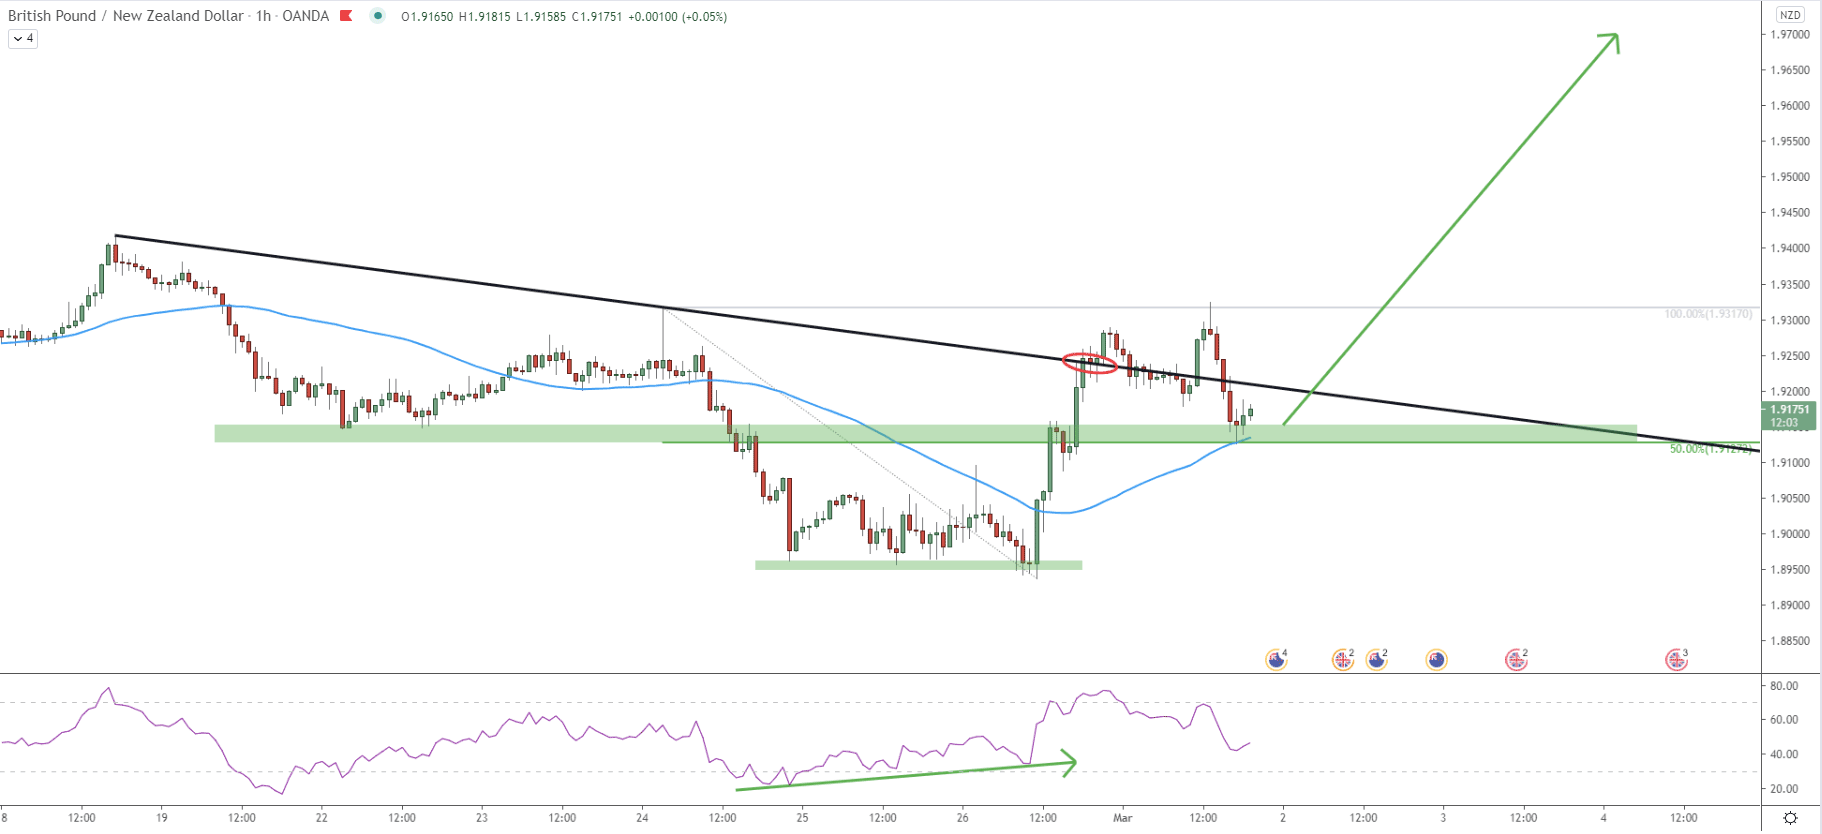
The price has formed a triple bottom near the 1.8950 support area. At the same time, the RSI oscillator formed a bullish divergence suggesting a trend reversal. Since then the price went up sharply and broke above the simple downtrend trendline. Currently, GBP/NZD is trading right in the support/demand area, which certainly can attract buyers for the medium to long term.
On the weekly chart, GBP/NZD is stuck between support and resistance, validating the range trading. Although on lower timeframes, price is showing strong bullish signs, suggesting that a very strong uptrend is emerging.
As per the weekly and 16-hour chart, the key resistance and the potential upside target is located at 2.0360, which is over 1000 pips away from the current price.
As per the 16-hour chart, the key support area is located between 1.8930 and 1.8860. As long as GBP/NZD remains above this area, a bullish trend will dominate. However, a break below 1.8930 could be the confirmation that the trend is becoming bearish, and the risk of further decline will increase substantially.
Support: 1.9127, 1.8858, 1.8935
Resistance: 1.9800, 2.0360