
Published: March 12th, 2020
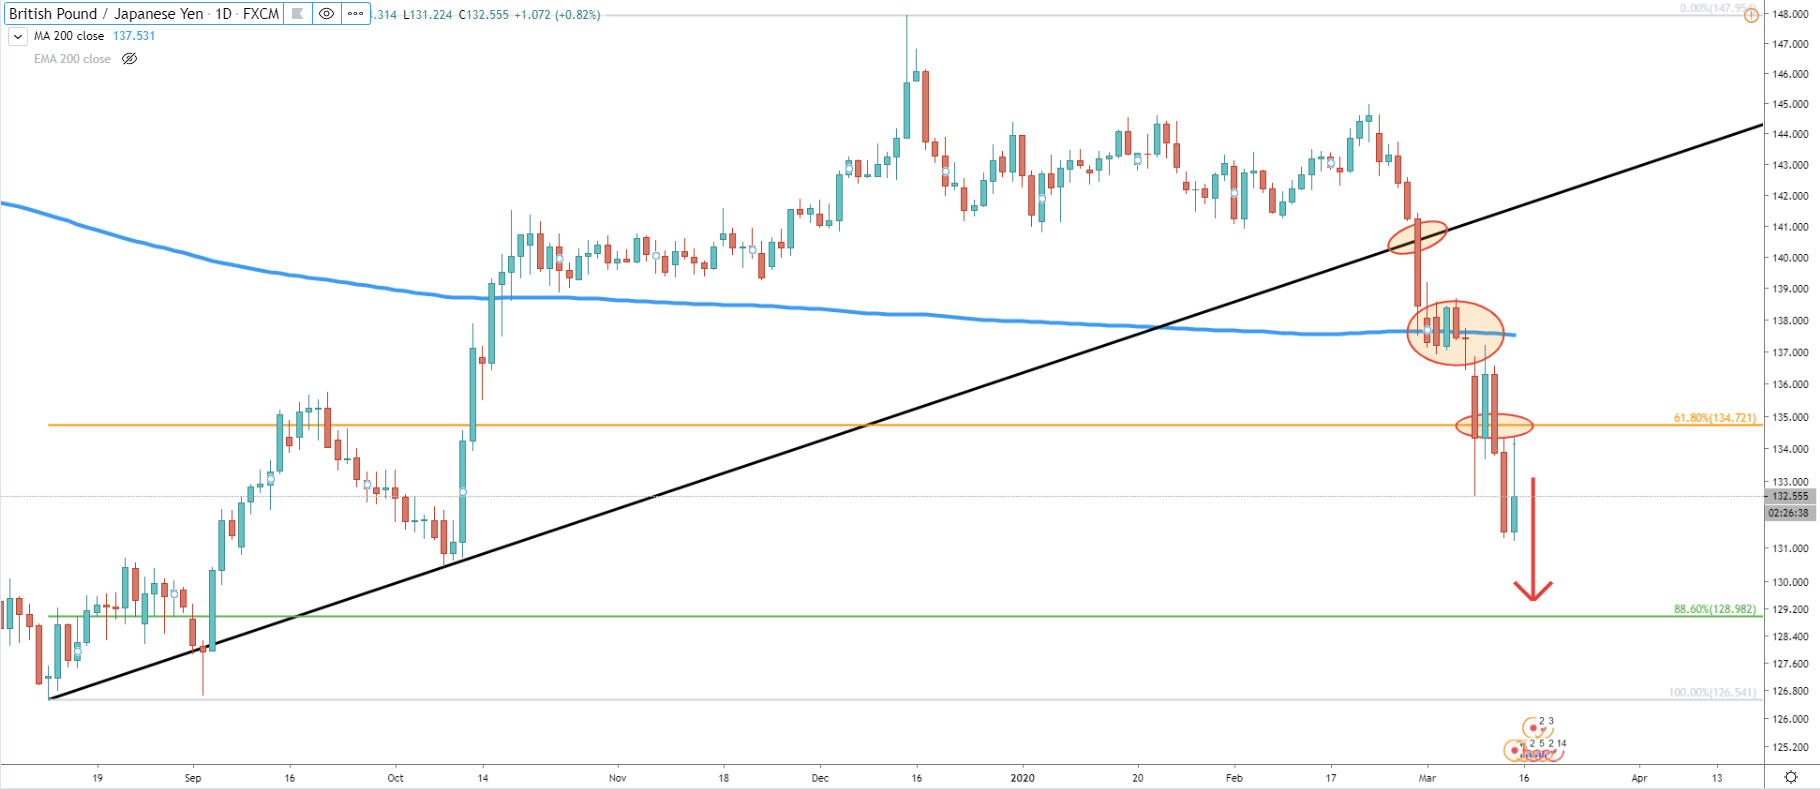
Just look at the daily chart, how the price is penetrating all possible obstacles. It simply can’t find the bottom and remains under very heavy selling pressure during the past couple of weeks. Daily charts show the big picture and the overall weakness of the GBP/JPY. While the 61.8% has been passed without any sort of objection by the market, it is likely that it will test 88.6% Fibonacci retracement level, which is 129.00 psychological support.
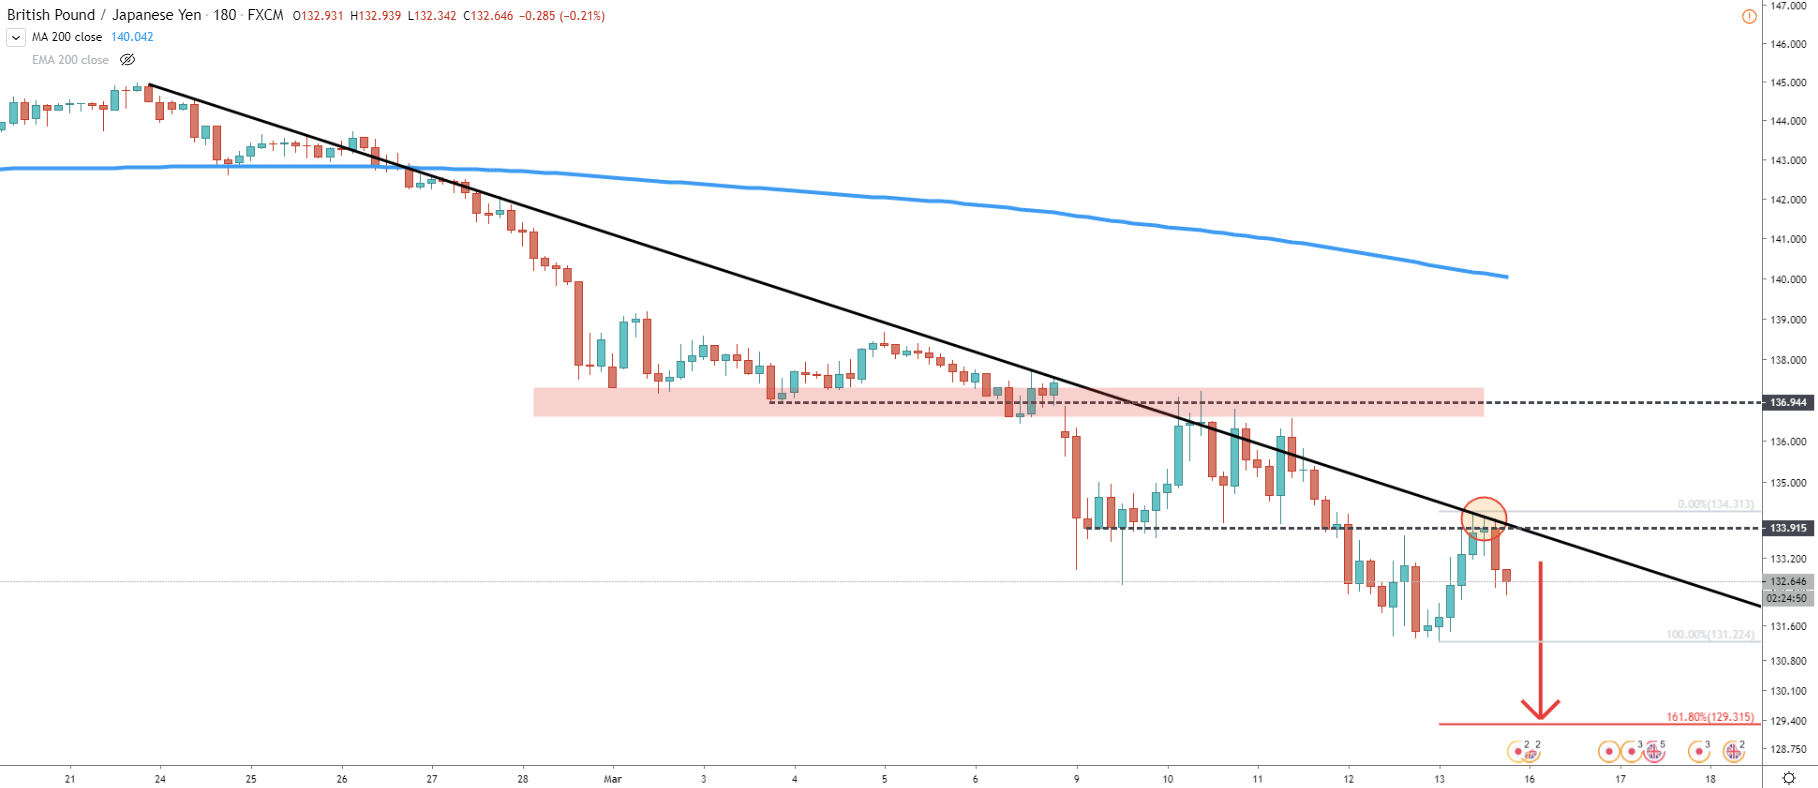
On the 3H chart, price is moving below the trendline, in fact, today it has cleanly rejected the trendline. But look at the prior price action. Lower lows and lower highs are printed non-stop. Previous levels of support become levels of resistance. As in the most recent case where price bounced of 134.00 resistance area. If we apply Fibonacci to the last corrective wave down, we can see that 161.8% is at 129.30, which is very close to the 88.6% Fibs on the daily chart. This makes 129.00 -129.30 a very strong support and potential profit-taking zone.
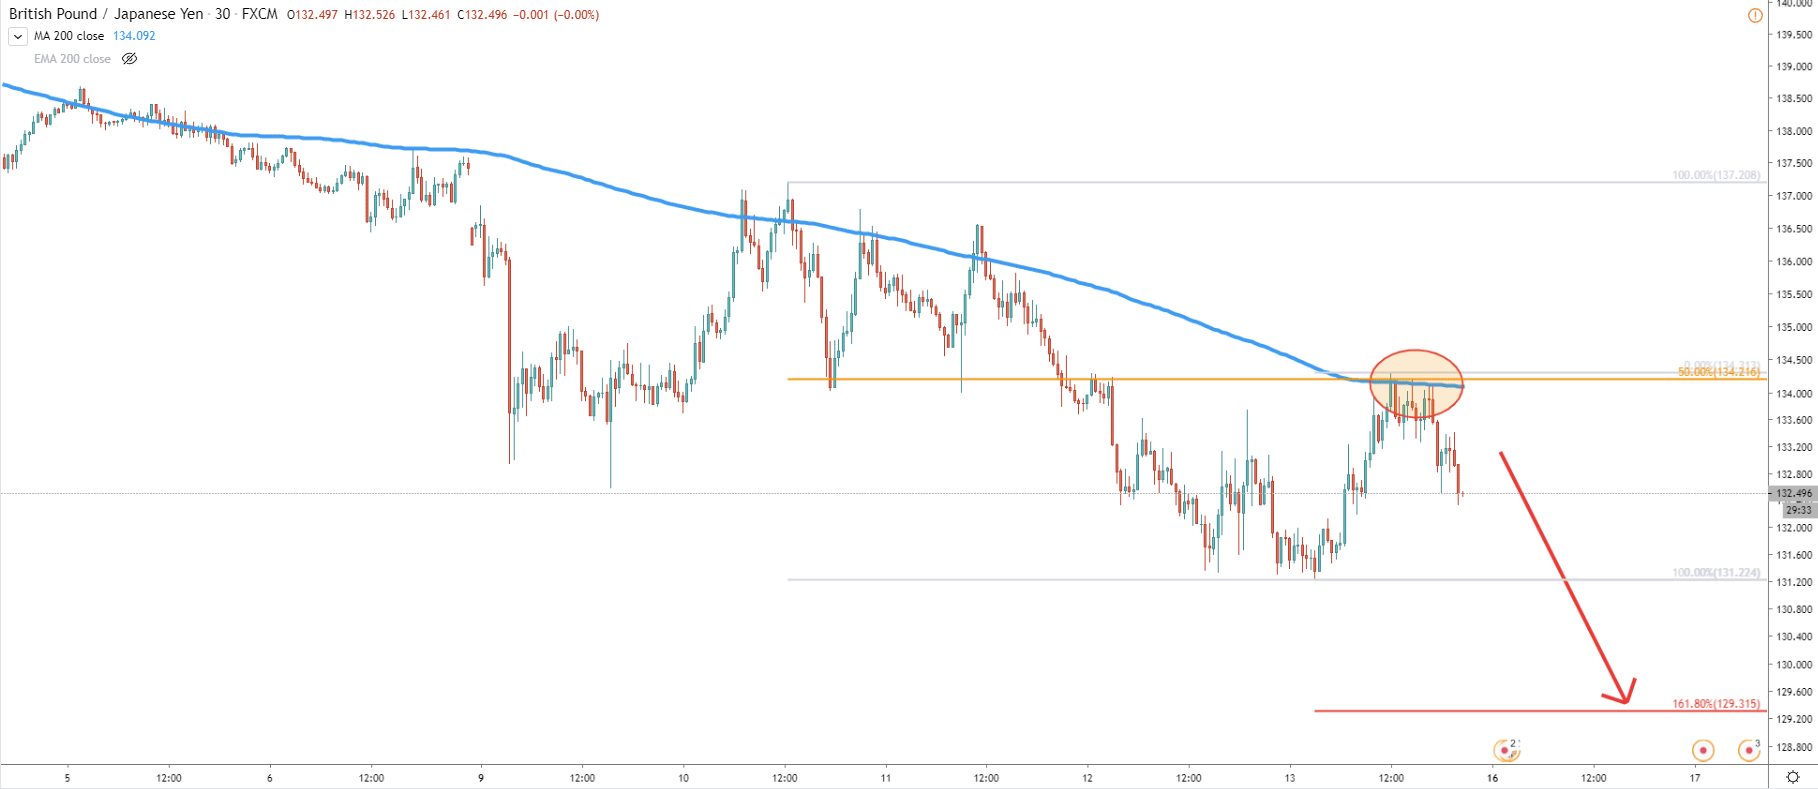
On the 30m chart, GBP/JPY rejected the 2009 Moving average. It was a very clean rejection suggesting a continuation of a downtrend. But at the same time, pair rejected the 50% Fibs at 134.22, which just adds up to the overall downtrend scenario. The price might consolidate for a little while but it seems that sooner rather than later there will be yet another wave down.
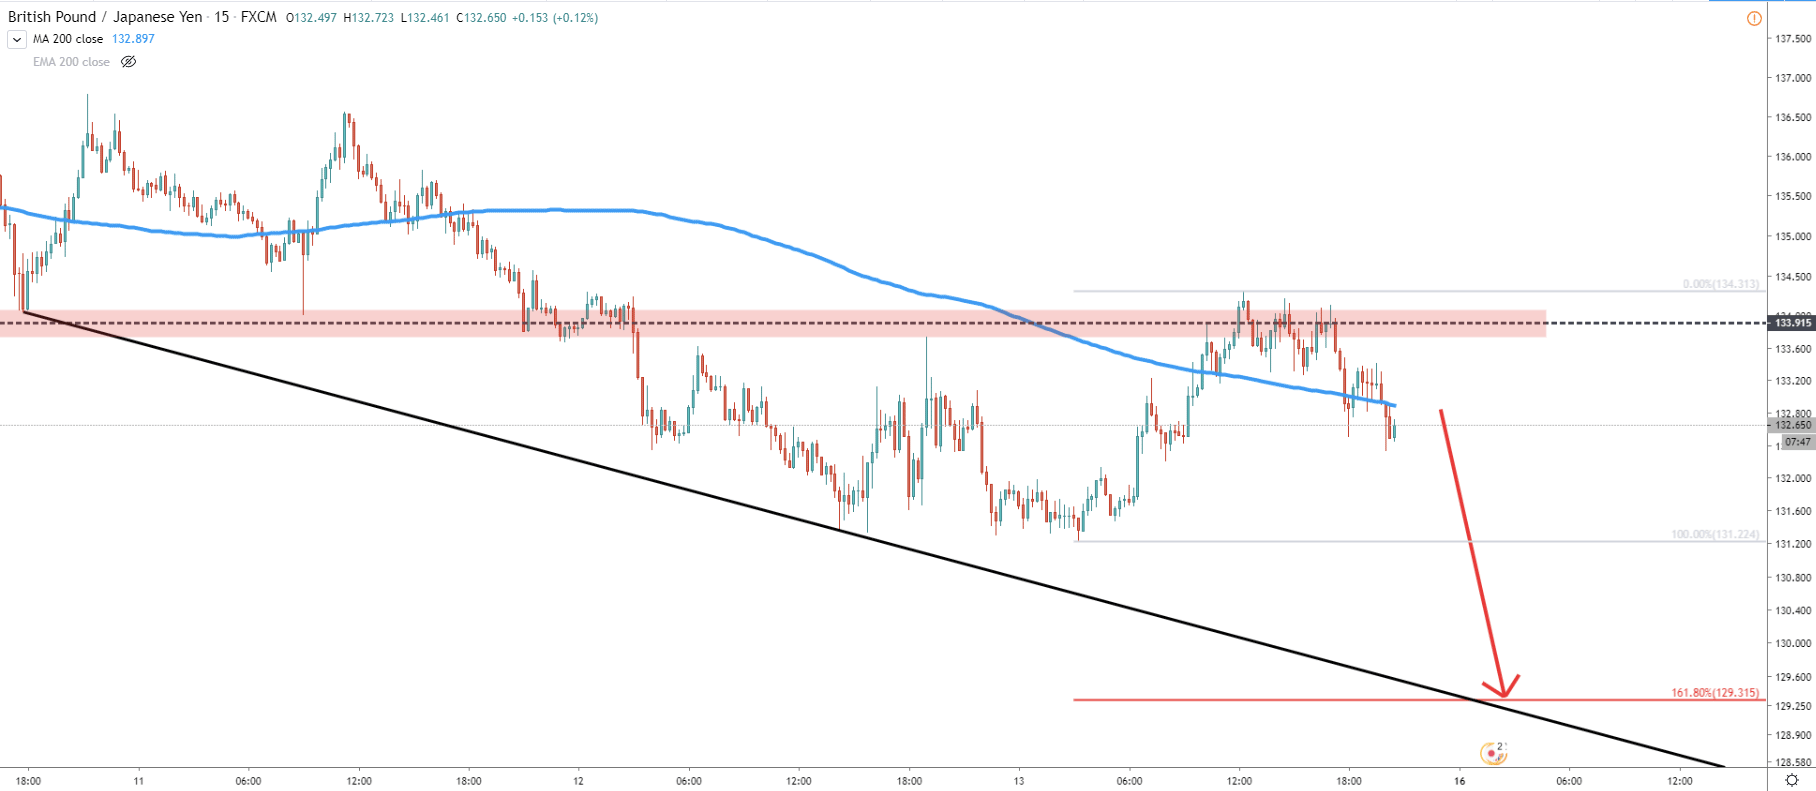
Finally, a 15m chart, where the downside target corresponds to the downtrend support trendline. This also shows that price might start moving down very fast, and the target can be reached within just a couple of days. But keep in mind that due to recent extreme market volatility, on Monday, the opening price can be very unpredictable and therefore it can be reasonable to wait for selling opportunities after the weekend in order to avoid extra risk-taking.
To summarise, the trend is extremely bearish and yet another wave down to be expected. Price can drop by huge 300-400 pips next week. At the same time, consolidation between 131.22 support and 134.31 resistance could be the case. Consolidation could be extended further and if this occurs, it is possible that trend is getting ready to reverse to the upside. At the same time, GBP/JPY might attempt to produce spikes above 134.31 resistance, and it would be important to watch the daily close in this case.
Key support is seen at 129.30, although the price could test a psychological level at 129.00, thus making 129.00 - 129.30 a key support area. Both of these levels are confirmed by Fibonacci retracement levels, first is 88.6% retracement on a daily chart, the second is 161.8% on the 15m chart.
At this point, the uptrend probability remains extremely low. Nevertheless, break and close above 134.31 resistance would invalidate the bearish scenario and is likely to trigger the consolidation phase.
Support: 131.22, 129.30, 129.00
Resistance: 134.31