
Published: March 20th, 2020
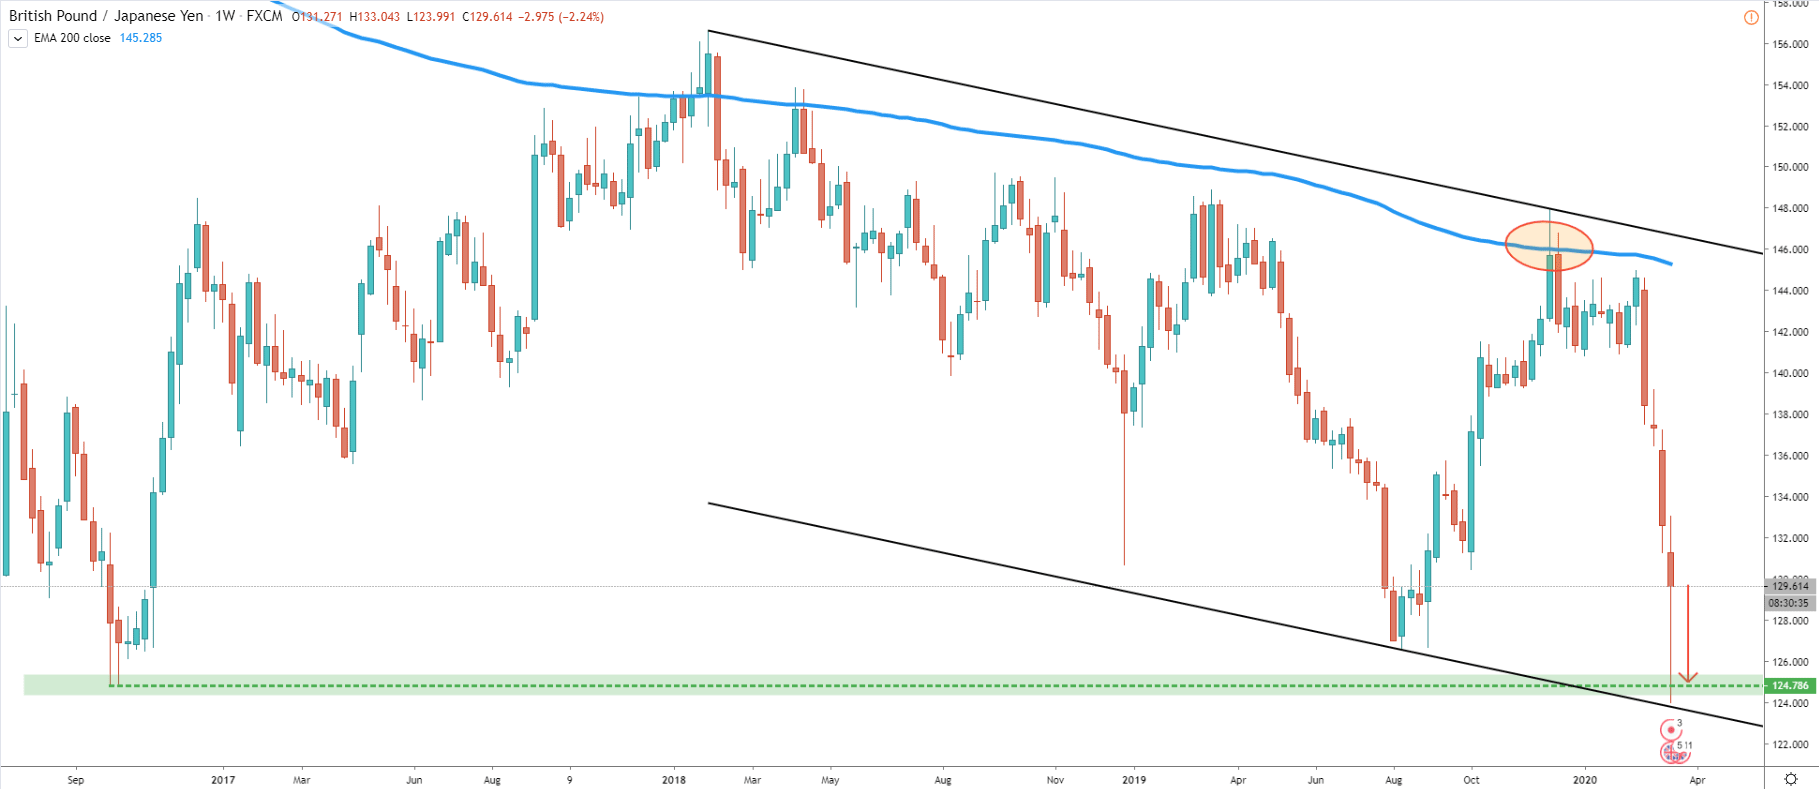
The weekly chart shows that GBP/JPY has rejected the 200 Exponential Moving Average and the price went down very sharply. It has reached 7.5 years low while hitting 124.00 psychological level. At the same time, the pair reached the bottom of the descending channel, which might provide some sort of support in the short term. Also, the drop has been stopped near the low formed back in October 2016.
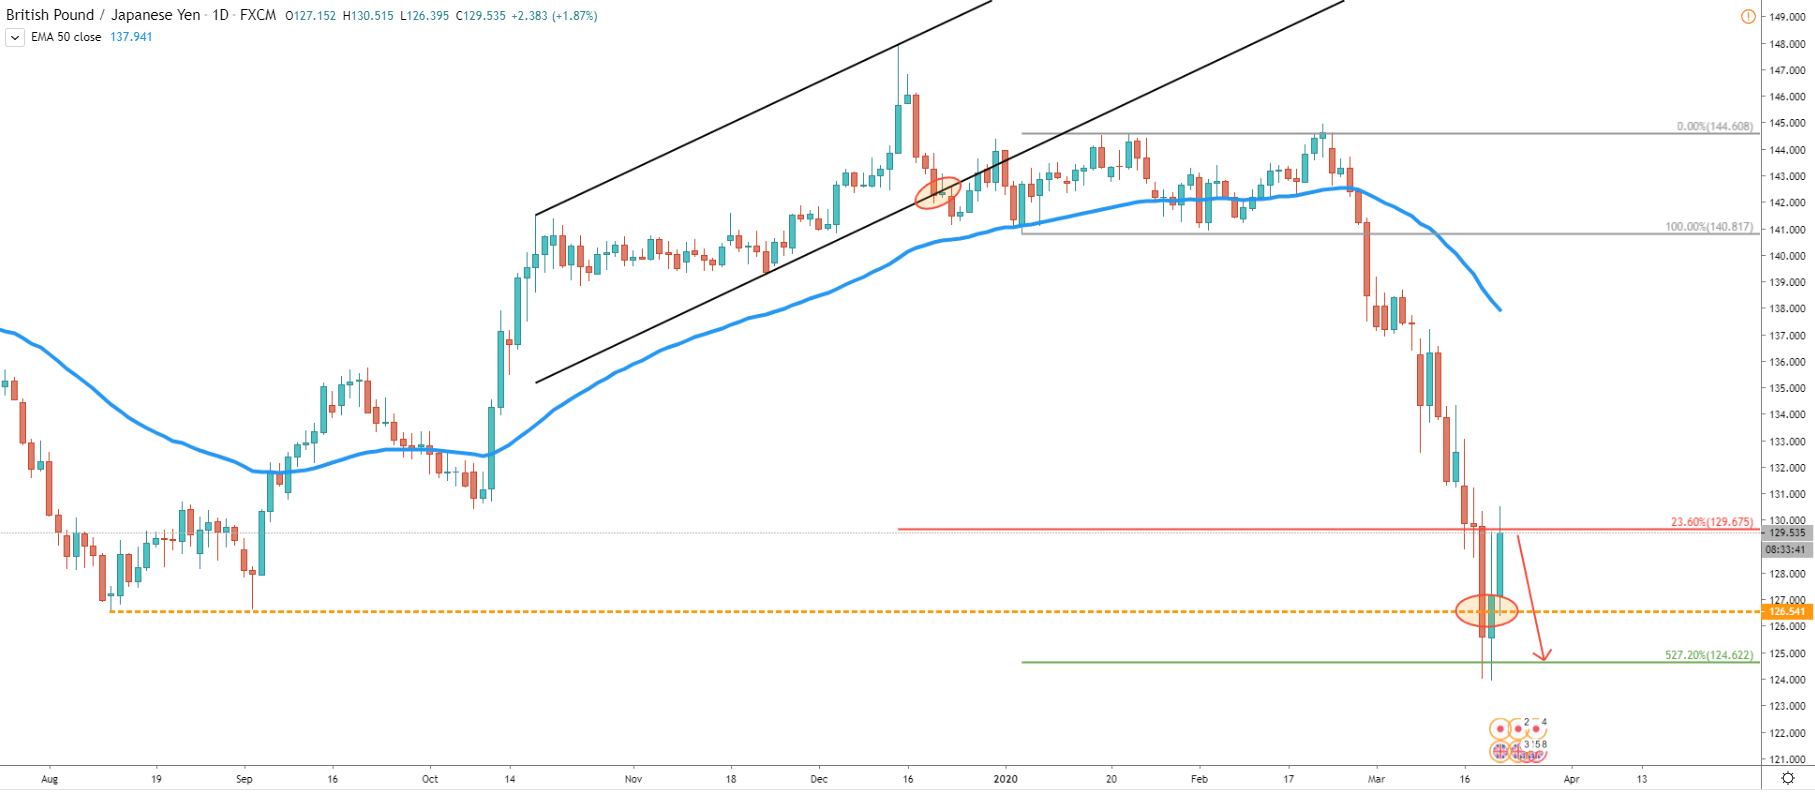
On the daily chart, we can see a break below the ascending channel. Fibonacci, applied to the corrective wave up after the breakout, shows the potential downside target. It is the level at 124.62, which corresponds to the previous are of support on a weekly chart. Currently, the price is near the 23.6% Fibonacci retracement level, which is 129.67. It seems that there should be a psychological resistance near 130.00, where the price can potentially rise. Although while it remains below, the downtrend is likely to continue. It is also worth mentioning that the previous level of support on a daily chart has been broken. This also suggests a strong selling pressure that hasn’t gone anywhere.
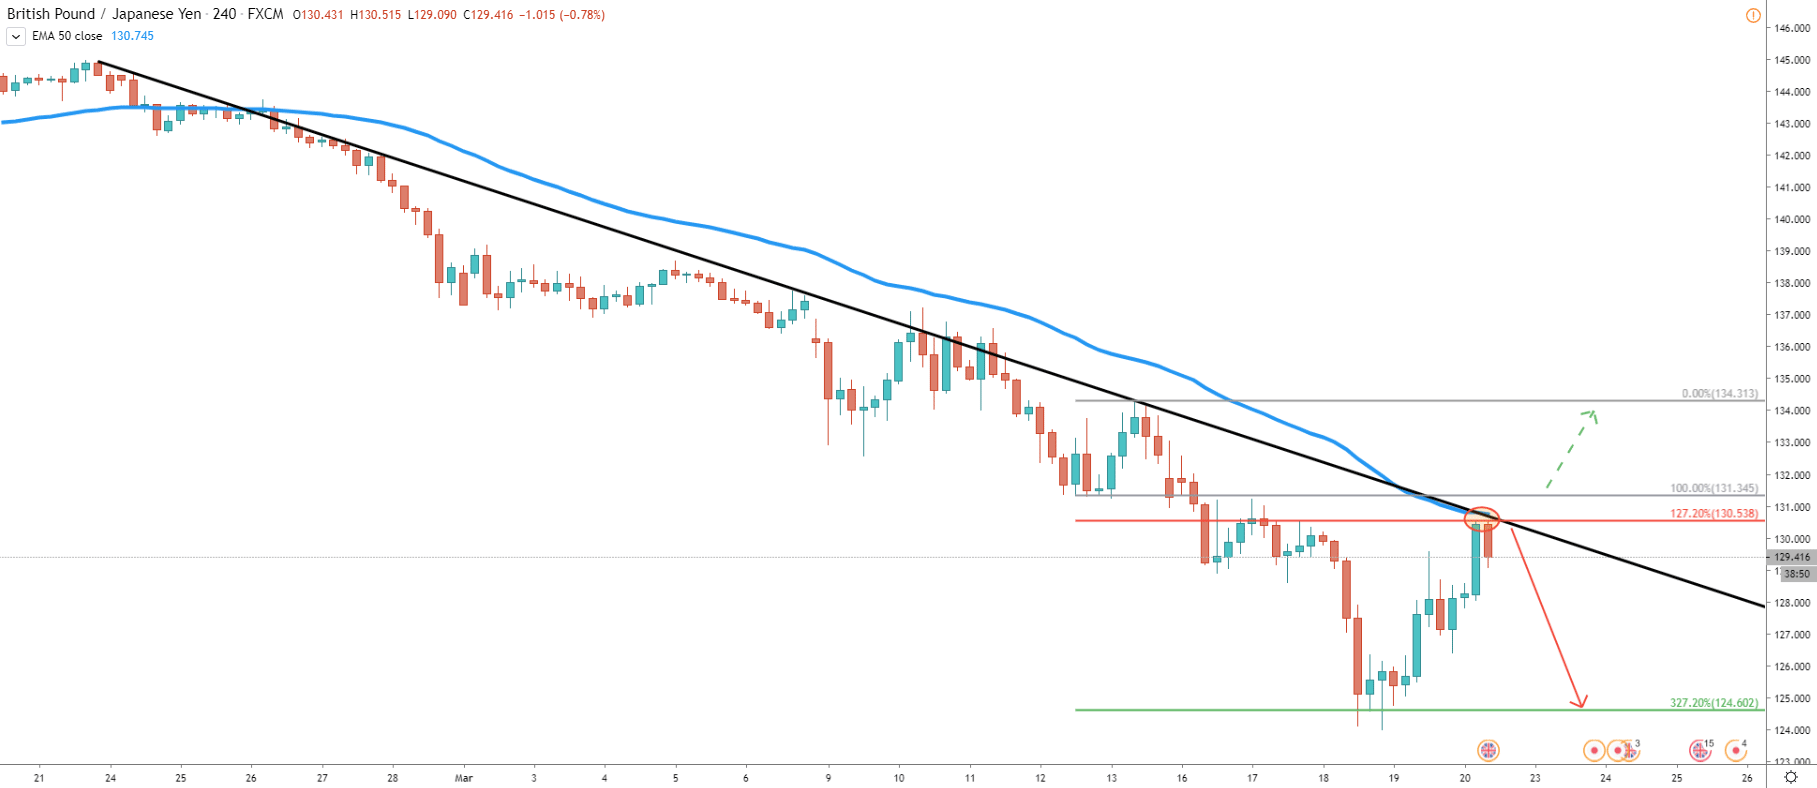
Today price has reached the downtrend trendline as well as 50 EMA level. It also rejected 127.2% Fibs and could retest the 327.2% retracement at 124.60. So far, GBP/JPY remains below all of these indicators, which should provide great technical resistance. Therefore it is important to watch for the break above, which would invalidate bearish outlook and can result in a trend reversal.
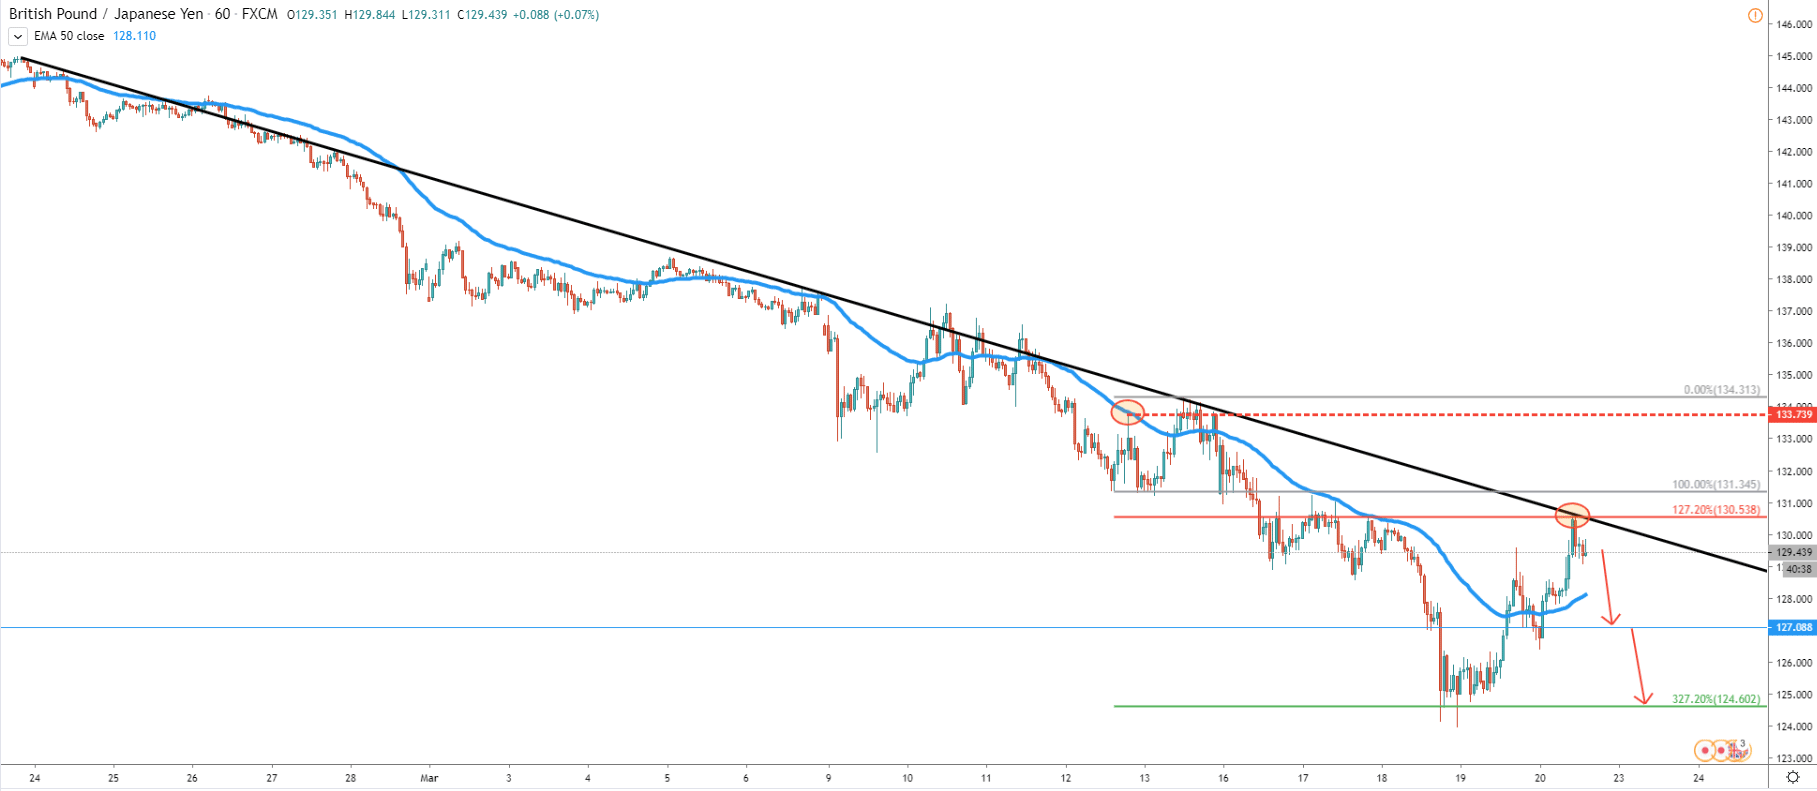
On the 1h chart, we can see more clearly the bounce off the 130.54 Fibonacci resistance level. This is also the price area where 50 EMA has been rejected cleanly on March 17. While this level is being respected by the market, bears will continue to dominate. Of course, this could result in a massive drop, although the nearest target should be considered near previously formed low. To be precise, this is the 124.60 support level.
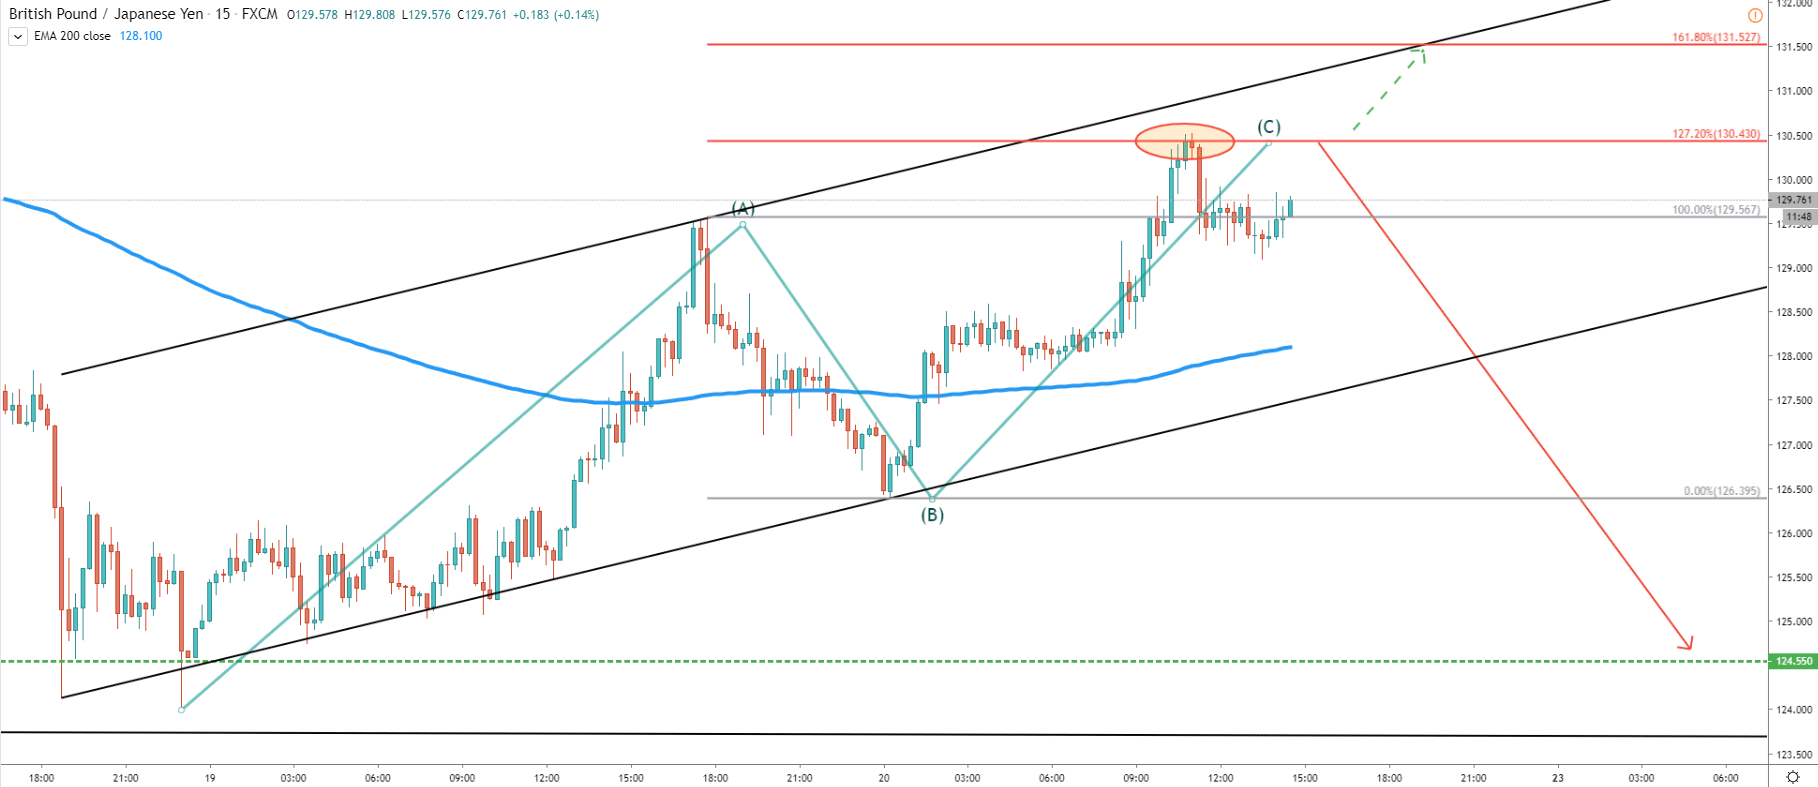
The final chart is on a 15m timeframe. Here we can see, a potential development of the ABC correction, based on the Elliot Wave theory. Pair has reached the 127.2% retracement level and rejected it. It means that this might be the end of the ABC correction and price is getting ready to produce a new wave to the downside.
GBP/JPY trend is heavily bearish and recent price action shows that there is more room for decline. The current rise in price could have been just a correctional phase and GBP/JPY is about to continue moving south. At the very least price is expected to form a double bottom near 125.00 area, as long as it remains below 130.43 Fibonacci resistance.
Price is likely to form a double bottom near 125.00 area. But to be precise it is 124.55 price level based on the Fibonacci indicator. At the same time127.00 could act as strong support and should also be monitored for rejection.
Considering an extremely strong downtrend, the trend reversal scenario holds low probability. Only on Daily break and close above 130.50 resistance area, the bearish forecast can be invalidated.
Support: 127, 126.45, 124.55
Resistance: 130.51


