
Published: June 10th, 2020
Following the topic related to the GBP weakness across the board, many GBP pairs are expected to move against the Great British Pound in the short, medium, and potentially long term. On the other hand, the JPY still remains the “safe-haven” and could be in great demand over the long run. This should result in a very fast price decline of the GBP/JPY currency pair and now we will observe the technical aspects of such expectation.
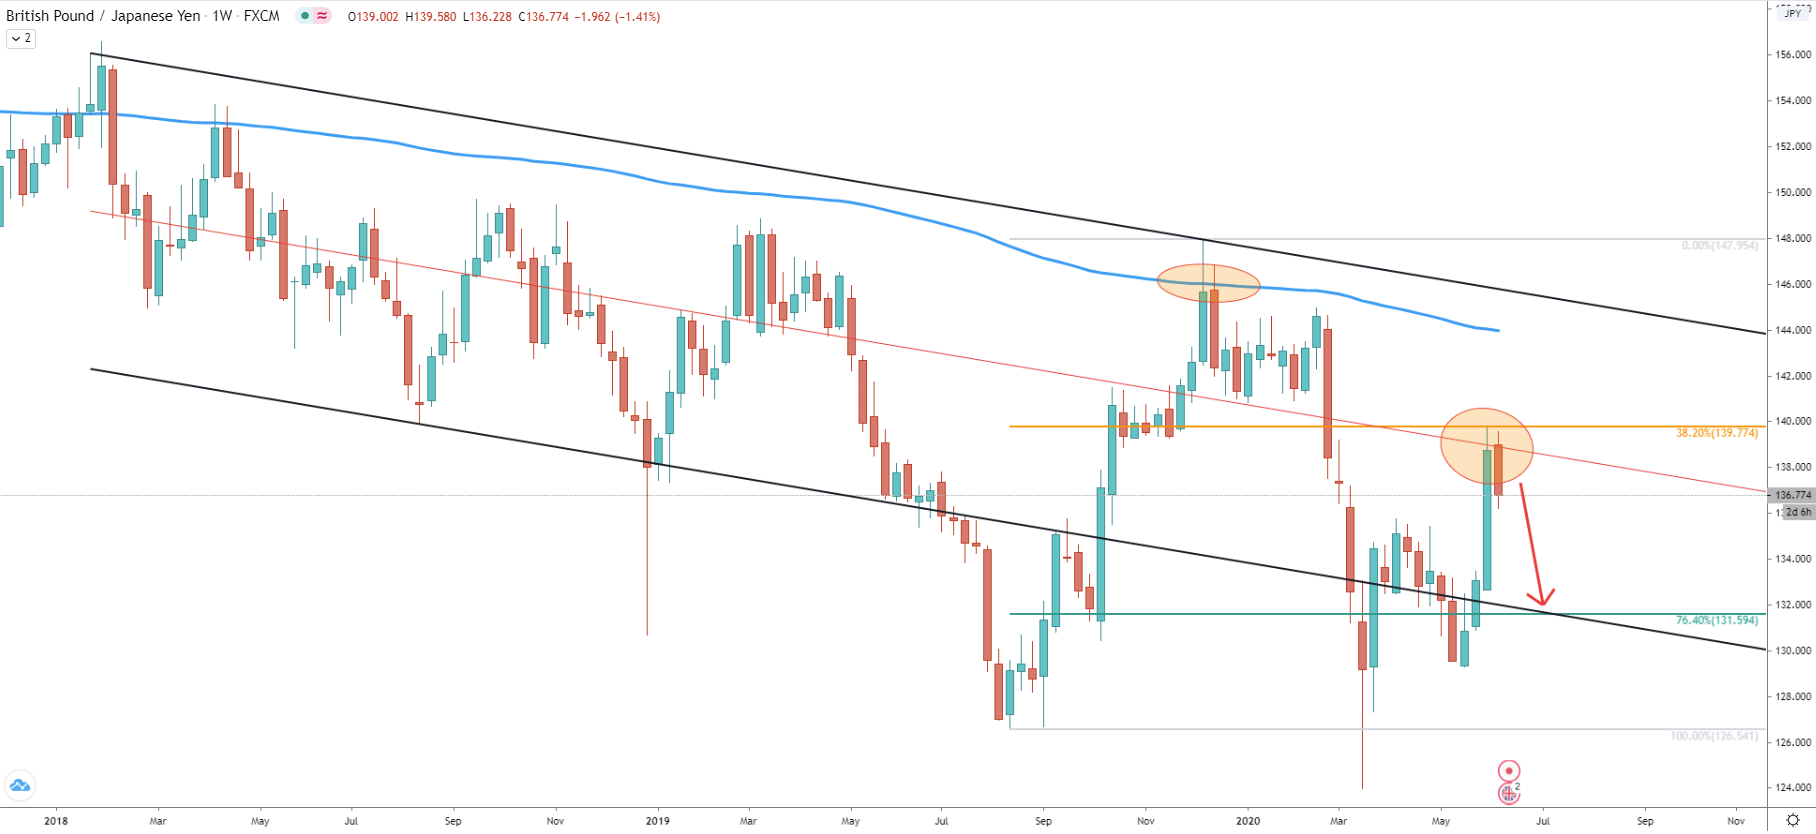
We are starting off with the Weekly chart, where the major trend becomes obvious. It is a clear downtrend and while the price has been trading within the descending channel for over a year, eventually it broke below. This just adds more selling pressure overall, and GBP/JPY remains heavily bearish. Fibonacci applied to the last corrective wave up shows that a 38.2% retracement level at 139.77 has been rejected cleanly, confirming the validity of the downtrend. Based on the 76.4% retracement level as well as the lower trendline of the descending channel, the potential downside target is seen at 131.60 price area. It means that there is at least 500 pips downside potential in the coming days or weeks.
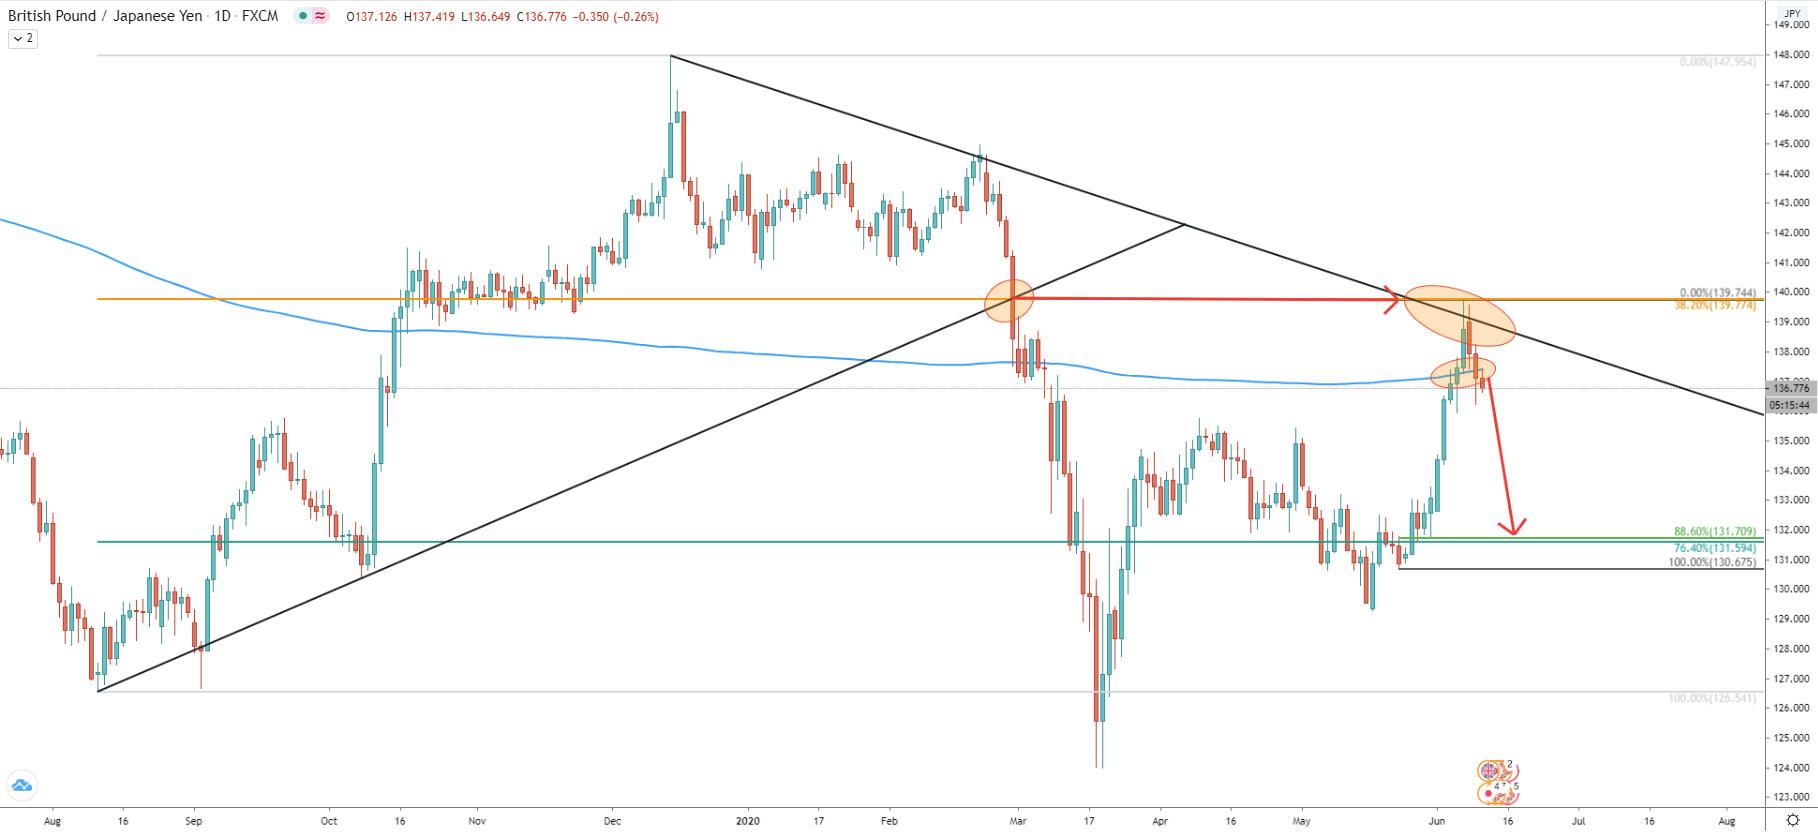
The daily chart shows, that after reaching 147.95 high, back in December 2019, the price went down and broke below the uptrend trendline. Current resistance at 139.77 cleanly corresponds to the breakout point of the trendline. Therefore, as long as the price remains below this resistance, sellers will be in a complete control.
Yesterday’s price action shows that GBP/JPY broke below the 200 Exponential Moving Average, which might have been the selling trigger for the bears. We have also added another Fibonacci retracement indicator to the last wave up. The 88.6% retracement level corresponds almost precisely to the previously mentioned downside target at 131.60
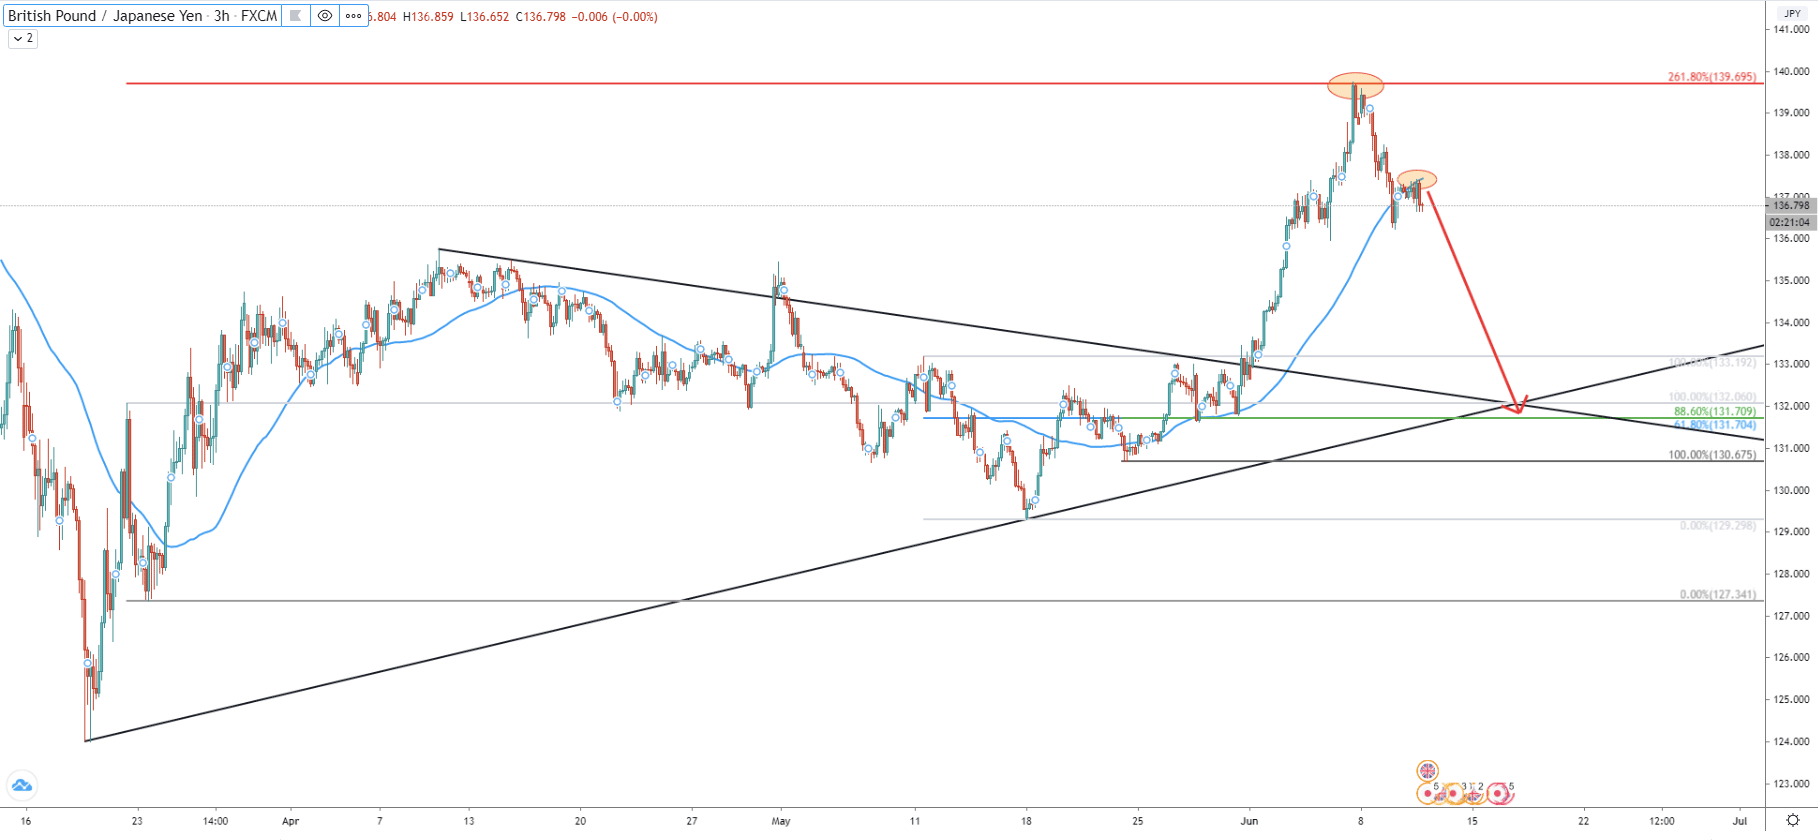
Moving on to the 3H chart, on the most recent high, the price has reached 139.70 level. This was the point where 261.8% Fibonacci resistance was rejected, after which price went down and broke below the 50 EMA. Right now, the EMA is acting as the resistance, yet again suggesting the very beginning of the strong move to the downside. Another Fibonacci applied to the last wave down, on the previous downside corrective move, shows that the downside target at 131.70 now corresponds to 61.8% as well as 88.6% Fibs. Moreover, the support also corresponds to the uptrend and downtrend crossing and shows that the target could be reached within just several trading days.
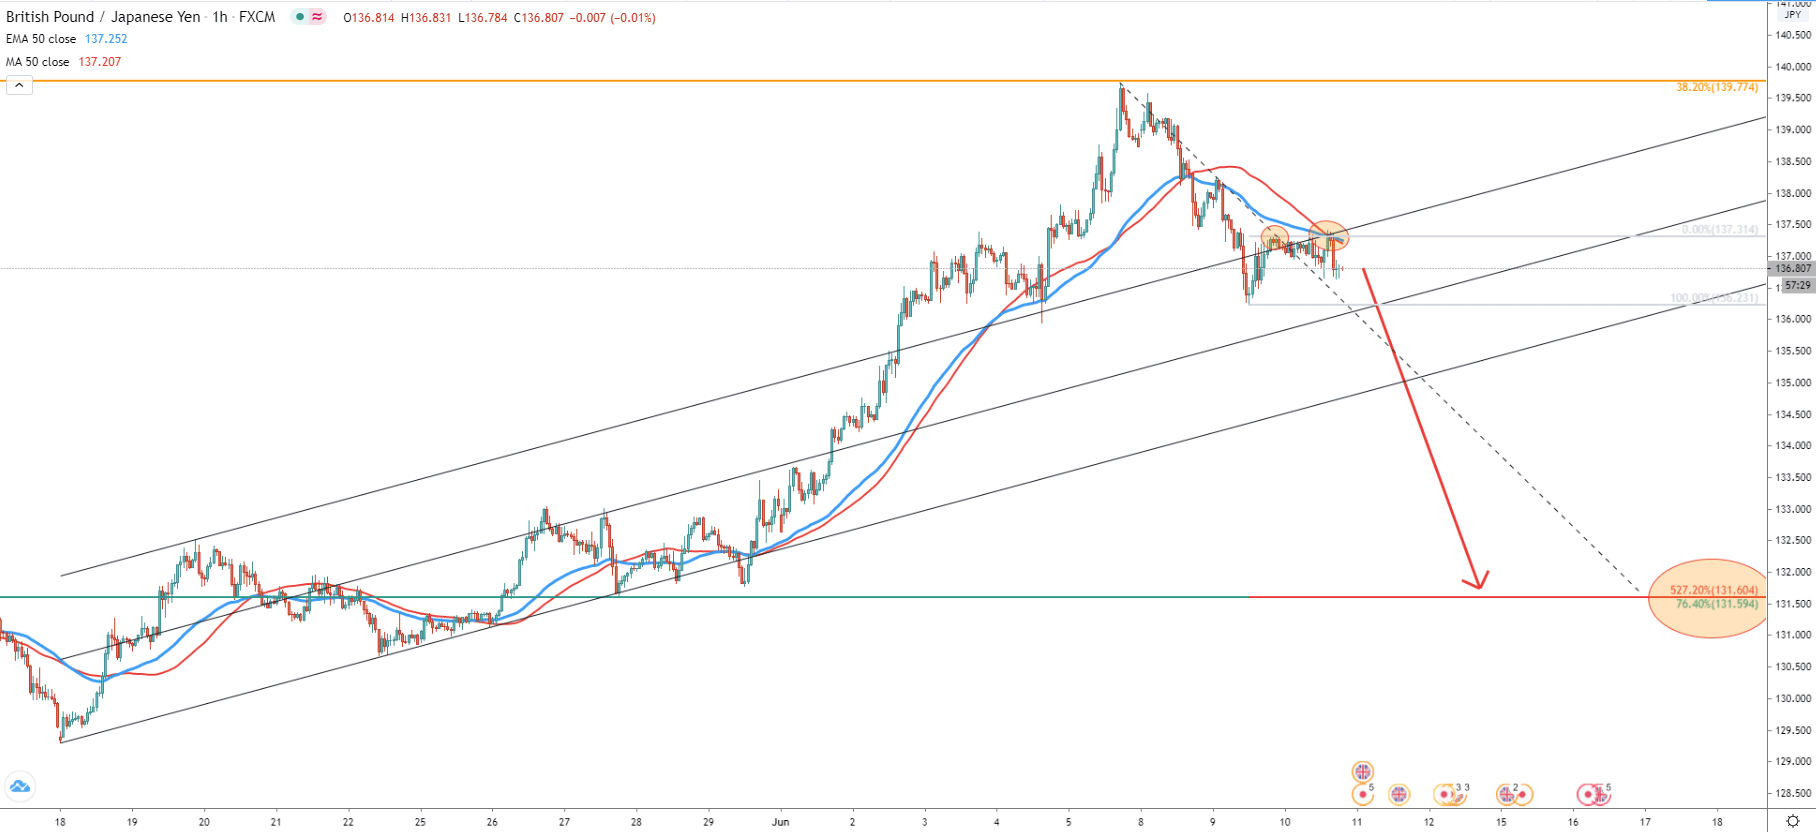
The 1-hour chart goes to show how price reacts to the previously formed ascending channel. We can see that the upper trendline is acting as the resistance and clearly is being rejected. The downtrend trendline was already rejected after which price attempted to break above but failed to close higher. On the breakout attempt, GBP/JPY reached and rejected 50 Simple and Exponential Moving Averages, confirming bearish domination one more time. And finally, we have applied the Fibonacci retracement level to the current corrective wave up, where the downtrend trendline was rejected. It shows that 527.2% retracement also corresponds to the 131.60 downside target.
The GBP is looking very weak while the JPY is looking very strong. Technically GBP/JPY pair has topped out and the long term downtrend is expected to continue. Considering the most recent price action and multiple rejections of various resistance indicators, the downtrend could be just around the corner.
There is only one key support and the downside target, which is 131.60 level. This level is confirmed by at least 4 different Fibonacci retracement levels, the downtrend, and the uptrend crossing.
Most recent high at 137.42, where 50 MAs were rejected on the 1h chart, should be considered as a key resistance level. The 4h and 1h close above this resistance will most likely invalidate a strong bearish scenario. In this case, GBP/JPY could be reversing to the upside for the long term.
Support: 136.23, 131.60
Resistance: 137.42, 139.77


