
Published: December 16th, 2020
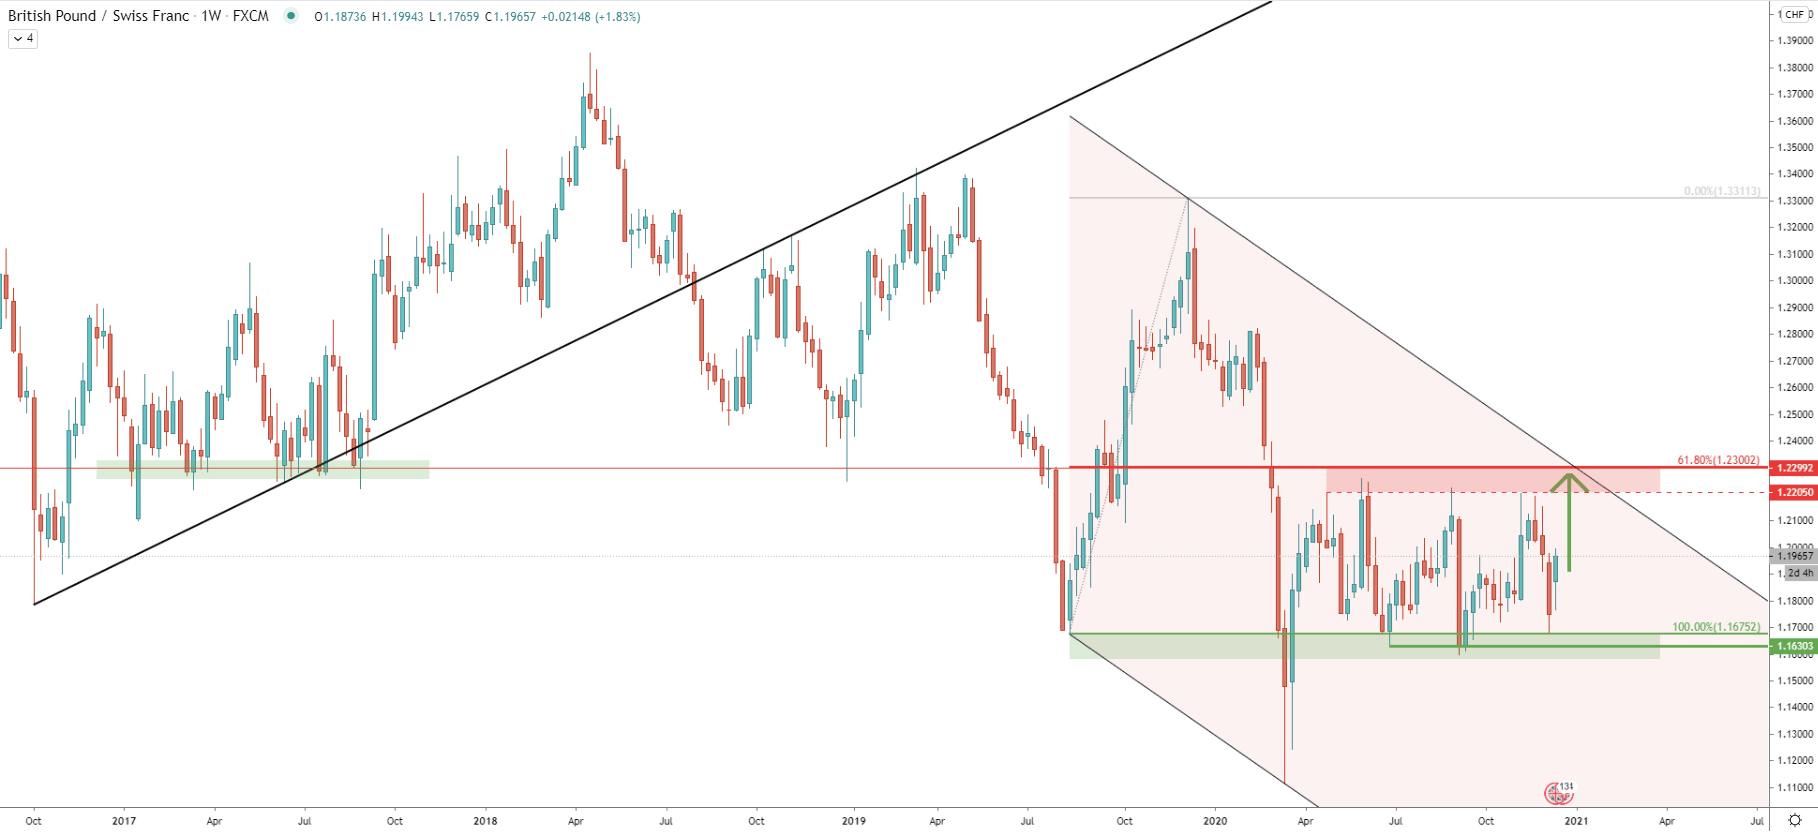
On the weekly chart, it is quite obvious that the support has been formed near the 1.1675 level, which got rejected at least 3 times during the past 9 months. Just last week, GBP/CHF tested this support, and this week, the appearance of the strong green candle might be indicating that the price is preparing to move up once again.
The strong resistance is located a the 1.2300 psychological resistance, which is 235 pips away from the current price. This resistance is also supported by the 61.8% Fibonacci retracement level and the top of the ascending channel. Considering that GBP/CHF is aiming for the channel trendline, it would be reasonable to assume that 1.2300 resistance could be reached within the next few weeks. Another, and final point on this chart, is that 1.2300 previously has acted as the strong demand area, back in 2017. Maybe this time, when/if GBP/CHF will reach it, it will be acting as the strong supply area.
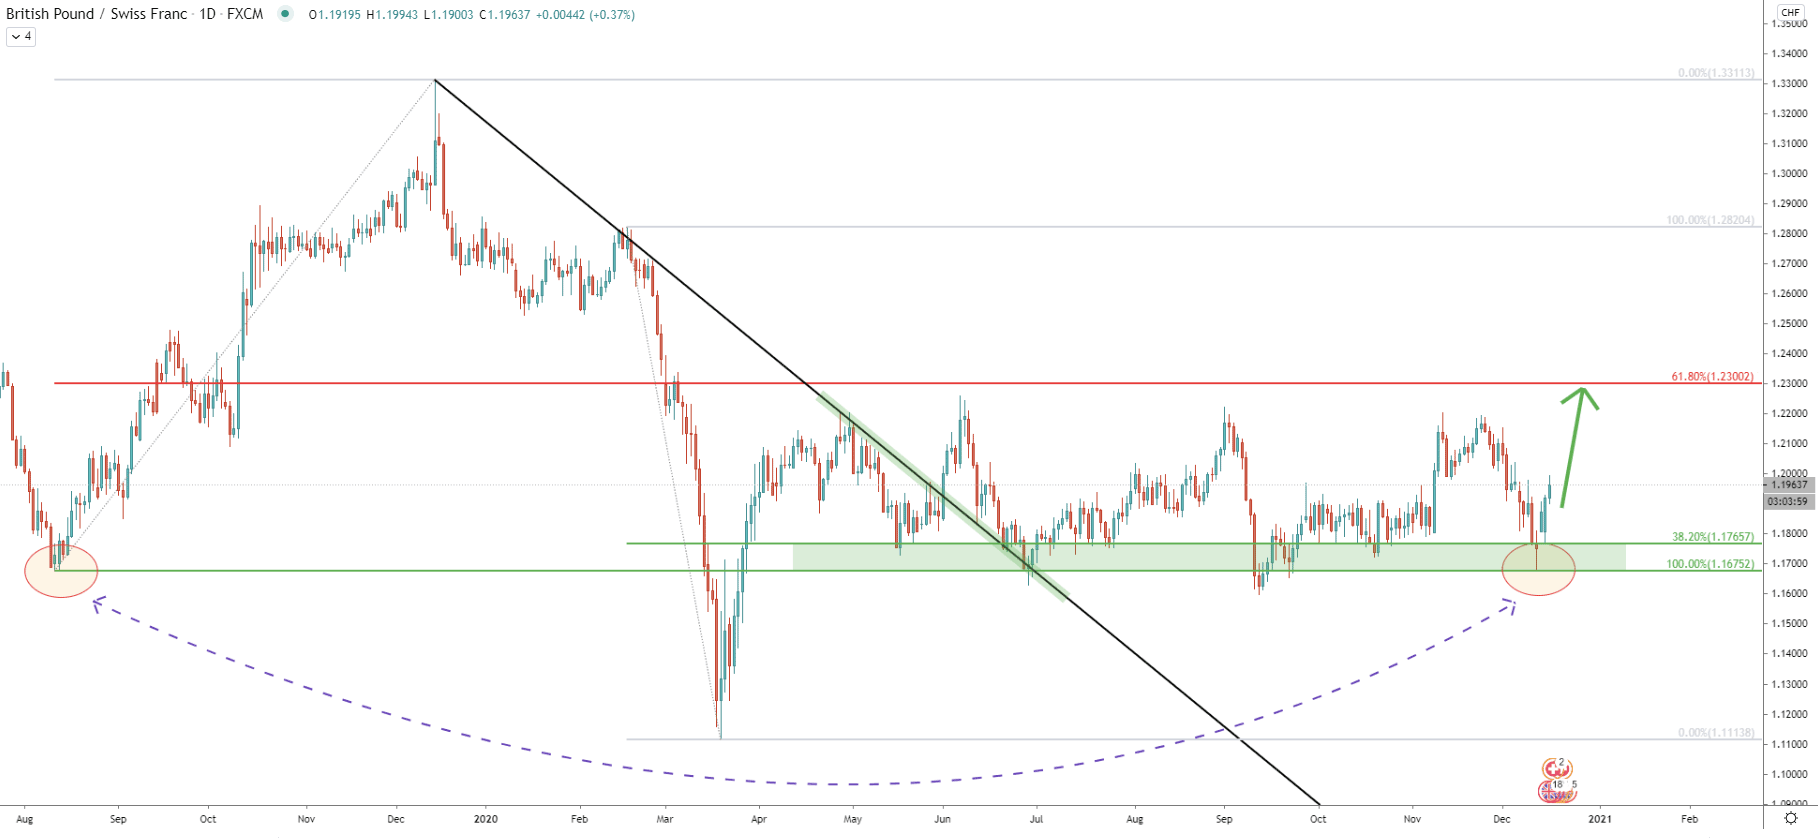
The daily chat shows that GBP/CHF is clearly in the consolidation phase. The support area is located near 1.1700 and resistance near 1.2200. Four days ago, the price has cleanly rejected the support formed back in August 2019, after which it started to rise. And just yesterday, GBP/CHF rejected the 38.2% Fibs, applied to the last wave down, suggesting the beginning of an upside swing.
Considering that the downtrend trendline got finally broken and that the range-trading phase is active, the probability of the uptrend continuation is slightly higher in relation to the downside move.
After the price bounced off the 38.2% Fibs at 1.1765, it went up sharply and broke above the 200 Exponential Moving Average, which previously acted as the support. It can be seen that the price didn’t have any difficulties in slicing through the EMA, suggesting a strong bullish pressure.
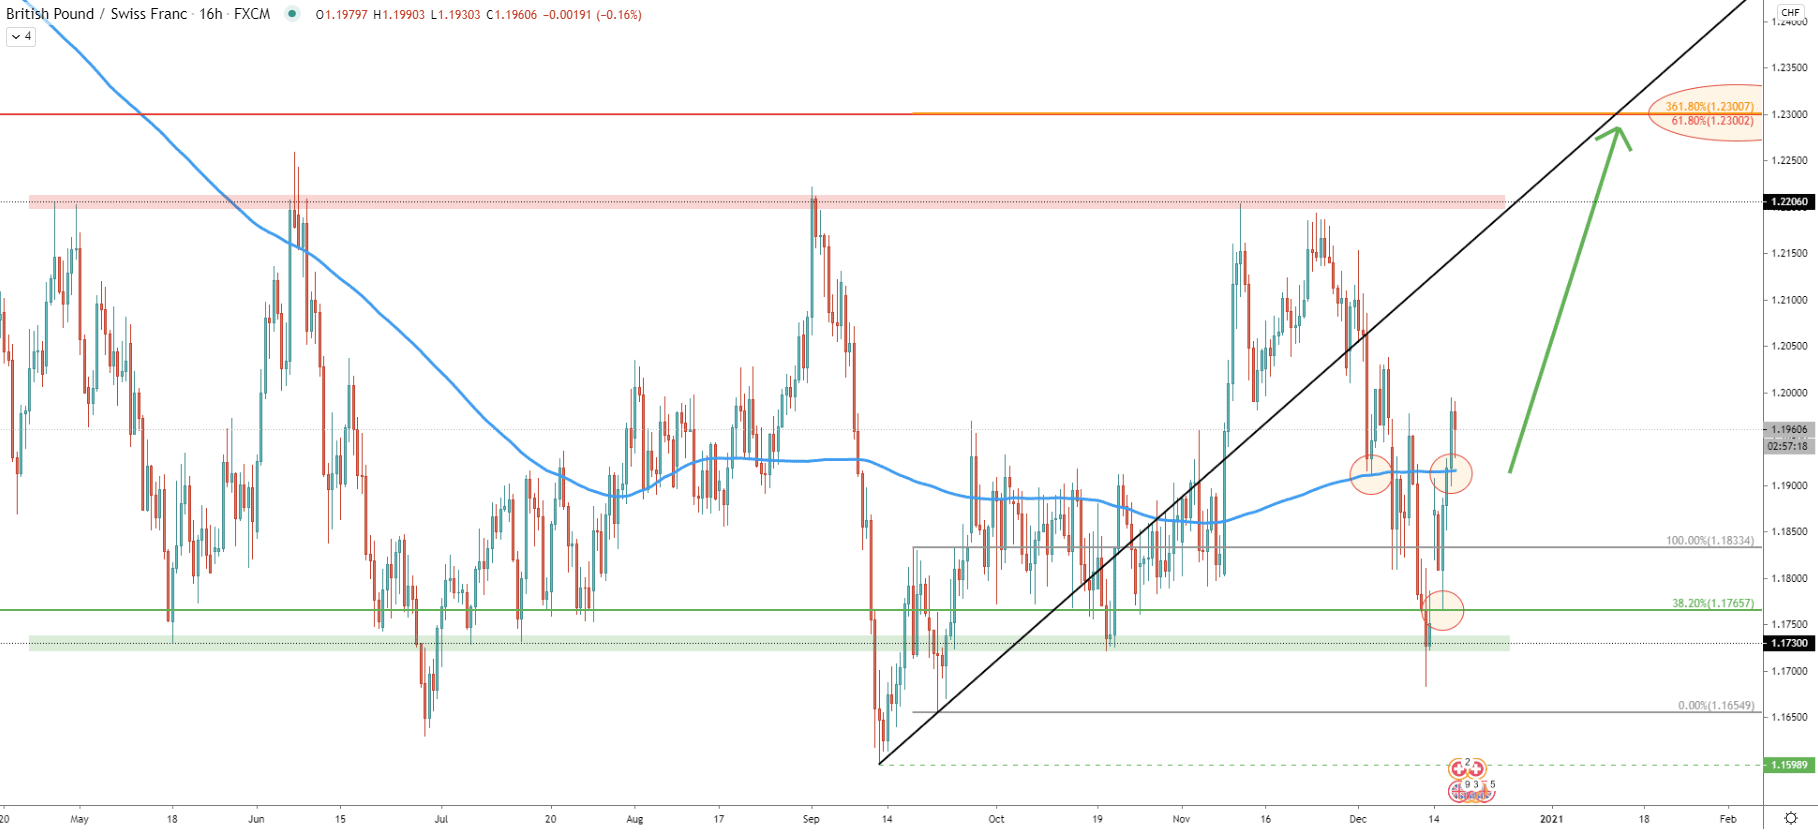
Fibonacci was applied to the first corrective move down, after GBP/CHF has bottomed out, hitting a 1.1598 low in September. It shows that the 361.8% retracement level exactly corresponds to the 61.8% Fibs at 1.2300. Also, the average-price uptrend trendline is crossing with the 1.2300 resistance at the beginning of Janurally. Perhaps this could be the time when GBP/CHF will approach this resistance area.
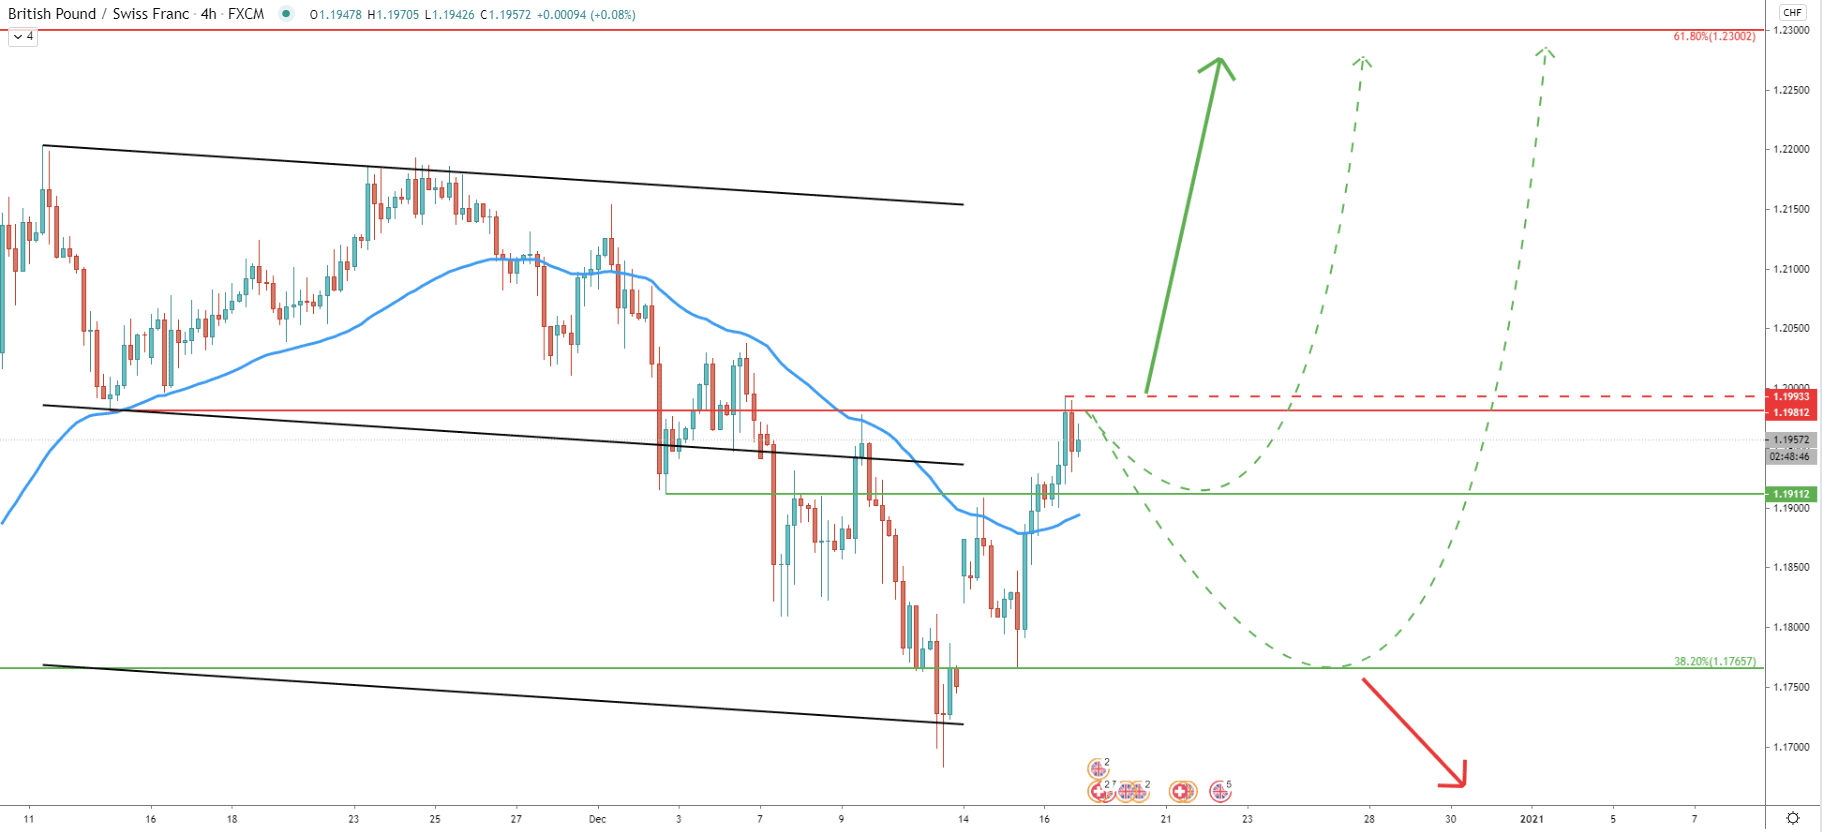
On the 4-hour chart, when GBP/CHF bottomed out, the price has reached and bounced off the lower trendline of the extended descending channel. This could have been yet another confirmation that the price is about to reverse to the upside, whether for the short, medium, or even long-term.
But right now, GBP/CHF is facing a minor resistance at 1.1981, which today got rejected. This might result in a pullback, towards one of the previously formed supply/demand areas. The nearest is located at 1.1911, which GBP/CHF can test as long as it remains below 1.1993 high produced today. If 1.1900 psychological support will get broken, GBP/CHF can decline even further, to test 1.1765 support once again.
On the upside, a break above the 1.1993 might trigger a strong bullish wave, where the price can rise by 200+ pips in a matter of just a few days.
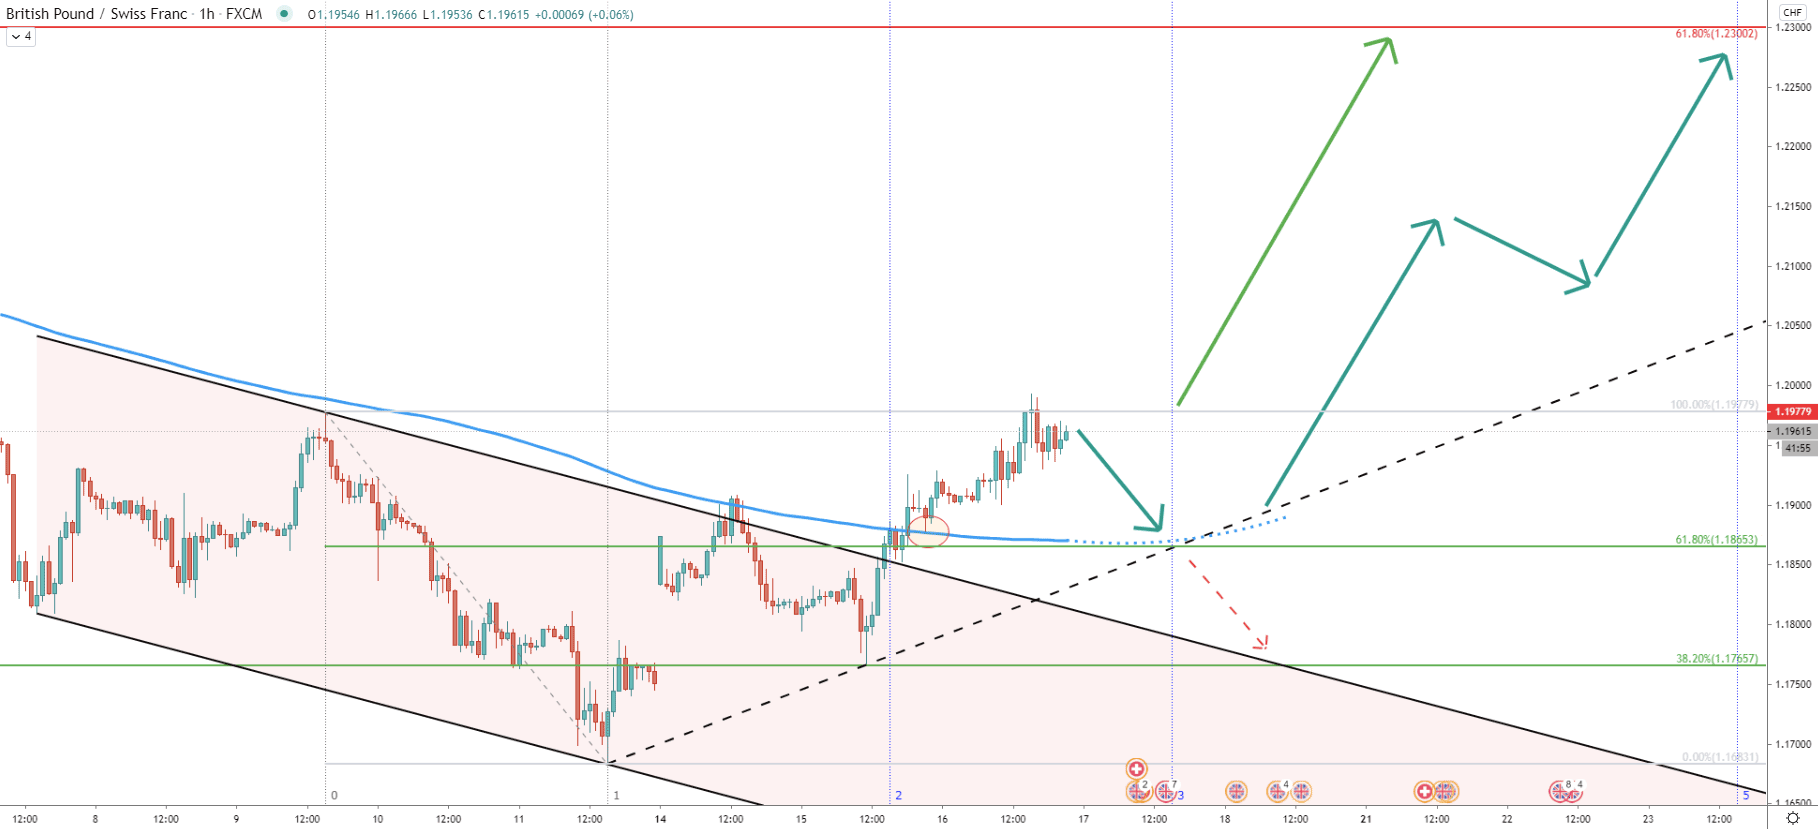
On the hourly chart, the price broke above the descending channel as well as 200 EMA. Price continued to rise, slowly but steadily. Maybe GBP/CHF will be rising at a similar pace up until the end of the month. This might be the case because Fibonacci cycle number 5 is starting on December 23, suggesting that it will take approximately one week for the GBP/CHF to reached 1.2300 resistance.
But as can be seen on the chart, the next Fibonacci cycle starts tomorrow. Up until then, there could be a downside move, to test the 61.8% Fibonacci support at 1.1853, which corresponds to the 200 EMA.
GBP/CHF has no distinguished trend when analyzed on the weekly timeframe. But considering that price has rejected the bottom of the range, where price has been stuck for months, the probability remains in favor of an upside move. GBP/CHF is expected to rise by over 200 pips, and it might take a few days or a few weeks.
As per the weekly and 16-hour chart, key resistance is located right at the 1.2300 psychological level. It is confirmed by two Fis as well as the average-price uptrend trendline, making it an important supply zone.
A per the 4-hour chart, only a break below the 1.1765 support will invalidate the bullish outlook and the price is likely to continue trending down. This is because a break below this support will confirm a break below the previous low, making the buying opportunity least attractive.
Support: 1.1911, 1.1833, 1.1765
Resistance: 1.1993, 1.2200, 1.2300


