
Published: May 1st, 2020
In this analysis, we will continue the topic of strong GBP in the coming weeks. Previously we did the analysis on EUR/GBP, where we also expect a strong Pound. Now its time to look at the EUR/GBP mirror, which is GBP/CHF, a highly correlated currency pair.
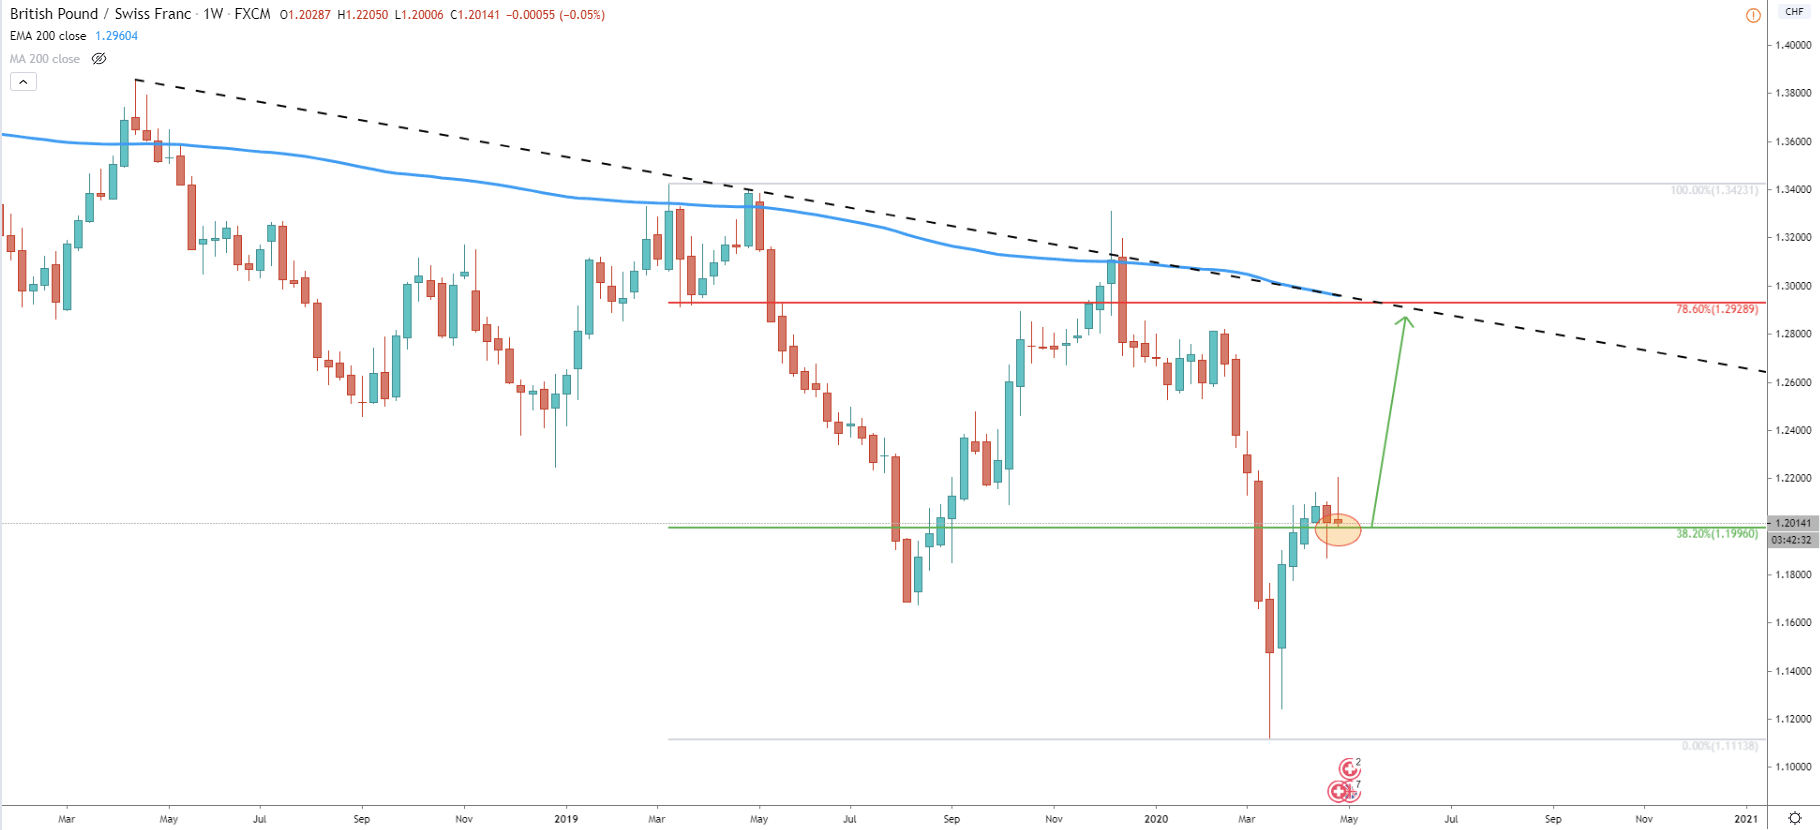
First of all, we’ll start with the highest timeframe, the Weekly chart. Here it is obvious that the long term trend remains bearish as the price continues to print lower lows and lower highs. Although GBP/CHF managed to break above the 38.2% Fibonacci resistance level at 1.1996. Actually price went above the key psychological level at 1.2000 and has reached 1.2205 high. This as quite an achievement for GBP/CHF as such key price levels usually play a very important role in further price development. Currently, GBP/CHF remains at the Fibonacci support, which could be the starting point of the uptrend continuation. As long as weekly close will remain above the 1.1869, the trend should be considered bullish in the long term. Based on the 78.6% Fibonacci retracement level, the price can be expected to rise towards 1.2929, which corresponds to the 200 Exponential Moving Average as well as the long term downtrend trendline.
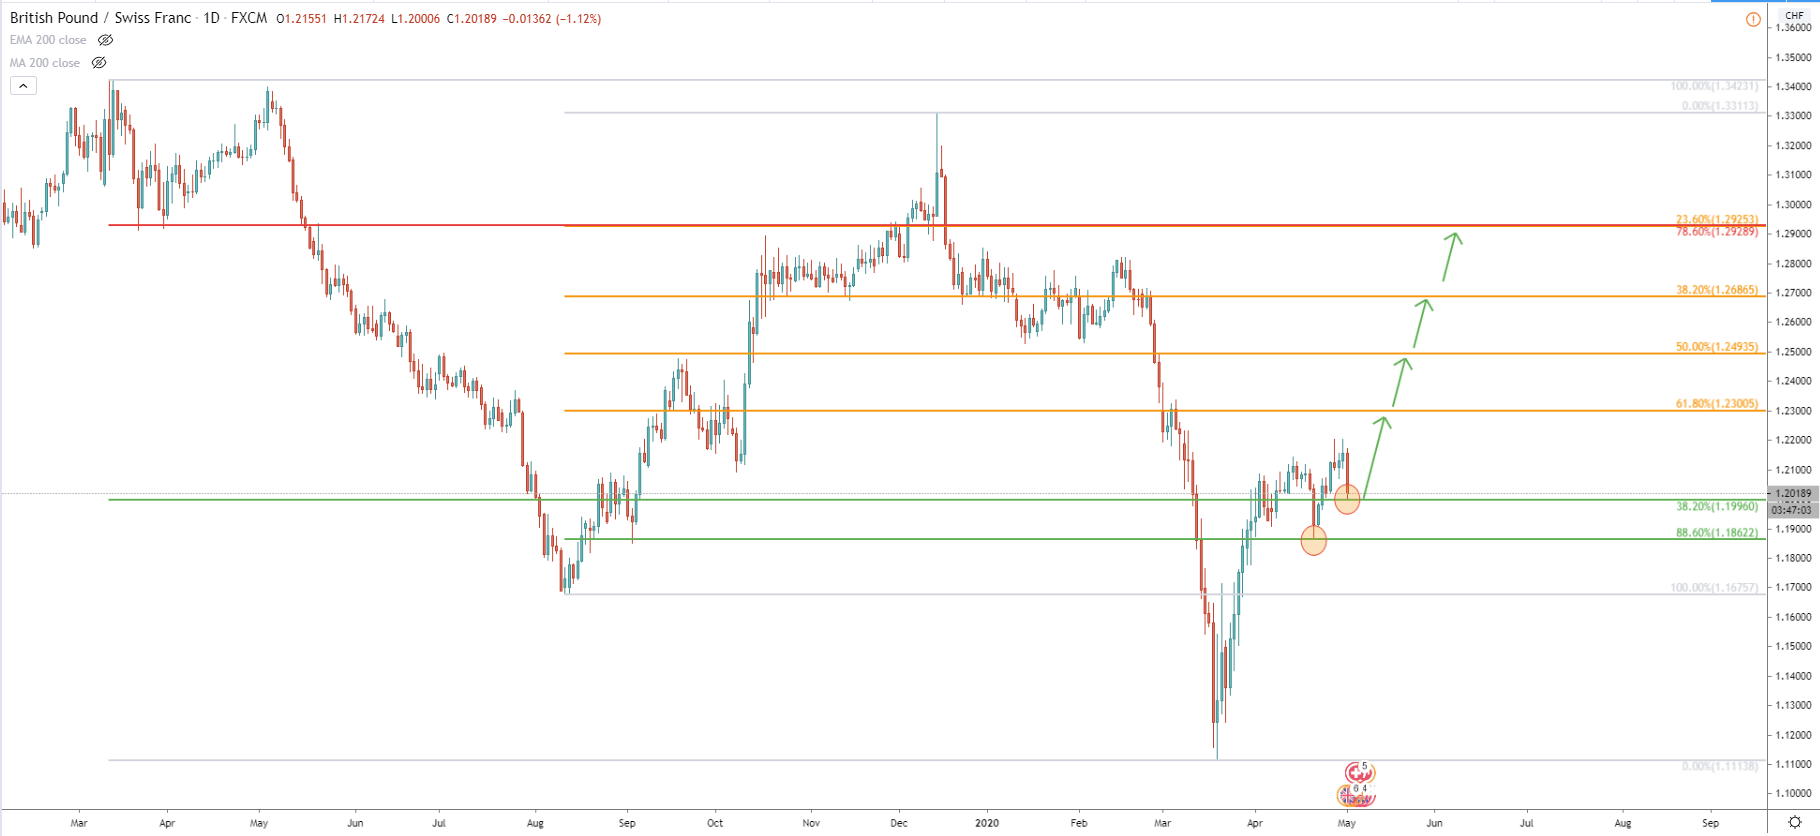
On the Daily chart, we have applied two Fibonacci retracement levels, which show us potential upside targets as well as support levels. On April 21st, GBP/CHF cleanly rejected 88.6% Fibs at 1.1862 after which price produced a new higher high. Today, on the correctional move down, GBP/CHF retraced down to the 38.2% Fibs at 1.9960, which has been also rejected cleanly. Therefore, the price can be expected to rise towards one of the Fibonacci levels as long as the current support holds. However, there is one key resistance that corresponds to two Fibs. This is 1.2929, confirmed by 78.6% and 23.6% retracement levels at the same price. It makes a potential upside move of nearly 1000 pips in the coming weeks.
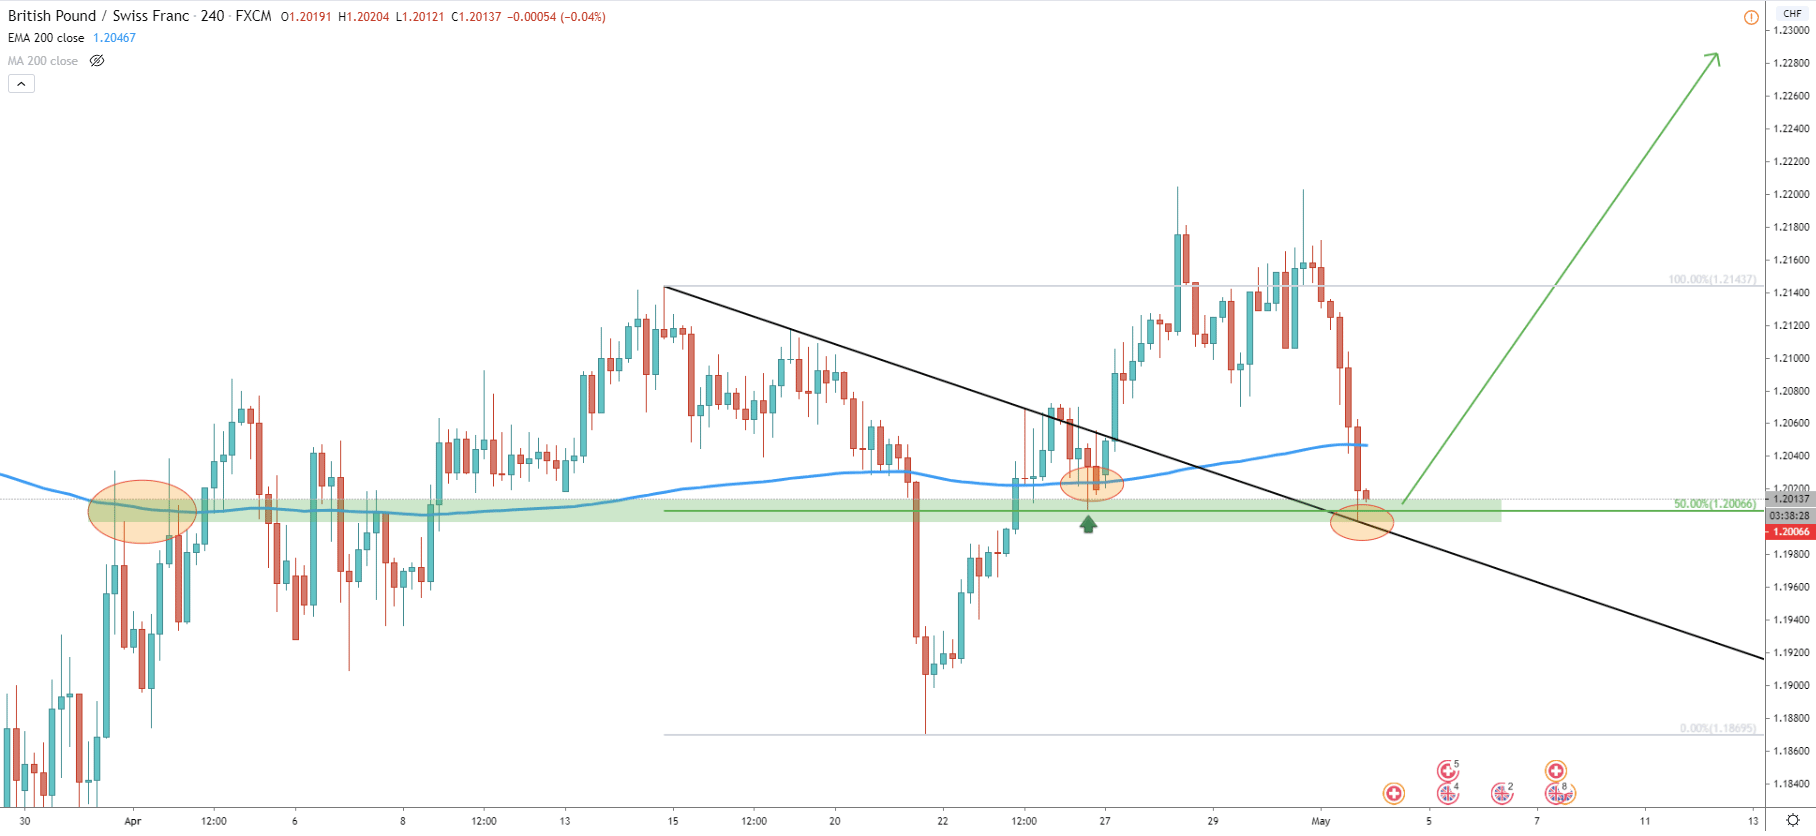
Moving on to the 4H chart, GBP/CHF broke above the downtrend trendline suggesting further rise. Correction down followed and currently the trendline is acting as the support. It is worth mentioning that GBP/CHF has reached the level where previously it formed as strong resistance. Finally, we can see that on April 24, there was a rejection of the 200 EMA along with the 50% Fibonacci retracement level. Right now GBP/CHF retraced back to this key support area, which could be very attractive in terms of buying opportunity for the long term.
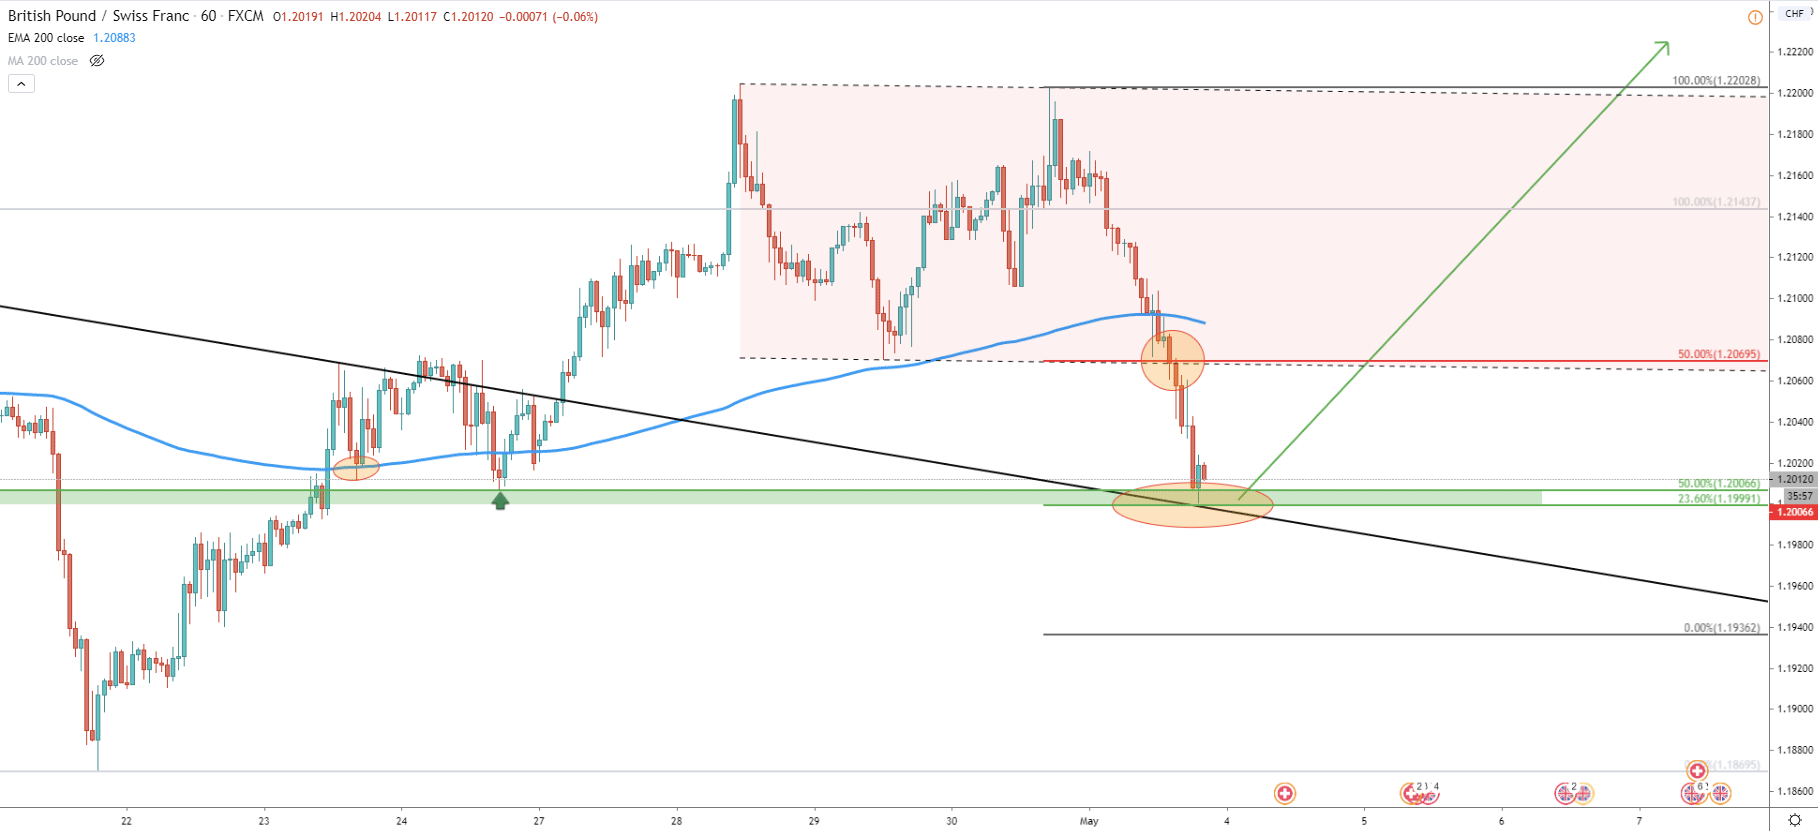
The 1H chart shows that the descending channel has been broken along with the 200 EMA. Although Fibonacci applied to the channel breakout point, where 50% placed on the channel break level, shows that price has reached 23.6% Fibs at 1.1999 and rejected it cleanly. Obviously the 1.2000 is not only a strong psychological level but also a technical support.
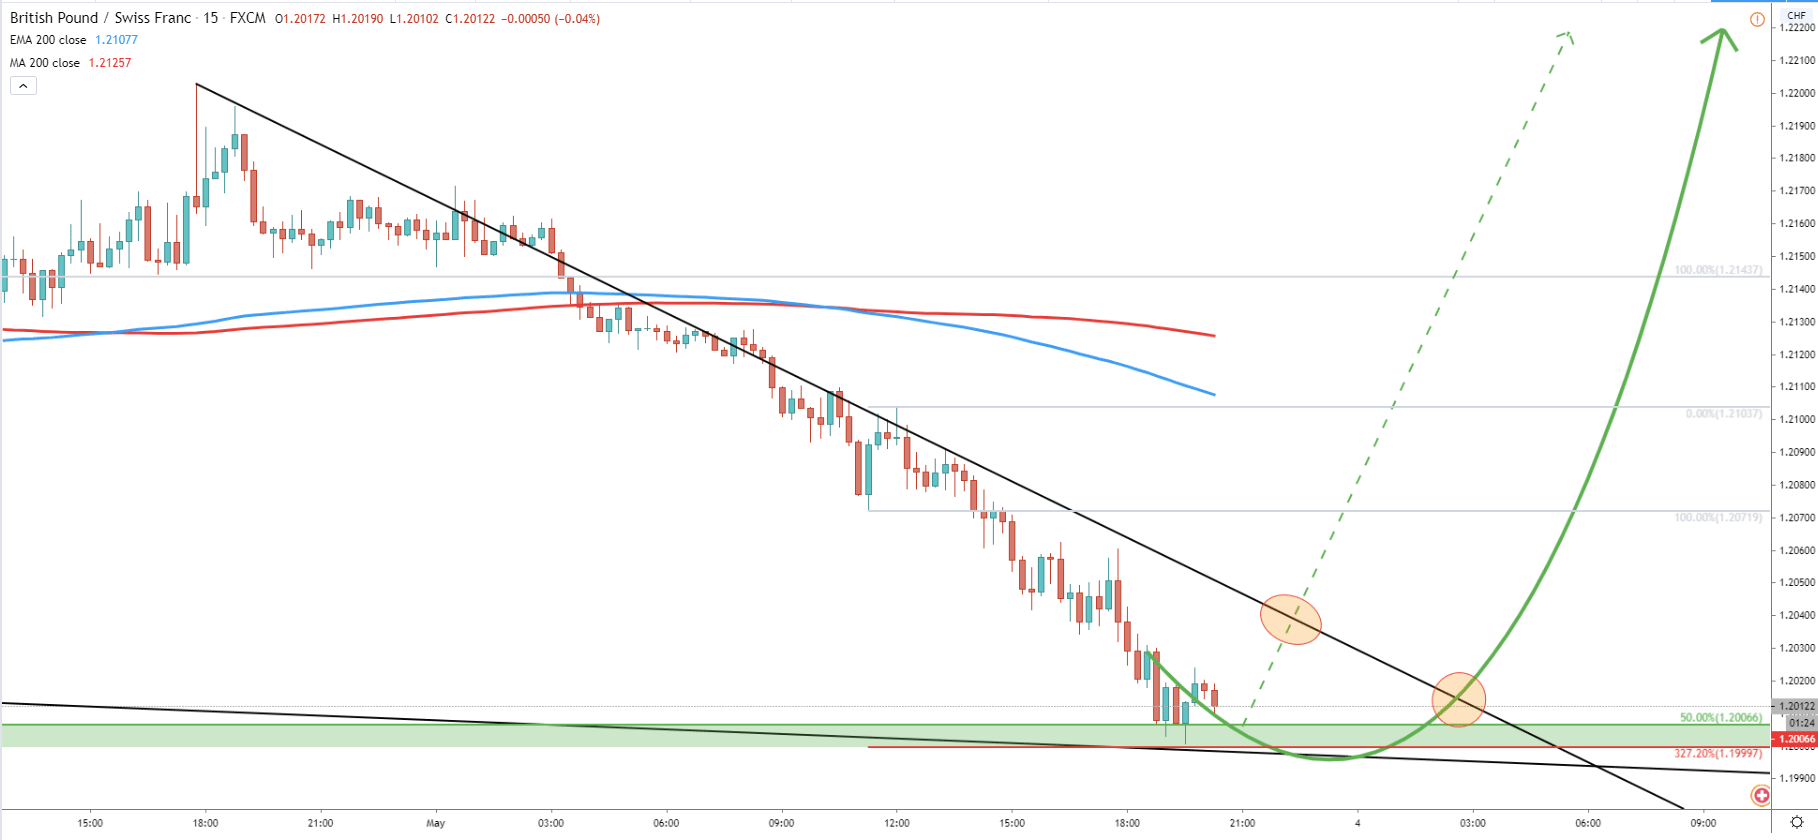
Finally comes the lowest timeframe, the 15M chart. Here price remains below the downtrend trendline as well as 200 EMA. This means that in the short term, GBP/CHF still remains bearish. Therefore, confirmation of the uptrend could be the break above the downtrend trendline, and hopefully above the 200 EMA and SMA. Perhaps it is time to wait until early next week to see some breakouts above the resistance and then act accordingly.
GBP/CHF has established a strong uptrend in the medium-term timeframe. This means that in the coming weeks we might see the price going up substantially. Although confirmation must be watched on the lower timeframes, specifically 1h or 15m timeframes.
As per the Daily chart, there are multiple upside targets. All of them correspond to the Fibonacci retracement levels.
As per the daily chart, the nearest support is located at 1.9960. If there will be daily break and close below this price, the bullish outlook can be compromised and GBP/CHF is likely to continue moving down.
Support: 1.19960, 1.1862
Resistance: 1.2300, 1.2493, 1.2493, 1.2929


