
Published: February 10th, 2020
The long and mid-term GBP/CHF outlook doesn’t show signs of positive momentum. In fact, we might witness a beginning of a long term downtrend continuation.
Today we will analyze GBP/CHF on a Weekly, Daily and 4 hours timeframes. This should help to understand potential trade setups for the week/s ahead.
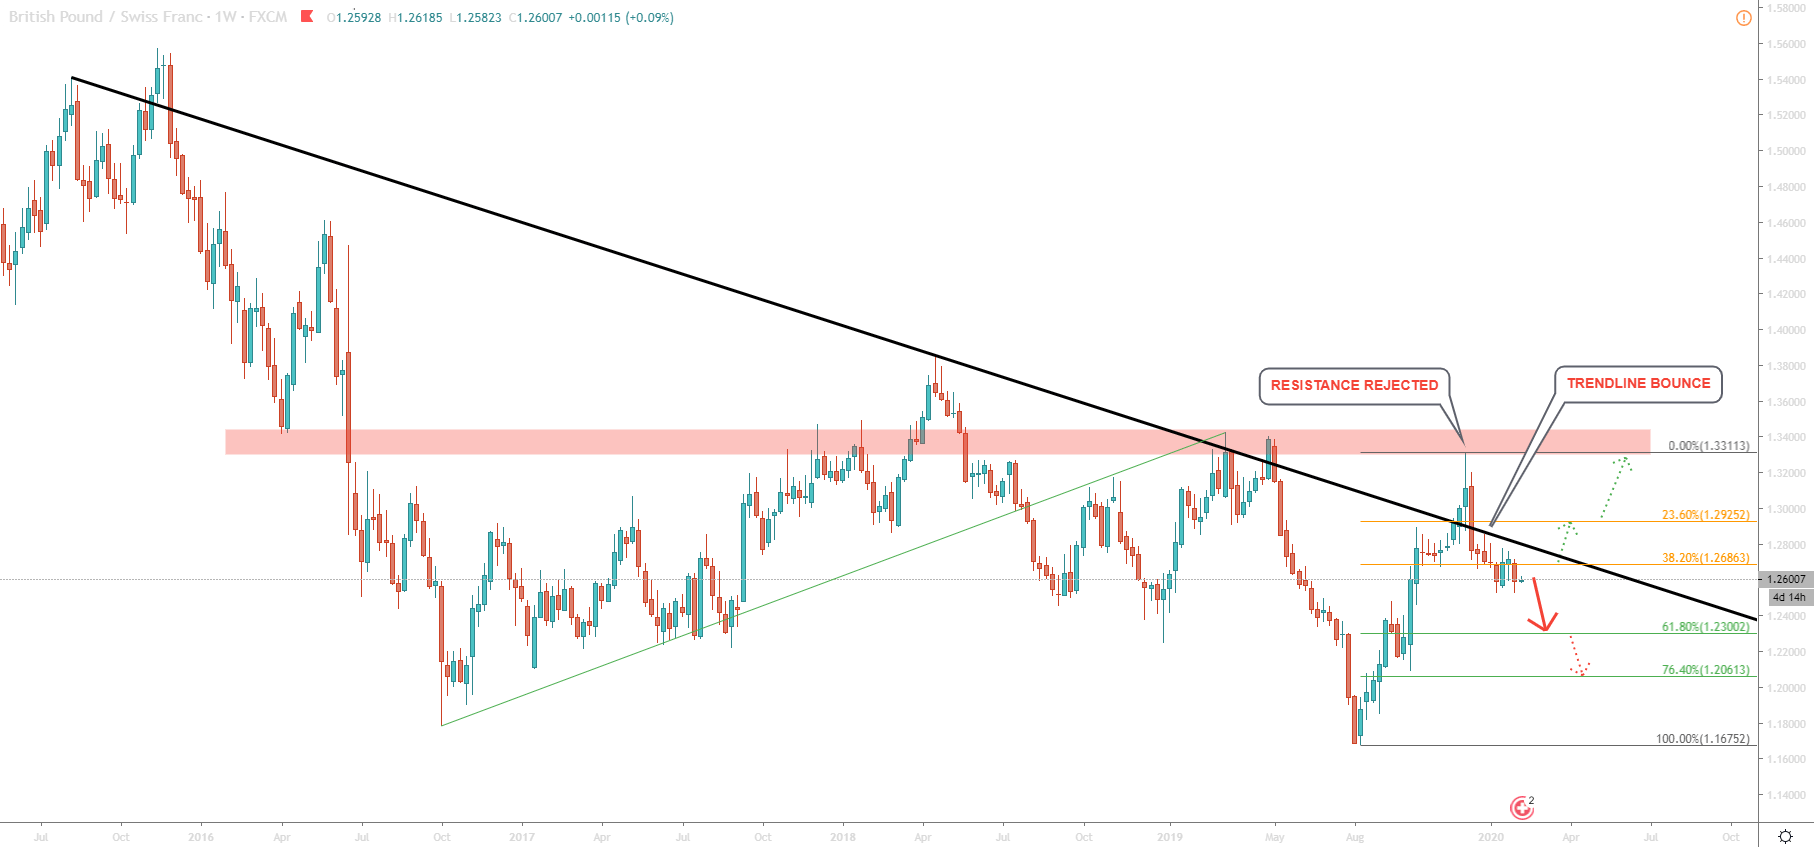
Let’s start with the highest timeframe in order to get the big picture. On a Weekly chart, specifically on 13th December 2019, GBP/CHF has rallied, reaching a 5 month high. Price has topped out at 1.3311 and the next day fell by 4.5%. This was a significant 24 hours drop showing a strong supply area and perhaps confirming price weakness in the medium or even long term.
1.3300 area proved to be a strong resistance, which has been forming since March 2016. After the December 13 spike, the price went down, back below the long term downtrend trendline. What is interesting, is that on December 19, GBP/CHF rejected the downtrend trendline, after which produced lower low and lower high.
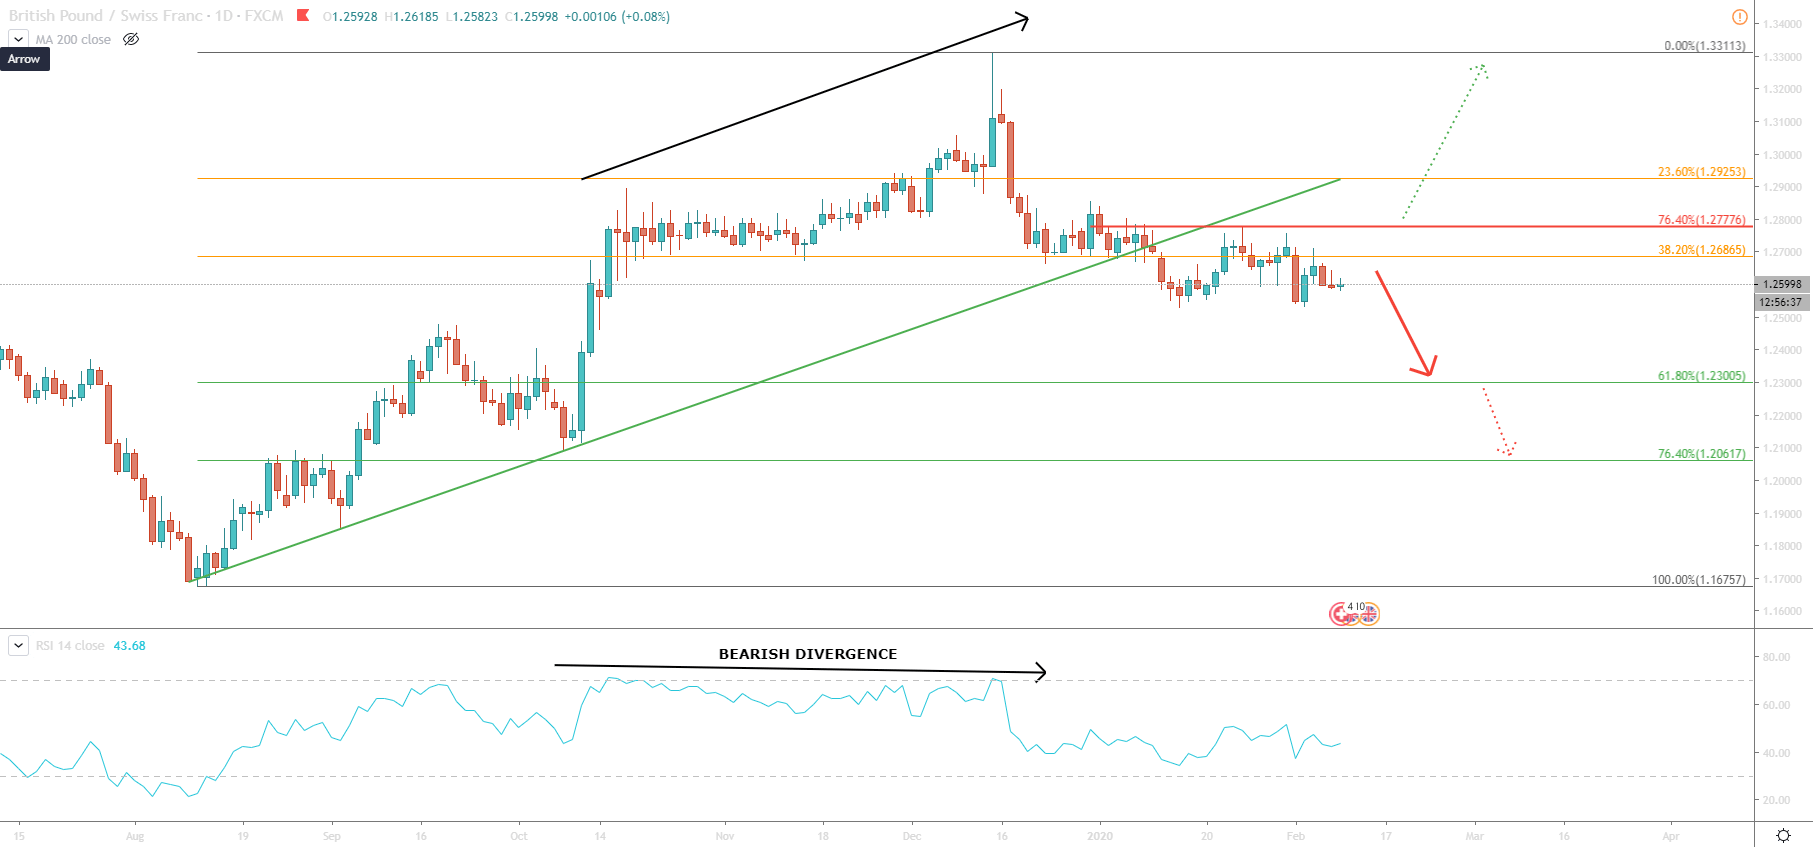
Above is a Daily GBP/CHF chart. First and foremost, RSI is showing a bearish divergence followed by a break below the uptrend trendline. On the January 15, pair produce yet another lower low, reaching 1.2530. The correction has followed, sending the price up to 1.2777 high, where it has rejected 76.4% Fibonacci retracement level applied to wave down occurred between 31 December and 15 January.
The bounce off the Fibonacci was very clean. This fact, along with the bearish divergence and the uptrend trendline break suggests a great selling pressure.
Finally, let’s observe the 4H chart. There are 2 more very interesting facts.
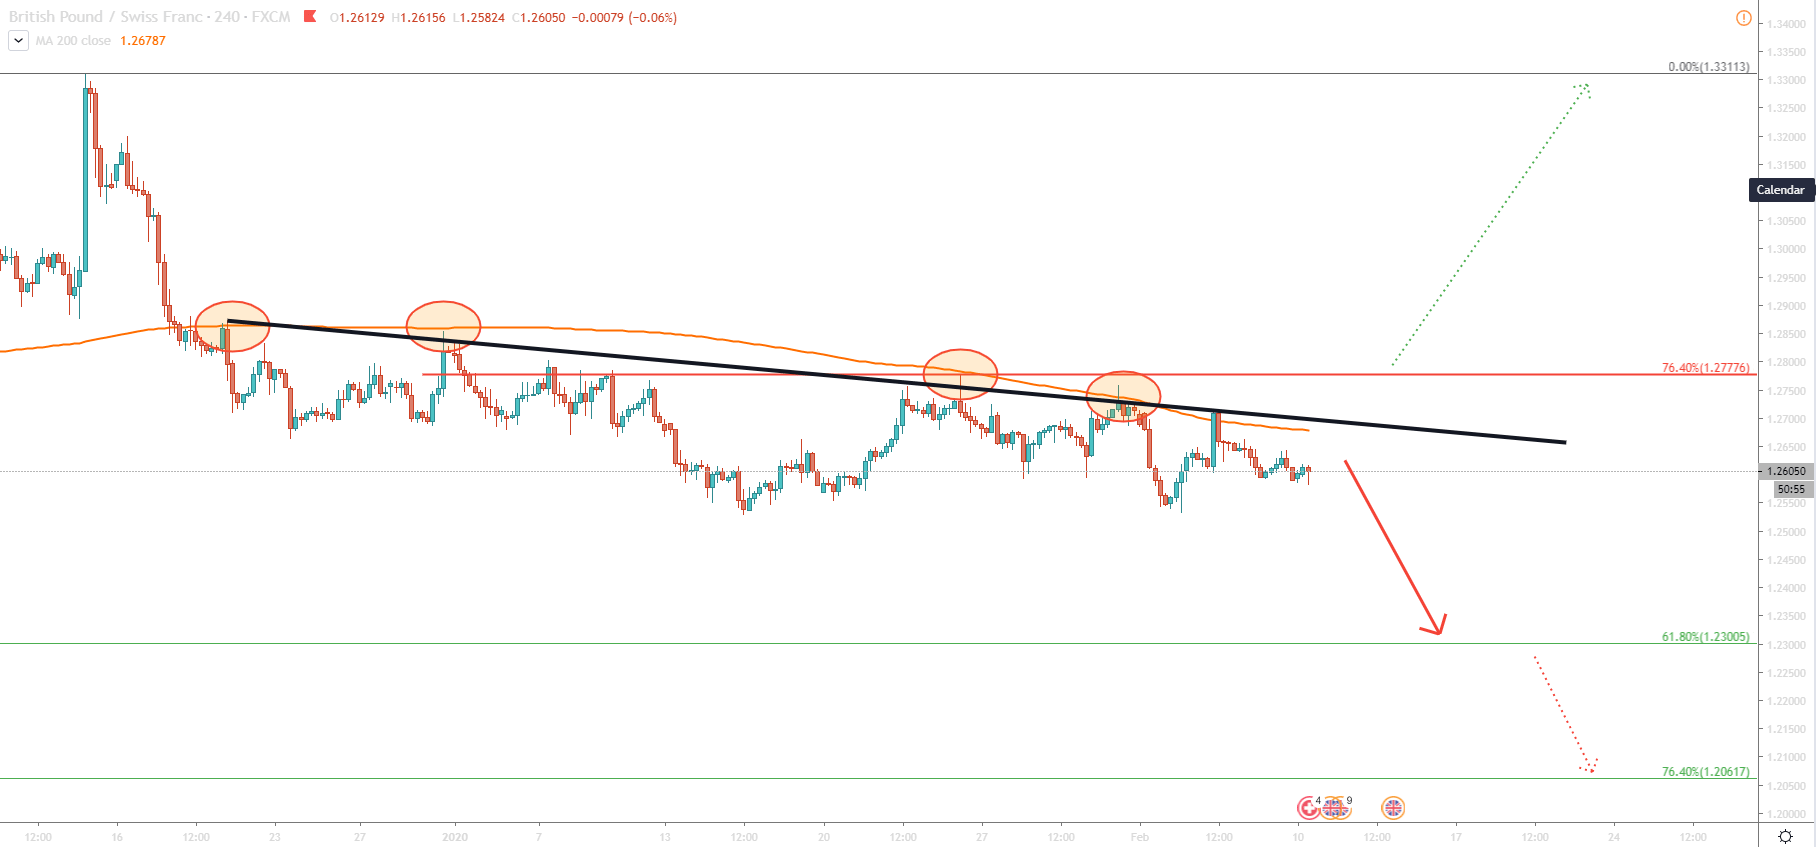
The first is price action in relation to the 200 Simple Moving Average. After the December rally, the price immediately returned back below the MA. What is grabbing the attention even further, is the multiple bounces off the Moving Average. Over the course of the last 30 days, the 200 Moving Average was rejected at least 4 times. The second fact is the continuous rejection of the downtrend trendline.
Facts are pointing out that currently, bears are in control. Every attempt to break above the resistance fails. Clearly there are more sellers than buyers and this might not end up very soon.
The nearest and perhaps next key support is located at 1.2300, which is 61.8% Fibonacci retracement level applied to wave up occurred between 9 August and 13 December. It is not only Fibonacci support but also a strong psychological round number. It could be a first strong profit-taking level for GBP/CHF sellers. At the same time, Daily break and close below can trigger more sell-off. In this scenario, the price would move lower, where the next target is seen at 1.2062, which is a 76.4% Fibonacci retracement level.
Based on the above analysis, downtrend should be treated as a dominating direction on multiple timeframes. Nonetheless, current double bottom at 1.2526 and the uptrend scenario can not be ignored. The first warning of the trend reversal would be a break above the downtrend trendline and 200 Moving Average on the 4H timeframe. This would only be a warning, but not a confirmation. The second warning is a break and close above 1.2777 resistance. The final warning and perhaps the confirmation of a trend reversal is break and close above 1.2873. This is the price level where 200MA was rejected for the first time after December 13 rally.
Support: 1.2526, 1.2300, 1.2062
Resistance: 1.2777, 1.2873, 1.3311