
Published: January 8th, 2021
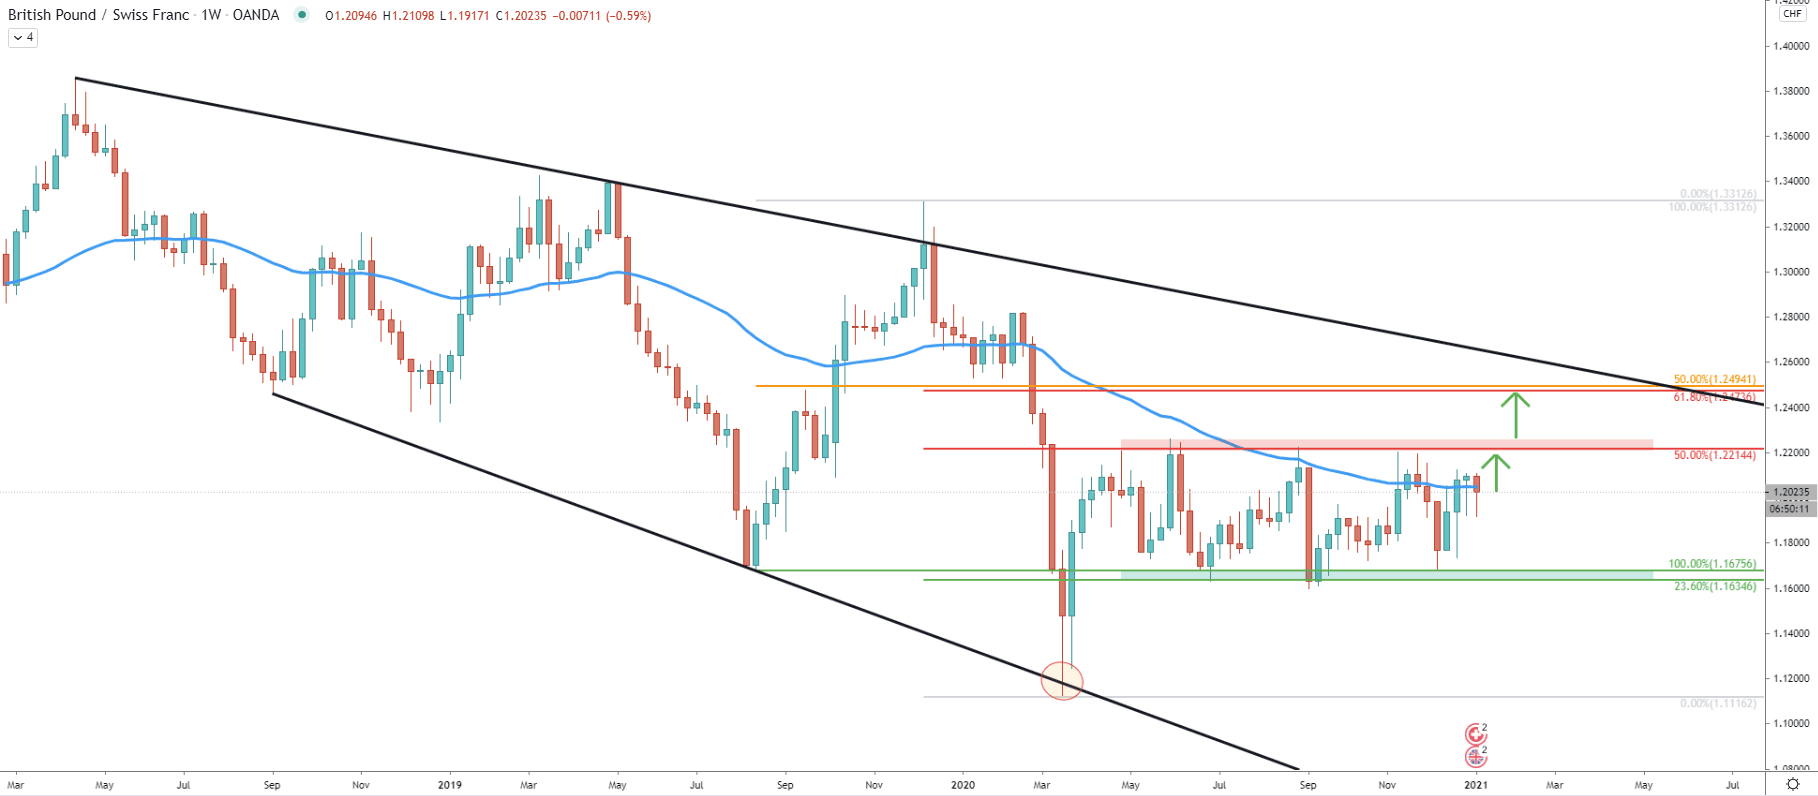
Since May 2020 GBP/CHF has been consolidating, while the price is stuck between 1.1635 support and 1.2215 resistance. The support is confirmed by the 23.6% Fibonacci retracement level, while the resistance by 50% Fibs as can be seen on the chart. Up until now, the price remains within the range and there are still no confirmations of any kind of a trend.
However, Back in March 2020, GBP/CHF has reached the bottom at 1.1116, where it rejected the support downtrend trendline. It is possible, that now price is heading towards the resistance downtrend trenldine. It can be possible that some time in the medium-term future GBP/CHF will test it, but for that, 1.2200 key resistance area must be penetrated. When/if that occurs, the price might rise towards the next resistance, which is a psychological level at 1.2500. This resistance is confirmed by two Fibs, the 50% and 61.8% retracement levels, which are located between 1.2473 and 1.2494.
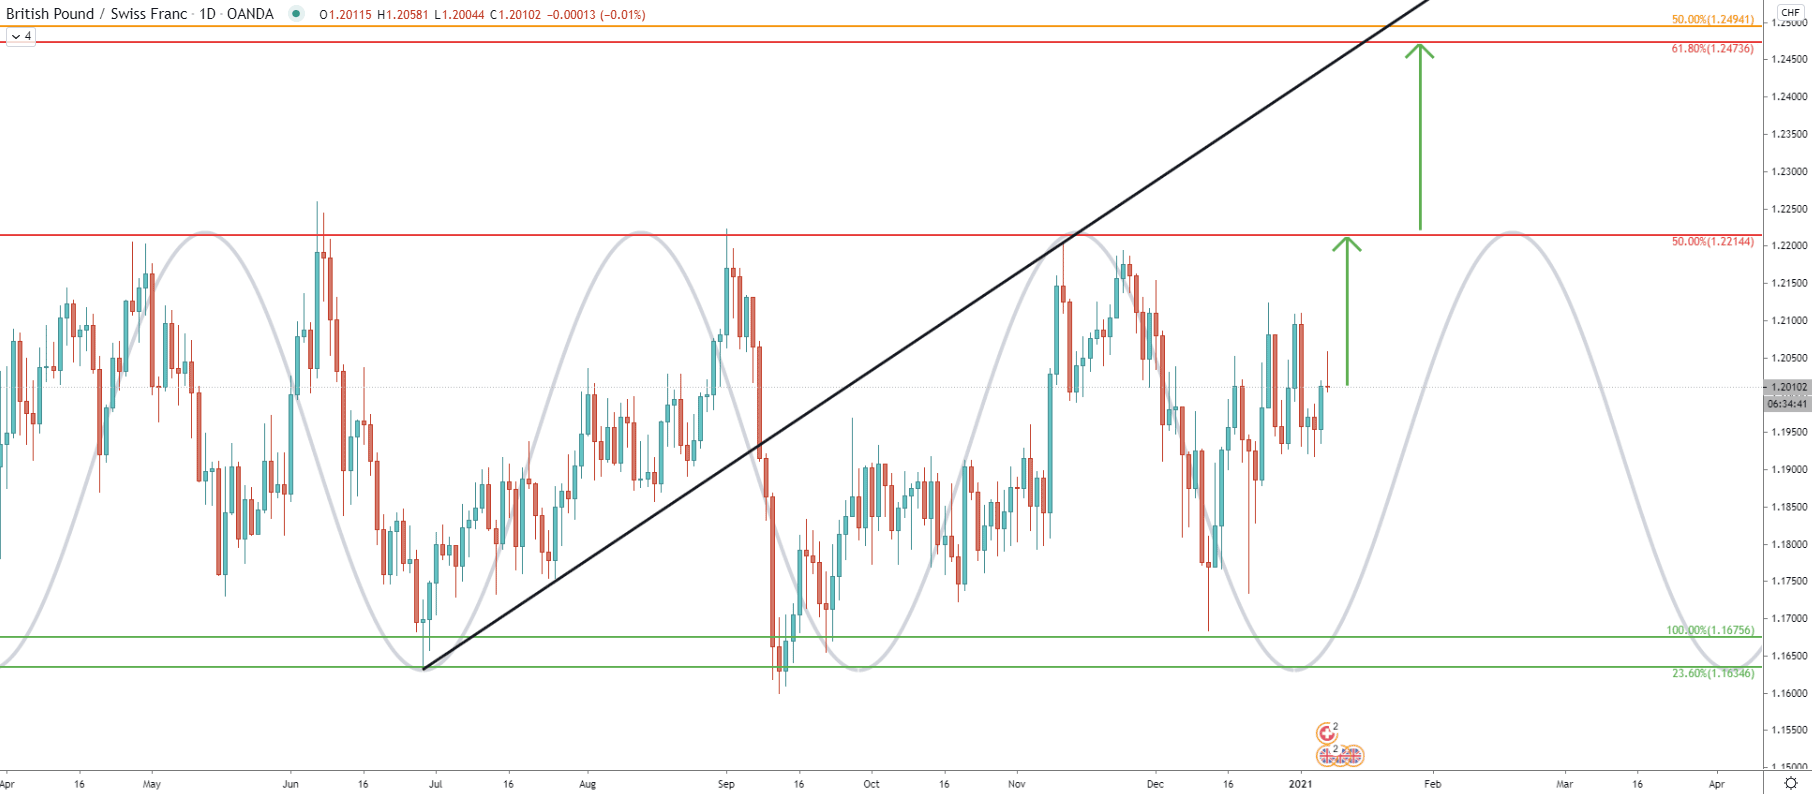
On the daily chart, we can observe the entire process of the range trading and how the price is moving through up and down cycles. It can be seen, that just recently a new bullish cycle has begun, and it might result in the continuation of the GBP/CHF increase towards the nearest resistance at 1.2214. Break and close above 1.2214 on the daily timeframe should result in an increased buying pressure, which is likely to send the price towards the 1.2500 psychological level. As can be seen, this resistance corresponds to the average price uptrend trendline, suggesting that the trend could be very fast.
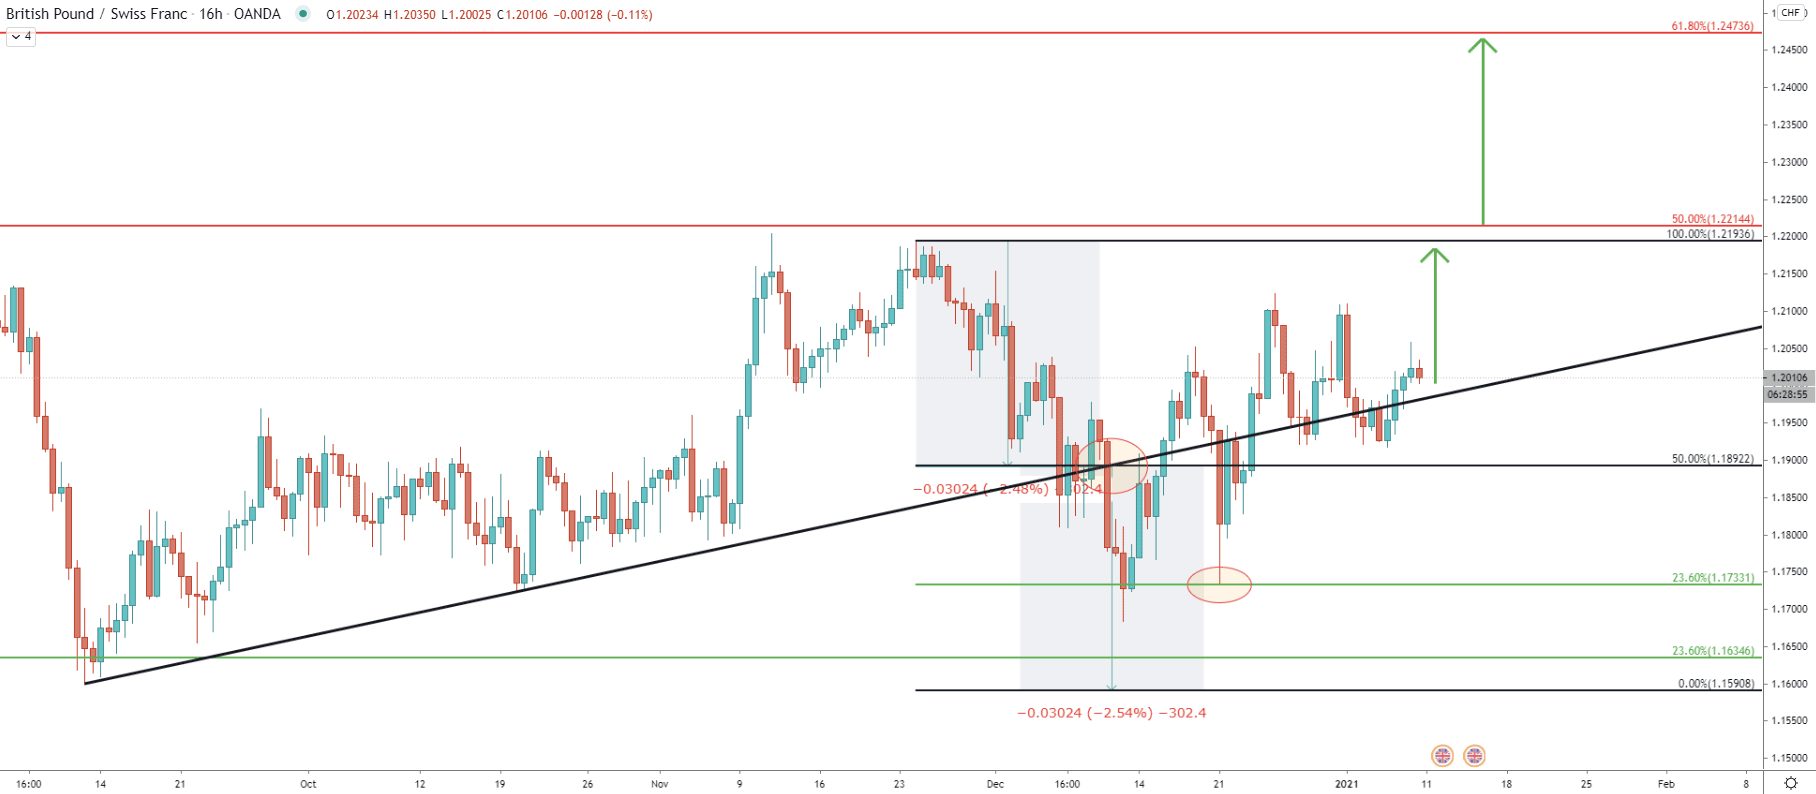
On this chart, the break below the uptrend trenldine, which occurred at the beginning of December, can be observed. Fibonacci was applied to this breakout so that 50% is placed at the breakout point. It shows that 23.6% Fibonacci support at 1.1733 was cleanly rejected, suggesting that the downside target after the breakout has been reached.
It also implies a potential trend reversal, and as can now be seen, higher highs and higher lows are starting to appear on the chart. Right now, GBP/CHF is once again above the downtrend trendline, which is acting as the support where the double bottom has been formed. Maybe it will be the beginning of an upside move, at least for a short period of time.
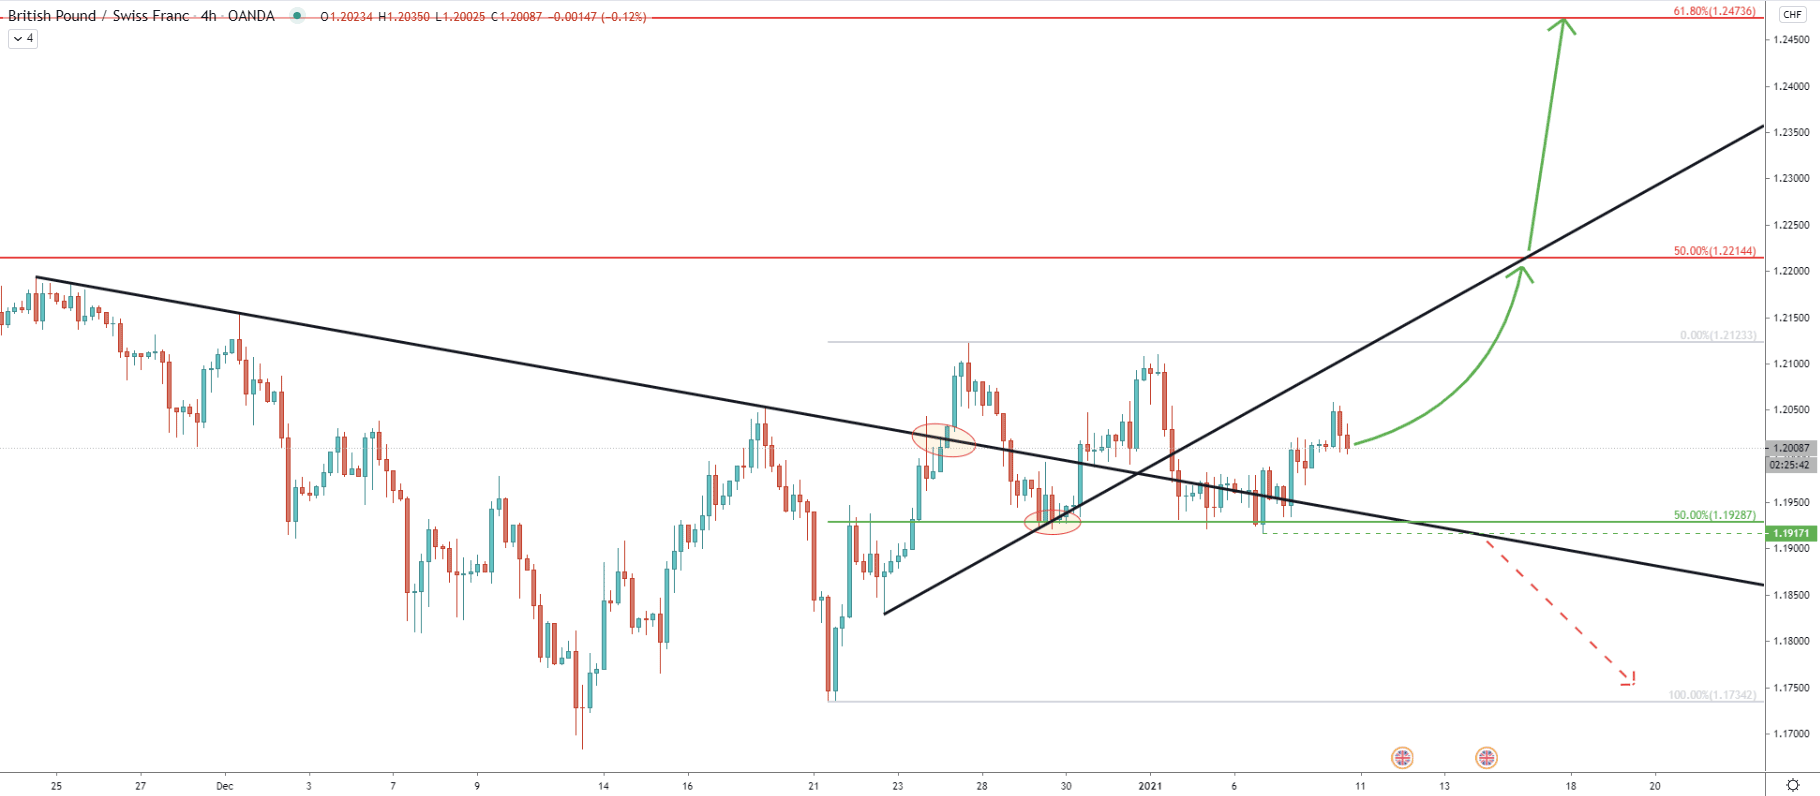
On the 4-hour chart, the price broke above the downtrend trenldine and reached 1.2123. The pullback followed which was stopped by a 50% Fibonacci retracement level at 1.1928, which was rejected twice. Because as can be seen, the price has produced a double bottom at this support. Perhaps the 1.1917 low will now play a key support role, and as long as it holds, the GBP/CHF price should be expected to rise further.
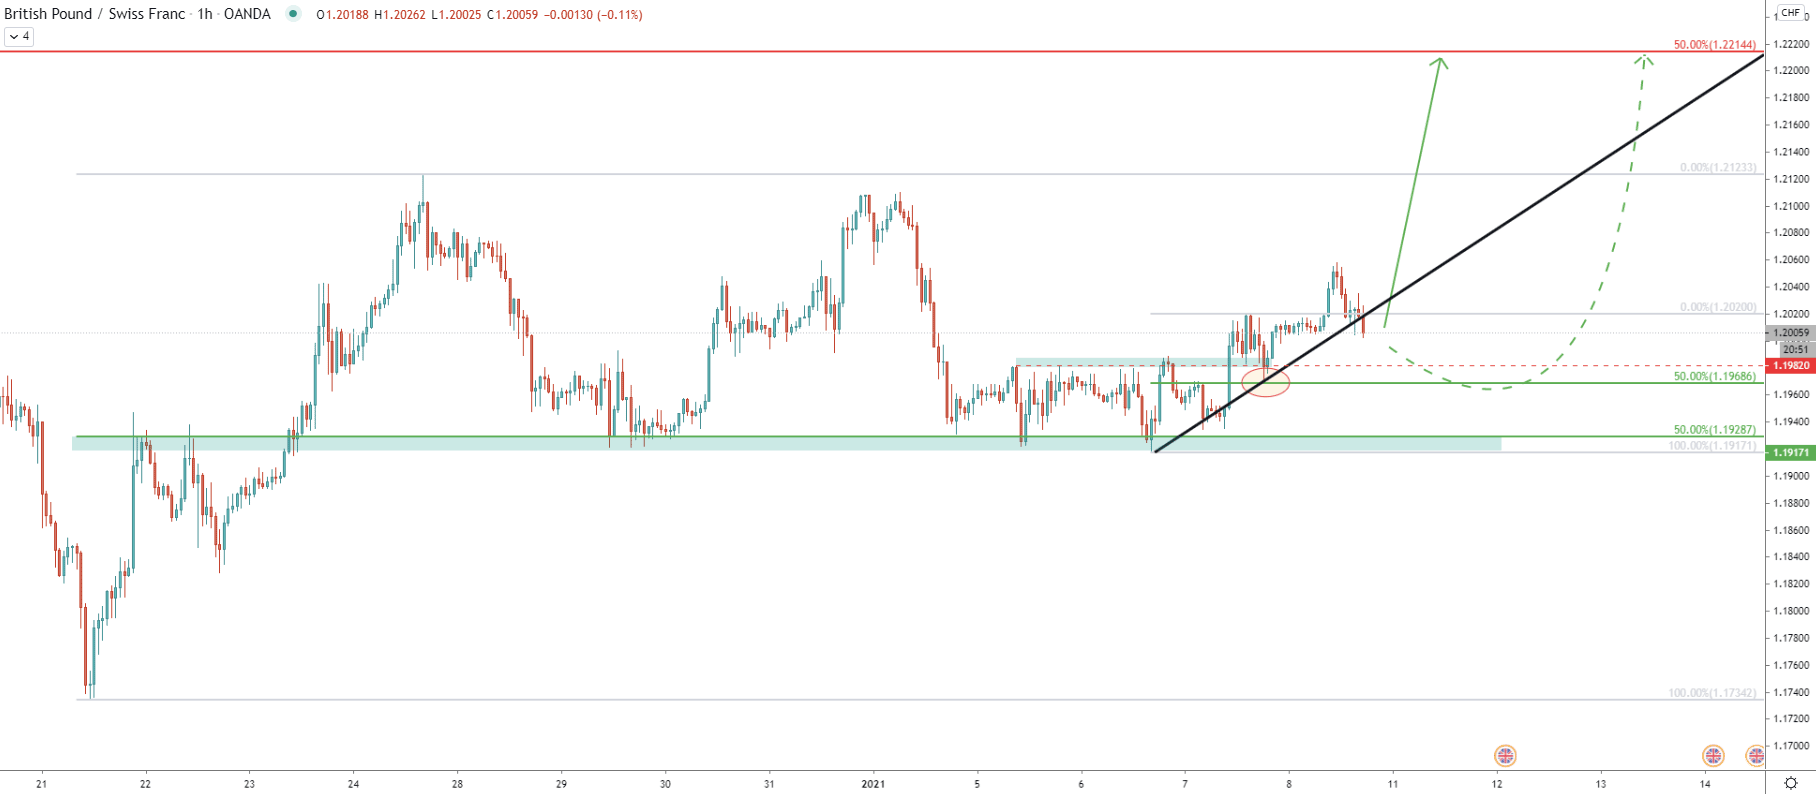
On the hourly chart, the price has framed a minor resistance near 1.1982, which got broke just recently. Yet again a pullback followed and this support area got rejected along with the 50% Fibs at 1.1968. Right now price is attempting to break below the uptrend trenldine. If it will succeed, GBP/CHF might re-test the 1.1980 support area, before/if the uptrend will continue. But if the trendline will get rejected with a 1h and/or 4h close above, the trend will remain strongly bullish in the short and medium-term.
The GBP/CHF price action is starting to favor an uptrend, disregarding the fact that in the long term it is still an ongoing consolidation phase. The price might once again rise towards the top of the range, and potentially break even higher.
As per the daily chart, the nearest and the strongest resistance is located at 50% Fibs, which is 1.2214. Once/if broken, then GBP/CHF can be expected to move towards the 1.2473, 1.2494 resistance area, which is confirmed by two Fibonacci levels.
As per the 4-hour chart, the key support is at 1.1917, as long as the price remains above this level, the uptrend should remain valid. Although the break below, will invalidate the bullish forecast and GBP/CHF will most likely move towards the 1.1700 psychological support.
Support: 1.1968, 1.1917
Resistance: 1.2123, 1.2214, 1.2500


