
Published: June 11th, 2020
In multiple previous analyses, we have mentioned weak Great British Pound against most major fiat currencies, which actually was the case during this week. But the picture might have changed, at least for one GBP related currency pairs. This is the GBP/CAD pair, which definitely shows some bullish potential on multiple timeframes. Time to move on to in-depth technical analysis on multiple timeframes. Enjoy!
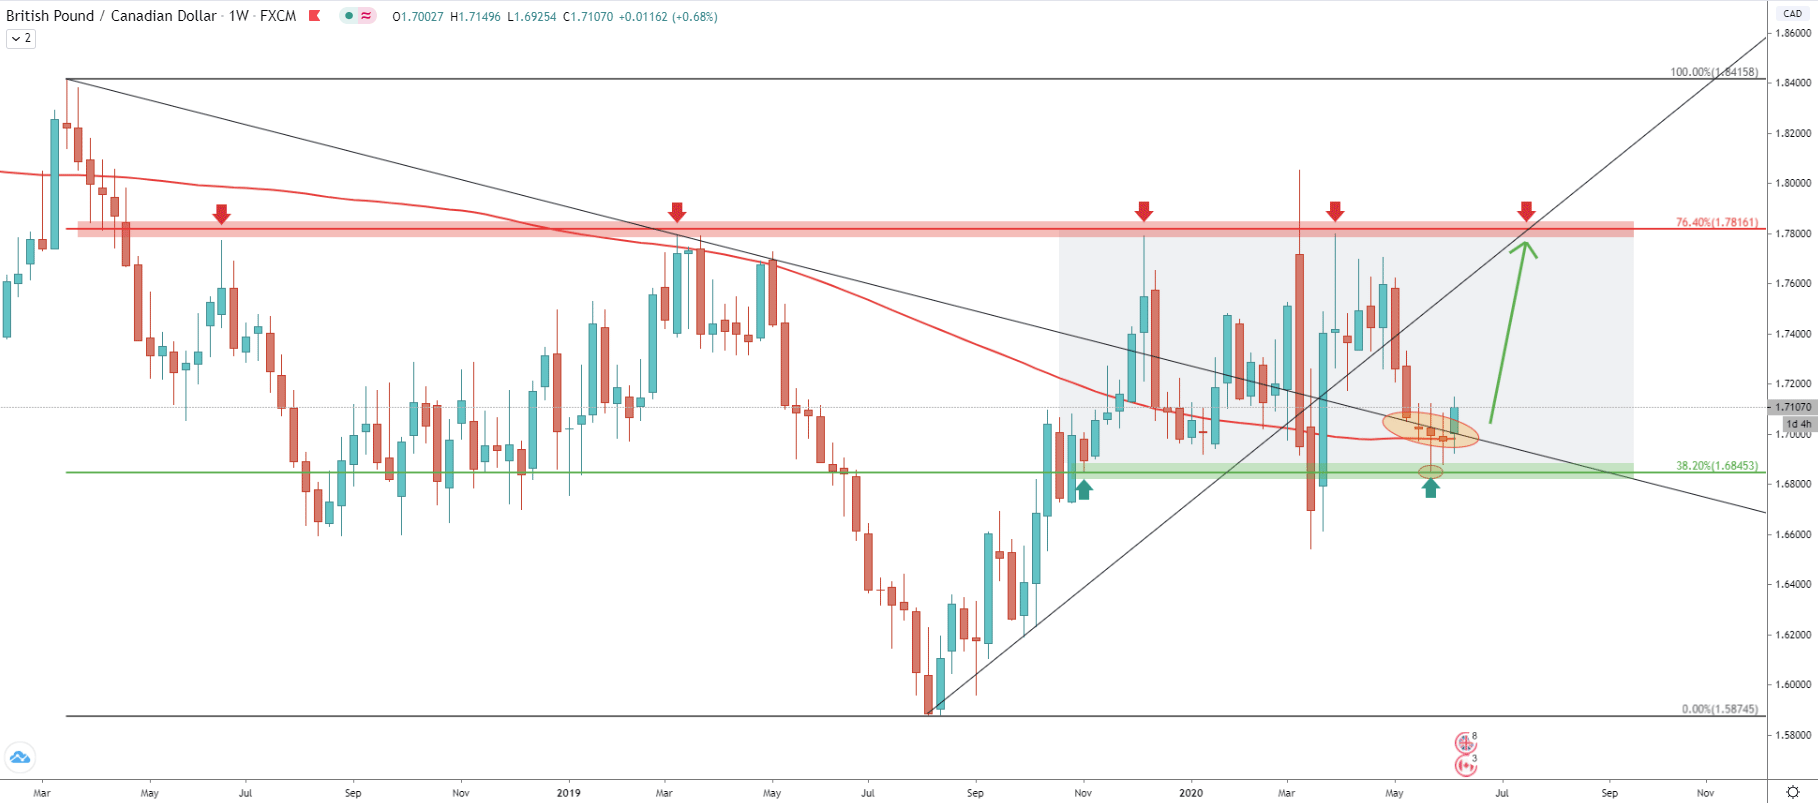
The weekly chart always gives a good long term price perspective and makes it much easier to plan medium and short term trades. Here we have a downtrend from March 2018 till August 2019. The Fibonacci retracement indicator was applied to this downtrend in order to determine support and resistance levels. Recent price action shows that a 38.2% retracement level at 1.6845 has acted as a strong demand zone because as we can see, it was rejected cleanly. In regards to the resistance, there were multiple bounces off the 1.7816 price area, where 76.4% retracement level is located. It makes it a key long term resistance as well as the potential upside target for buyers in the coming days or even weeks.
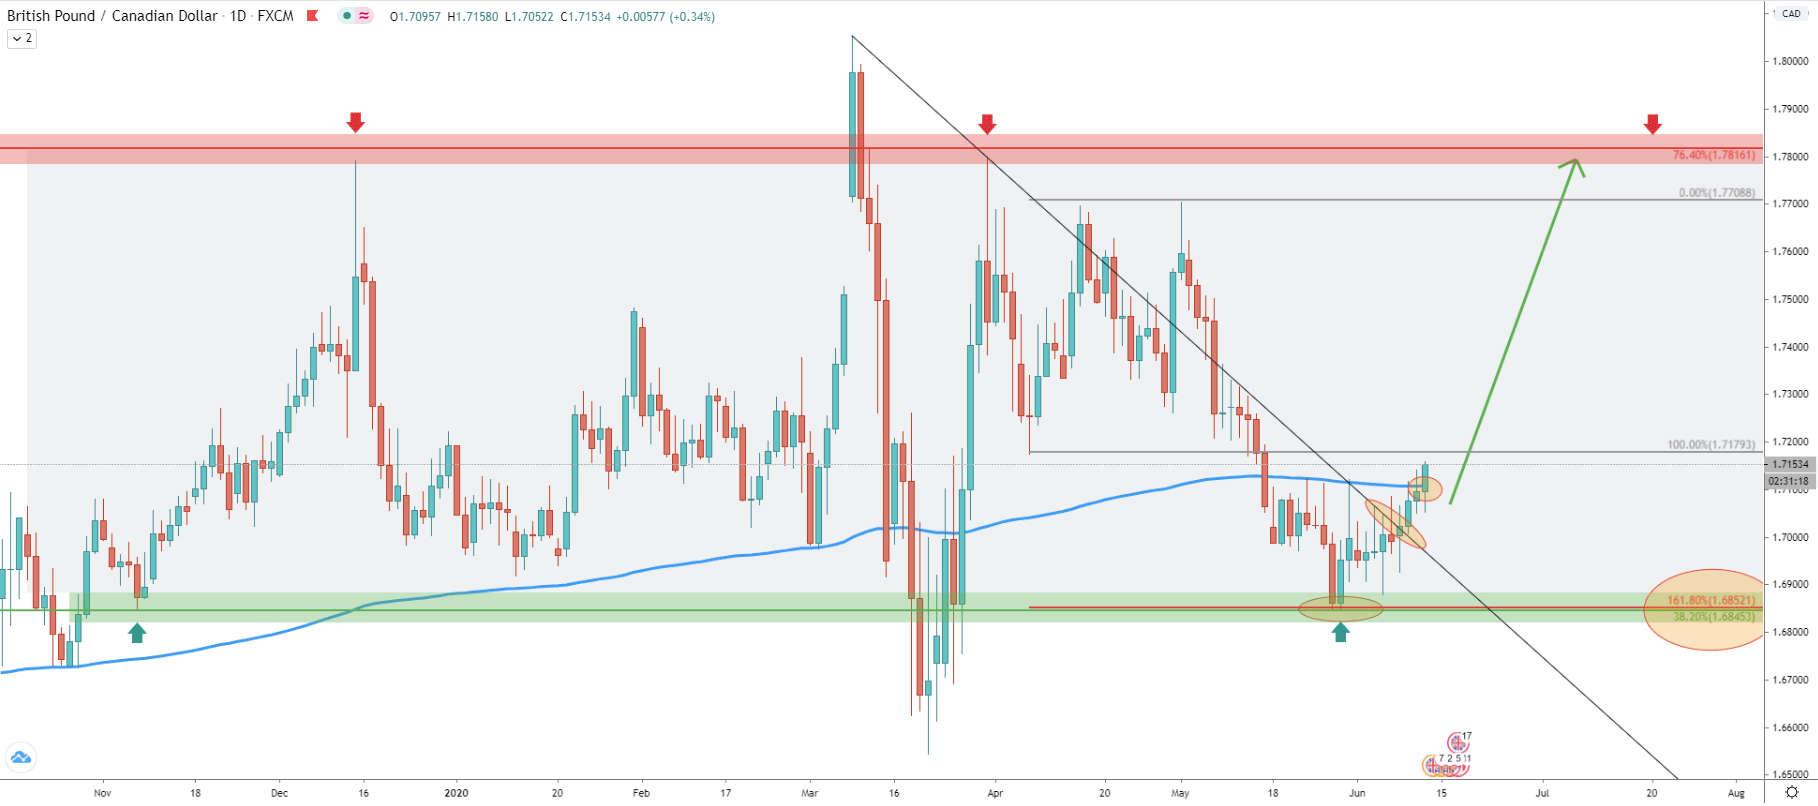
Moving on to the most popular timeframe, the Daily chart. It becomes very obvious that price has stuck between the 1.7800 resistance and 1.6850 support areas, which are confirmed by Fibonacci retracement levels. We have applied Fibonacci indicator to the first corrective wave up, after the most recent rejection of the 1.7800 resistance area. It shows that the 161.8% retracement level corresponds precisely to the 38.2% Fibs as per the Weekly chart. It makes this support level extremely important and a very strong demand area for long term buyers. Perhaps it is the reason why we saw a clean rejection and price increase during the past week.
But what is more important is the break above the 200 Exponential Moving Average, which could be the final confirmation of an incoming uptrend. However, we need to wait and see the daily closing price. And if it will be above the 1.7140 yesterday's high, then the uptrend might be confirmed. It is also worth mentioning that GBP/CAD broke above the downtrend trendline, which was the first confirmation of an incoming upswing. So, perhaps GBP/CAD is ready to initiate an uptrend?
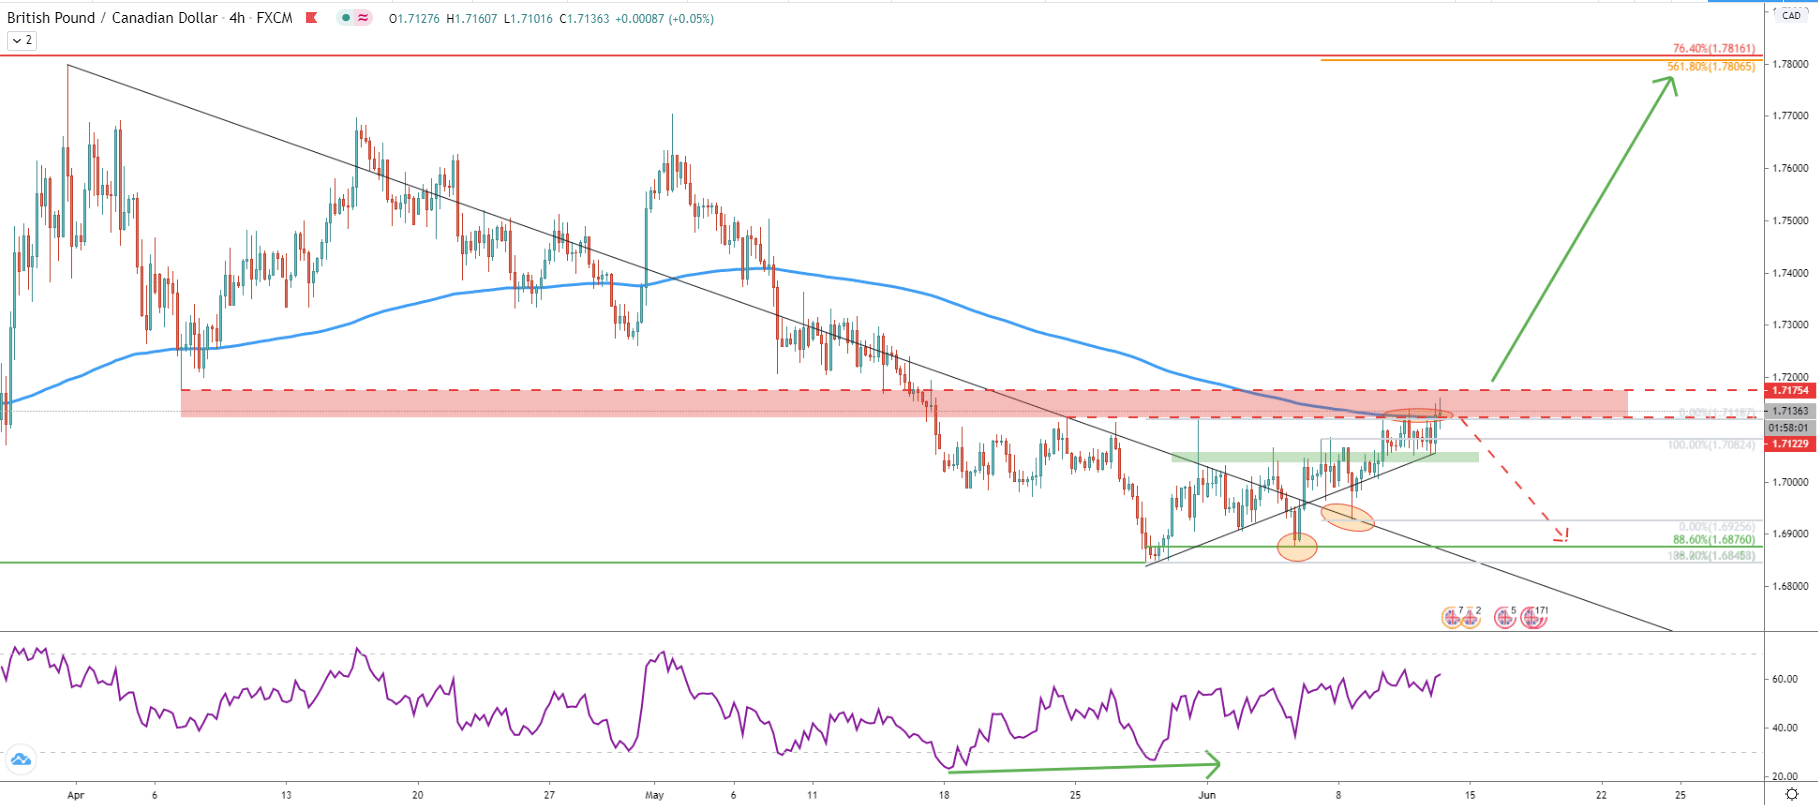
Moving on to the 4-hour chart, the price remains above the 200 Exponential Moving Average, confirming the validity of a short term uptrend. When the lower low has been established, back on May 27, a bullish divergence was formed by the RSI oscillator, suggesting a potential trend reversal to the upside. The most important factor is the very clear rejection of the 88.6% Fibonacci retracement level at 1.6876, after which price went up, produced a new higher high, and broke above the 200 Exponential Moving Average.
The uptrend trendline has been rejected. GBP/CAD attempted to break below but failed to do so while producing a low at 1.6925. We have applied Fibonacci to this rejection and now the 1.7800 resistance area is also confirmed by 561.8% Fibs. This makes the potential upside move nearly 700 pips, and it equals to 4% growth potential.
But, we must also pay attention to the resistance area formed between 1.7125 - 1.7175, which is based on previous rejection points. It is still possible that the downtrend will continue, and perhaps the safest approach for buyers is a daily break and close above 1.7175 level. Because as long as price remains in the resistance zone, there is a risk of yet another wave to the downside, potentially towards the 88.6% Fibs at 1.6876.
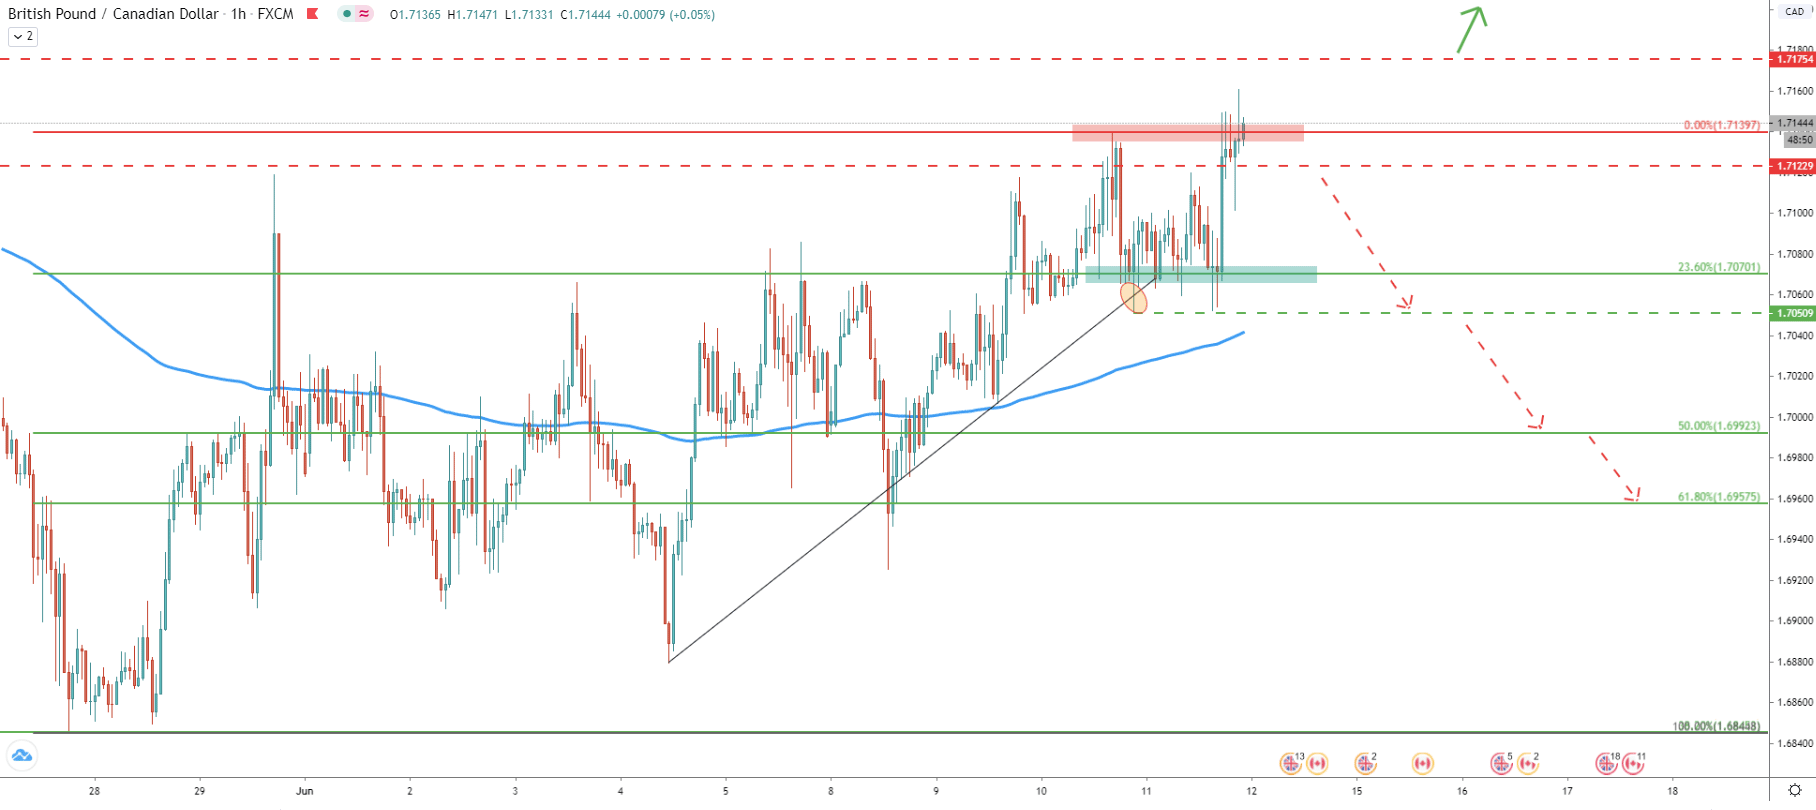
Here comes the 1-hour timeframe, which gives a shorter-term price perspective for us. The uptrend trendline has been rejected, although price produced a low at 1.7050. This makes it a strong demand area, in case the price will retrace back to that level. But if this support will get broken, further downside correction can take place. Nevertheless, we can see clear higher highs and higher lows patterns, validating the uptrend in the medium term. At the same time, a strong pullback should also be expected, and the 1.7050 area should be watched very closely for either a rejection or a breakout.
The long term price analysis shows, that GBP/CAD has no clear direction, and at the same time, the price remains at the bottom of the weekly price range. Keeping in mind that the Fibonacci support levels were rejected, the probability is in favour of the uptrend.
The upside target is seen at the top fo the weekly range-trading. It corresponds to two Fibonacci retracement levels, namely 76.4% and 561.8%, which are located near 1.7800 area. And this is not only technical but also a very strong psychological level of resistance.
There are multiple scenarios where the downtrend can continue. Although one of the most important factors would be a break and close below the 88.6% Fibonacci retracement level at 1.6876 as per the daily chart. This would immediately invalidate any bullish potential and the medium-term downtrend would be highly expected.
Support: 1.7082, 1.6876. 1.6845
Resistance: 1.7140, 1.7180, 1.7816


