
Published: February 20th, 2020
Today we will analyze GBP/CAD because there is a strong probability of an upside correction. But at the same time, it could be the beginning of a long term uptrend continuation. Having said that, it could be a risky pick, although worth the risk.
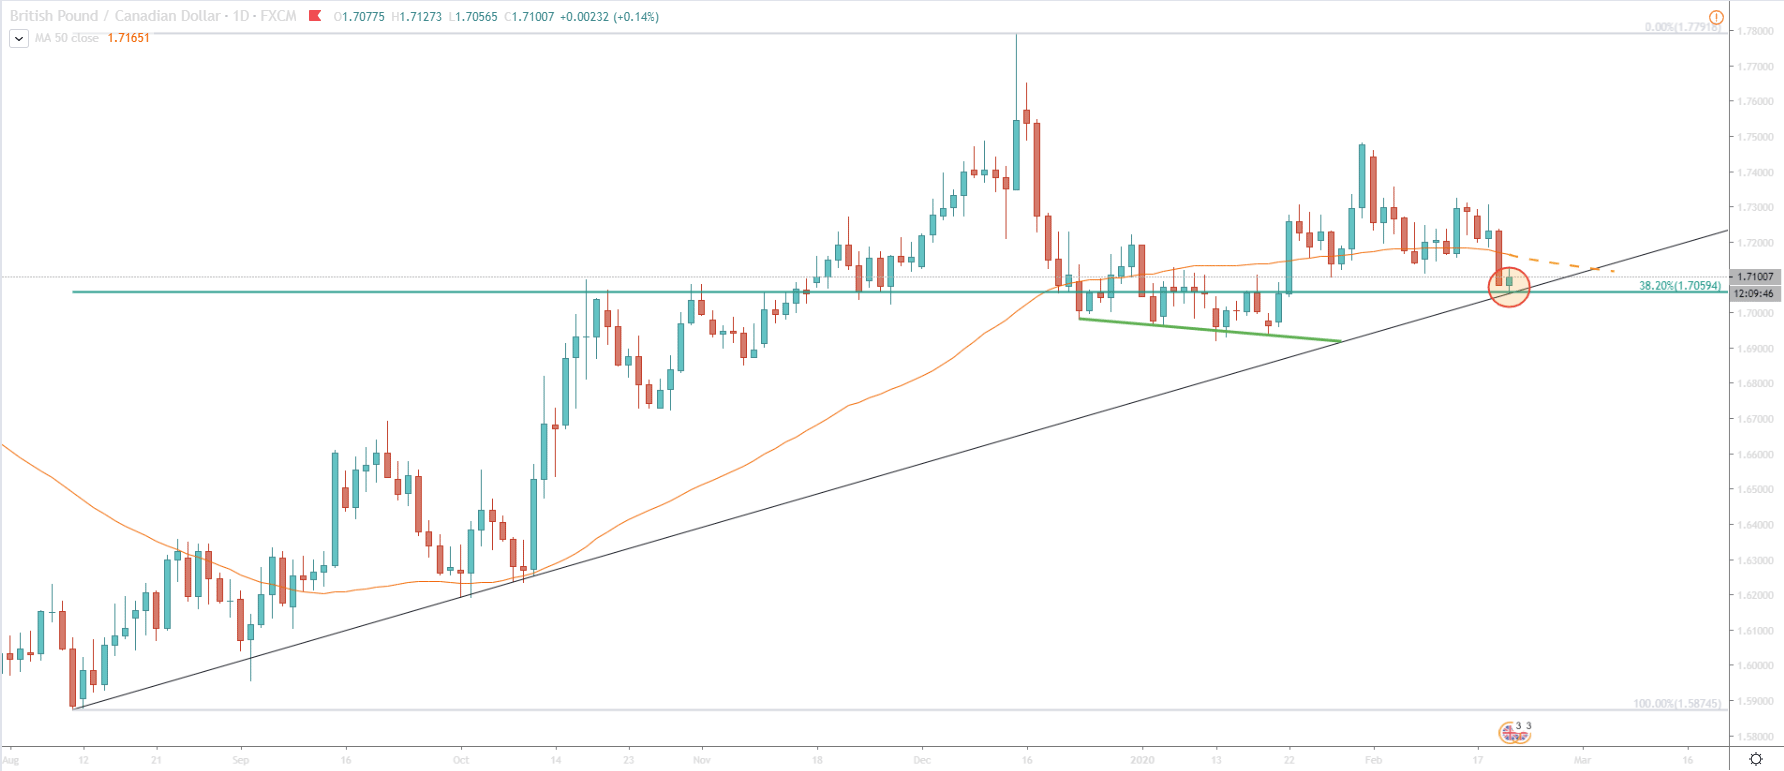
First off, we are starting with a Daily chart to see the long term price perspective. Currently, price is in the long term uptrend, which indeed could be the point where the uptrend will resume. But still, uptrend trendline rejection hasn’t been confirmed. What can be expected, is a corrective move up, towards 50 Exponencial Moving Average. The correction is expected because the price is at the support, corresponding not only with the trendline but also 32.8% Fibonacci retracement level at 1.7059.
This price also shows, that previously, there was a strong resistance around this area, especially throughout October 17- November 27, 2019. This shows the importantce of this level in the long term.
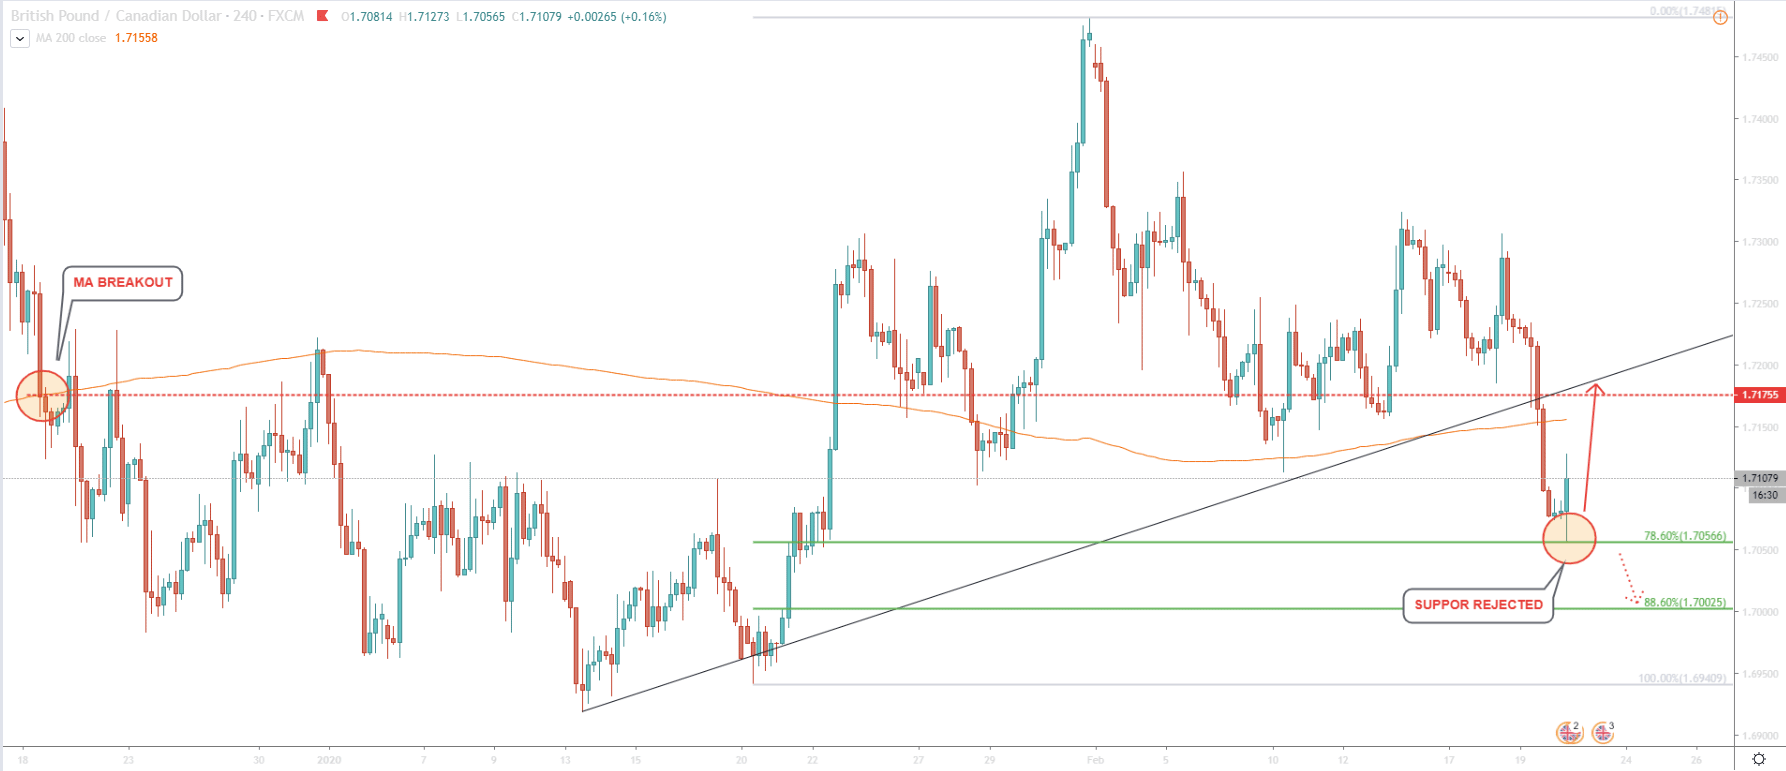
On the 4H chart, we see quite a similare picture as on the Daily chart. It is identincal in terms of the support area. On the 4H chart, GBP/CAD also rejected the Fibonacci retracement level at 1.7056. It was the 78.6% retracement and today it was rejected cleanly. As long as price remains above that level we can expect a corrective wave upwards. Price should be aiming for the 200 Exponential Moving Average as an upside target area.
At the same time, if we look back on December 18, we can see that price broke below the 200 EMA, marking the 1.7175 price as the breaking point. Looks like the psychological level at 1.7200 could be the next area of key resistance. In order to get a more precise vision of the possible correction, let’s analyze the 1H chart.
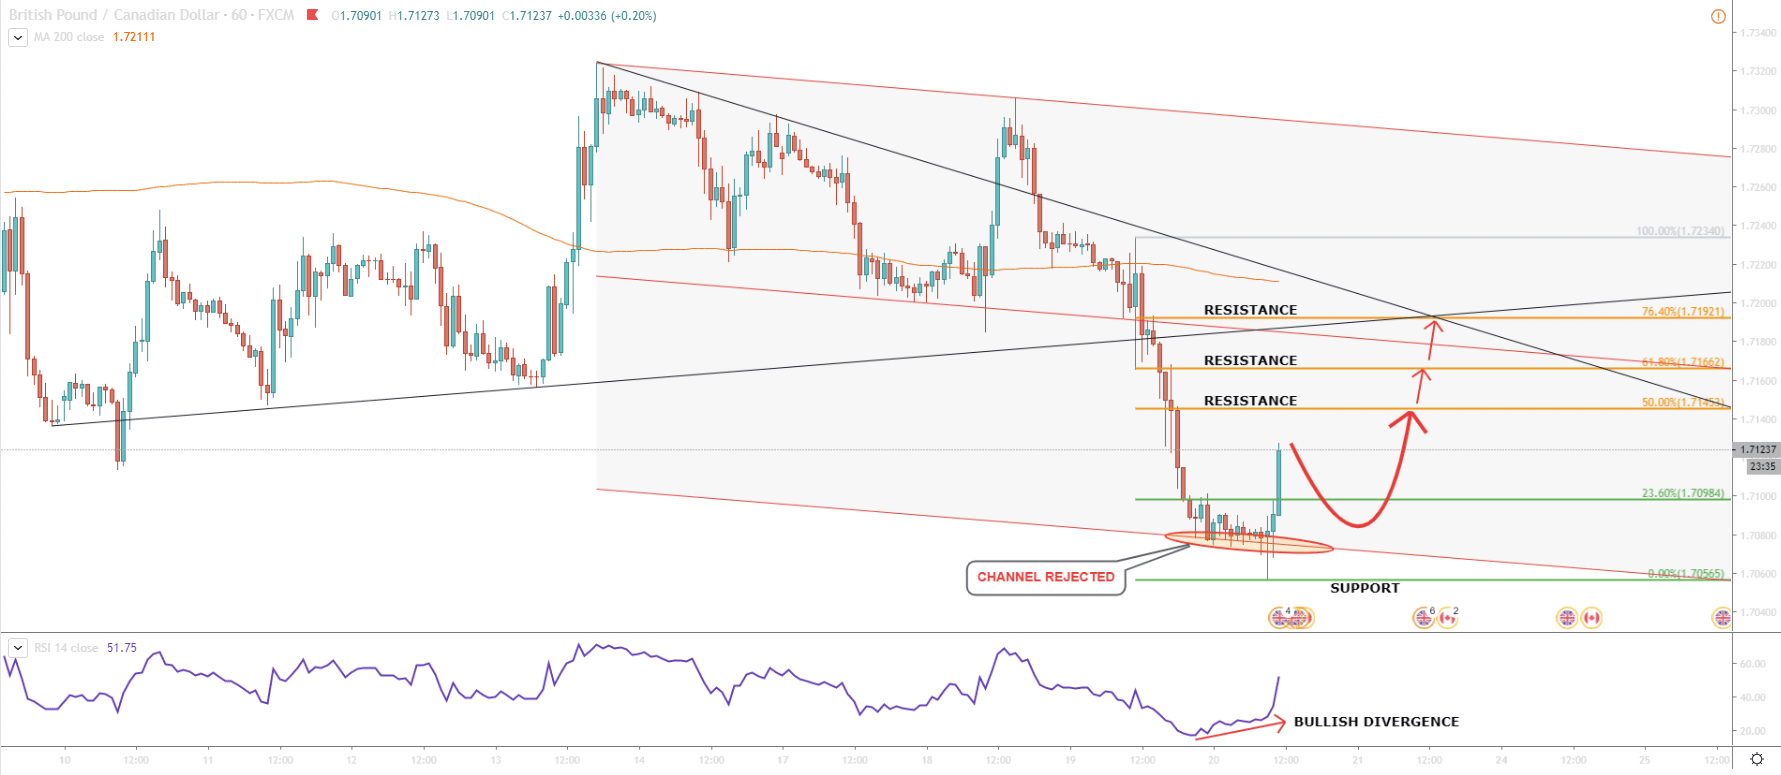
Now we can also see the rejection of the lower trendline of the extended descending channel. Also, bullish divergence formed on the RSI oscillator throughout the past 24 hours suggesting incoming bullish wave.
On the 1H chart, we can get potential upside targets with the most precision. Fibonacci applied to the last strong wave down show a very important level. It is actually a 76.4% retracement at 1.7192. What makes it so important is the cross of two trendlines.
The uptrend trendline as well as downtrend trendline, both crossing exactly at this level, which could make it a perfect upside target. At the same time, this will be the area of the 200 EMA. Nevertheless, other Fibonacci resistance levels can’t be ignored, and pice might bounce off any of them.
Looking at all timeframes, the price does not give a clear clue as to the direction of the pair. Nevertheless, there is a strong probabily that the price will correct up, back to the mean. The mean in our case is Exponencial Moving Average, and on all timeframes, it corresponds with the upside target.
We should watching all Fibonacci resistance levels located at 1.7145, 1.7166 and 1.7192. Also, 50 and/or 200 Exponential Moving Average can act as a strong resistance on the Daily, 4H and 1H charts.
On smaller timeframes, the trend remains very bearish. Which actually makes it risky to go long on GBP/CAD. However, tight stop loss and good money management can reduce the risk to the minimum. If on 1H and 4H charts price break and closes below the most recent low at 1.7056, it should be a clear exit signal for GBP/CAD bulls. Such price action will most likely result in a massive kick of stop losses and should push GBP/CAD lower.
Support: 1.7056, 1.7000
Resistance: 1.7145, 1.7166, 1.7192, 1.7200