
Published: April 7th, 2021
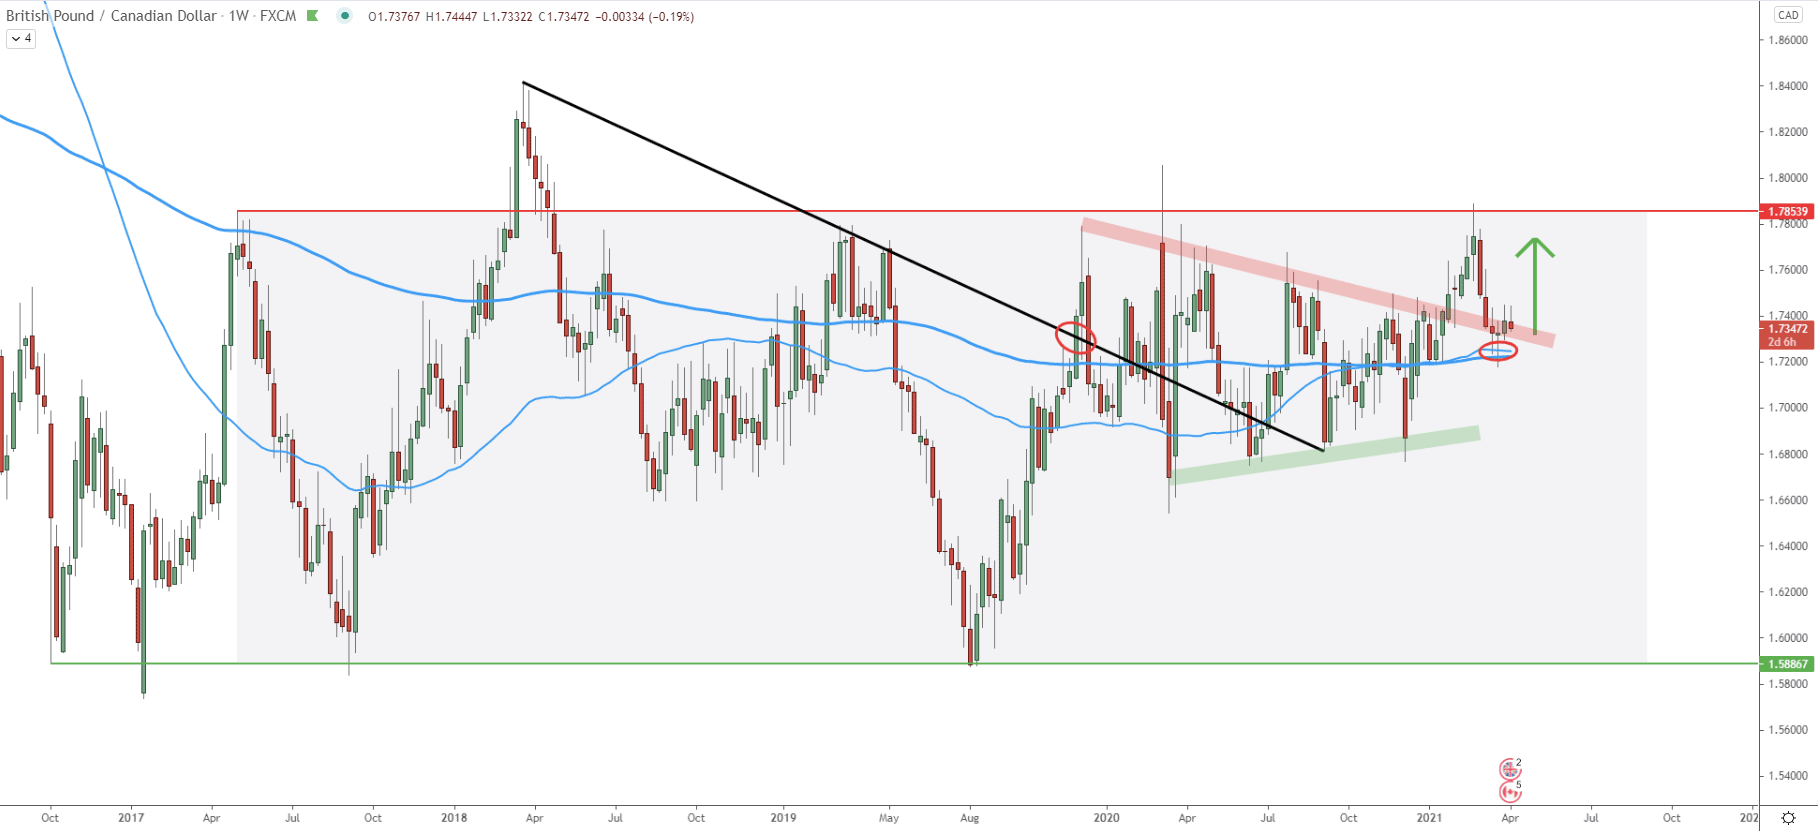
On the weekly chart, it becomes obvious that GBP/CAD price is stuck between the 1.5886 support and 1.7854 resistance areas. Pair has been trading within that range since late 2016, which makes it over 5 years. But considering the current price action, the probability is shifting towards the price increase, at least till the top of the range once again.
This is because the major downtrend trendline has been broken at the end of 2019. Then, there was a massive triangle patterned formed, which also got penetrated to the upside. Finally, during the past 4 weeks, the price has been rejecting the bottom of the triangle pattern as well as 200 Simple and Exponential Moving Average. Clearly, there is an extremely strong support area near 1.7100, where swing traders are likely to start accumulating their long positions.
As a result, the price could be heading towards the top of the range near the 1.7854 area, which is the nearest key resistance. But at the same time, there might be much stronger growth in the long term, and right now GBP/CAD could be at the very beginning of the huge rally.
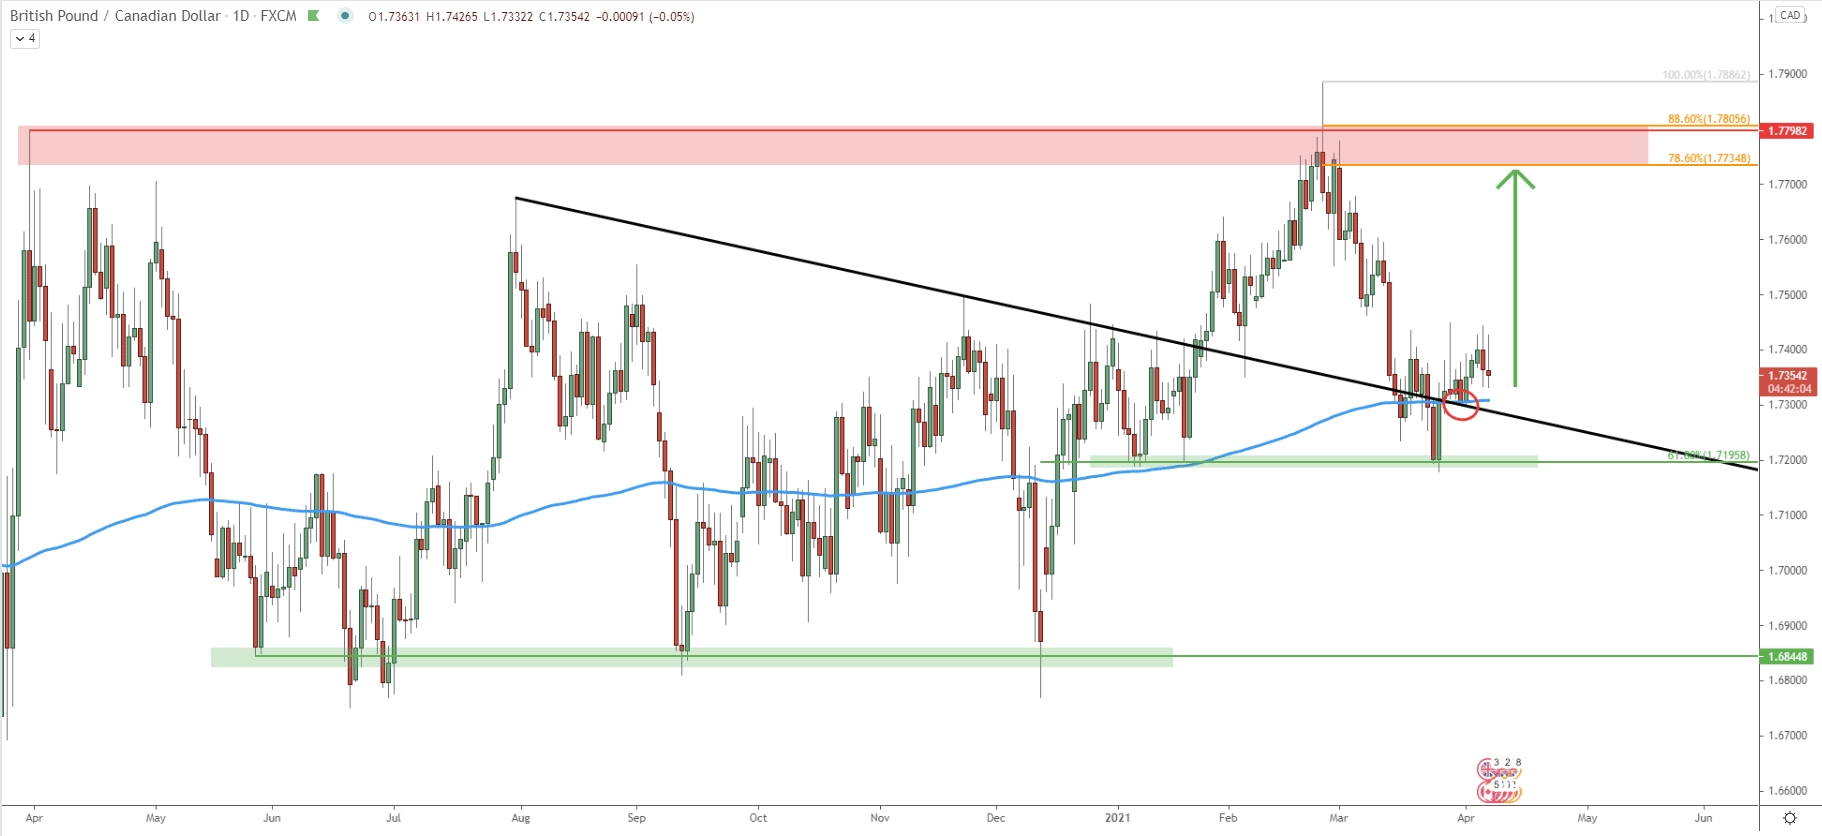
On the daily chart, we can see the key support at 1.6844, where the price bounced three consecutive times. Then it went up and broke above the downtrend trendline. After the breakout, another support has been formed at 1.7200 psychological level. This support area is also confirmed by the 61.8% Fibonacci retracement level and was rejected at the end of March.
Throughout last week, the price has bounced off the 200 SMA, which goes to show that bulls remain in control. And as long as the 1.7200 support area is being respected, the buying pressure should be only increasing in the coming days and weeks.
Based on the Fibonacci retracement indicator, there are two strong resistance levels. The first is 1.7735, confirmed by 78.6% Fibs. The second is 1.7800 psychological level, confirmed by 88.6% Fibs. It is highly probable that GBP/CAD will be aiming to test one of these resistance levels, and of course, there could be a break higher, which will only confirm a long-term bullish trend.
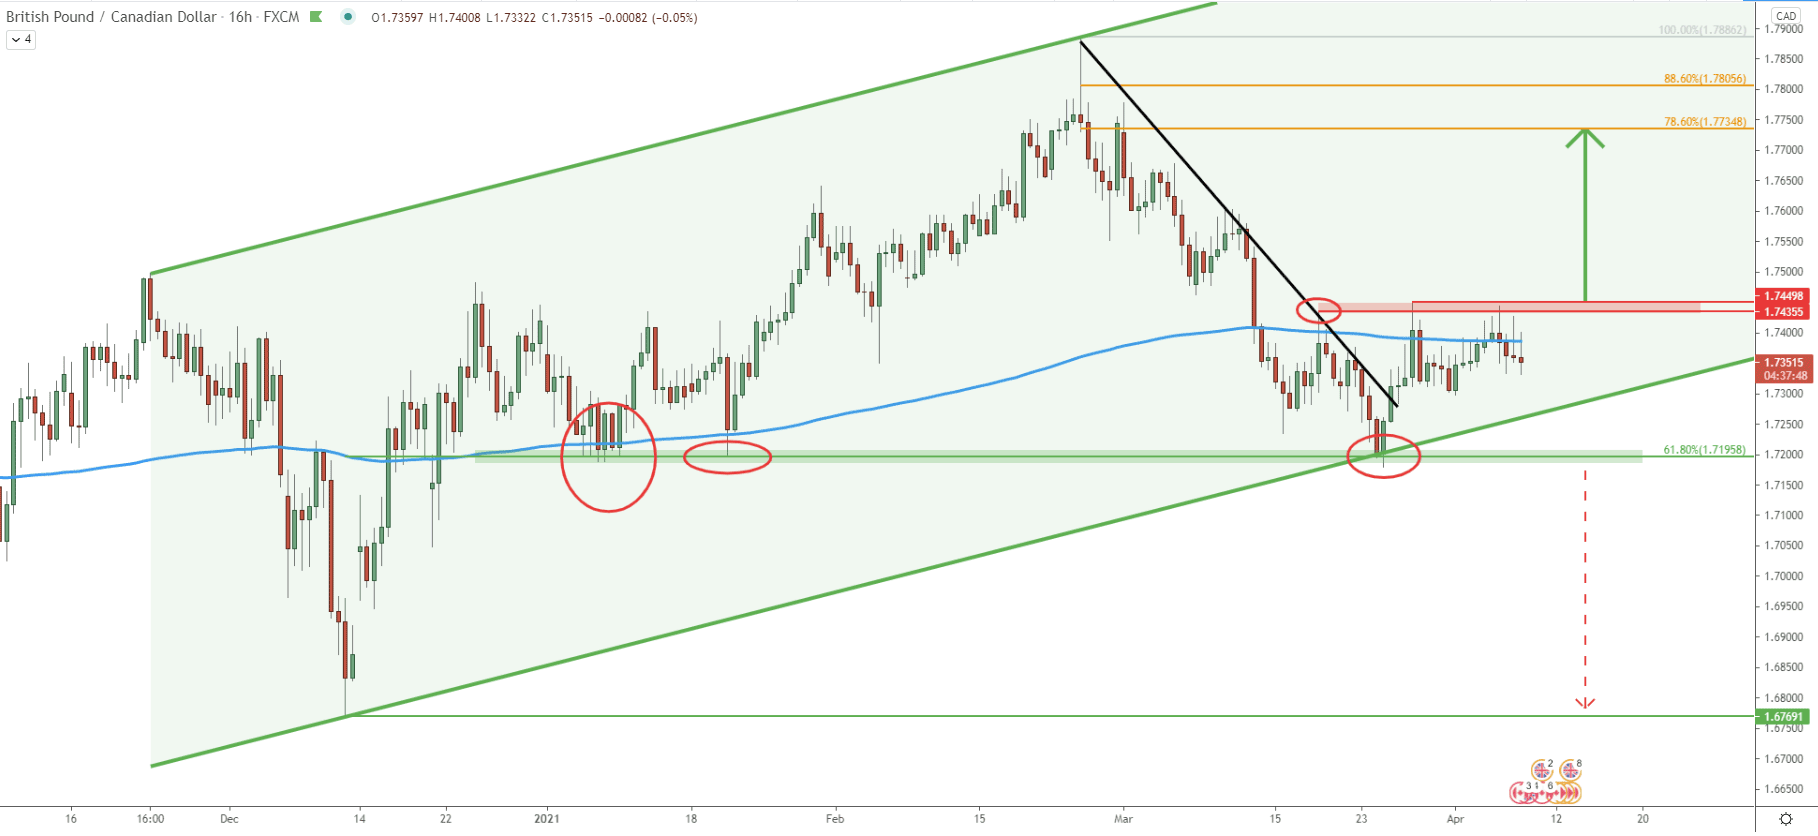
Since December GBP/CAD has been moving up, while the price remained within the ascending channel and produced higher highs and higher lows. At the end of March, the price has tested the bottom of the channel and rejected it along with the 61.8% Fibonacci retracement level. Then the price went up and broke above the simple downtrend trendline, suggesting further bullish pressure.
Nonetheless, it can be seen, that the resistance has been formed near the 1.7450 level, where price bounced multiple times while rejecting the 200 EMA. At this stage, further consolidation can be expected, but only until the point when GBP/CAD will break above the 1.7450 resistance, which is likely to be a strong bullish confirmation.
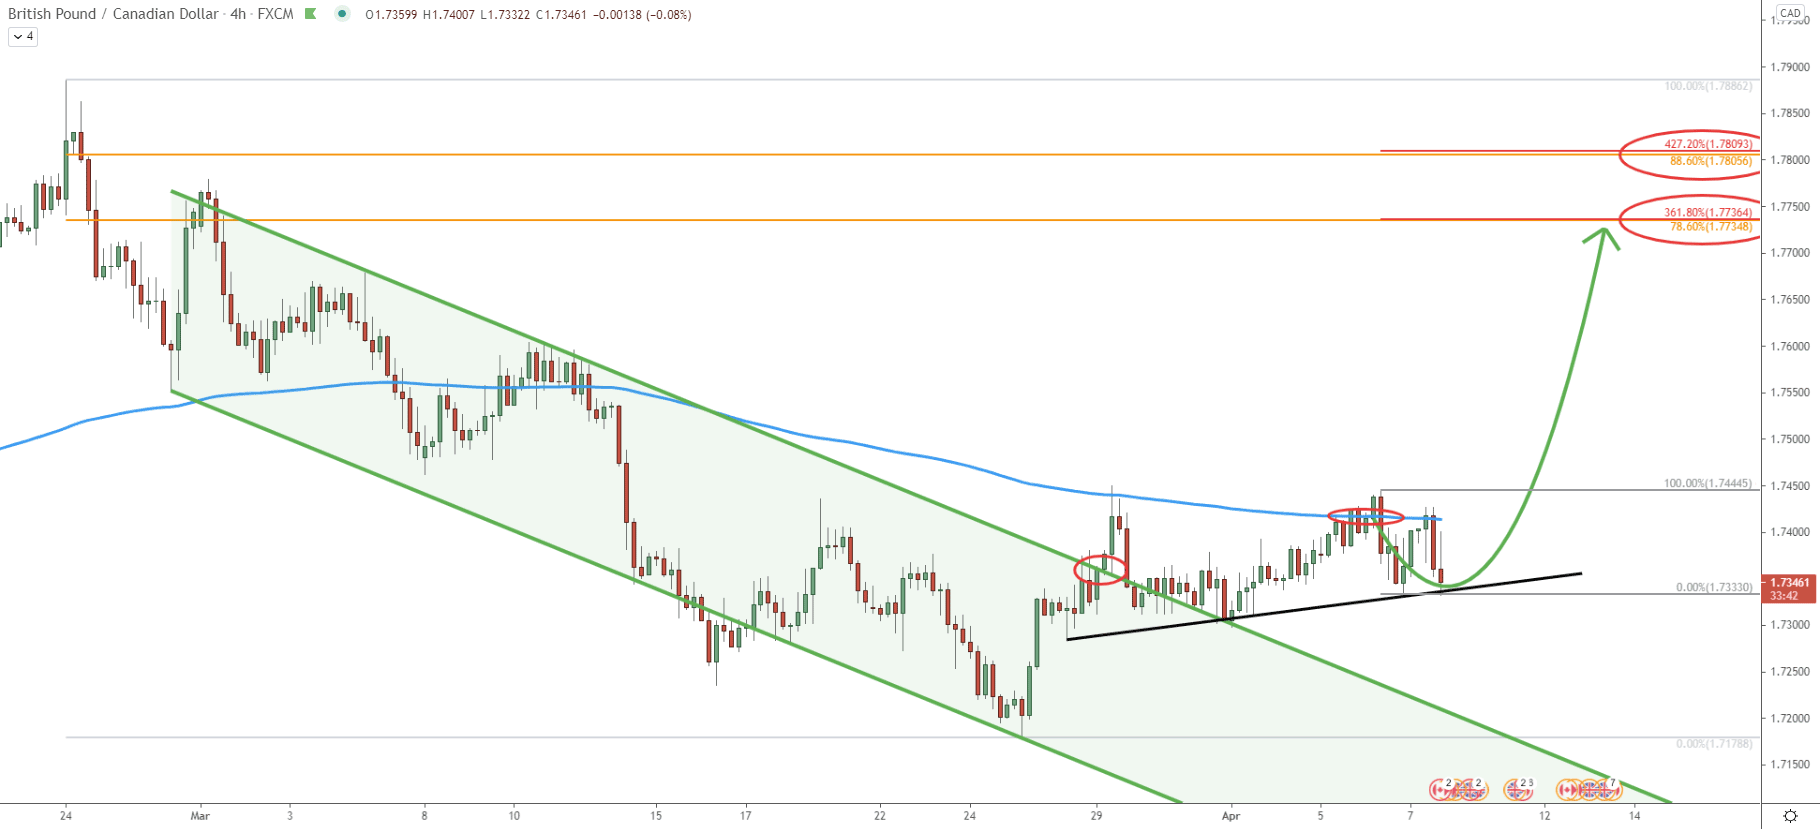
The descending channel has been broken on March 30, but after the breakout GBP/CAD bounced off the 200 SMA, preventing price from the further rise. Nonetheless, since then, the support uptrend trendline was rejected twice and the strong demand area has been formed near 1.7330. Prior to that, the price broke above the 200 SMA but failed to break above the previous high, where 200 SMA was rejected at first. In any case, the current price seems to be very attractive for short-term buyers and long-term investors. Obviously, this will be the case as long as the support uptrend trendline is being respected.
Price can be expected to rise towards the 1.7735 or 1.7800 resistance area. On this chart, each of the resistance levels is confirmed by two Fibs. First are the fibs as power the daily chart, and the second Fibs was applied to the current pullback, which occurred after the break above the 200 SMA.
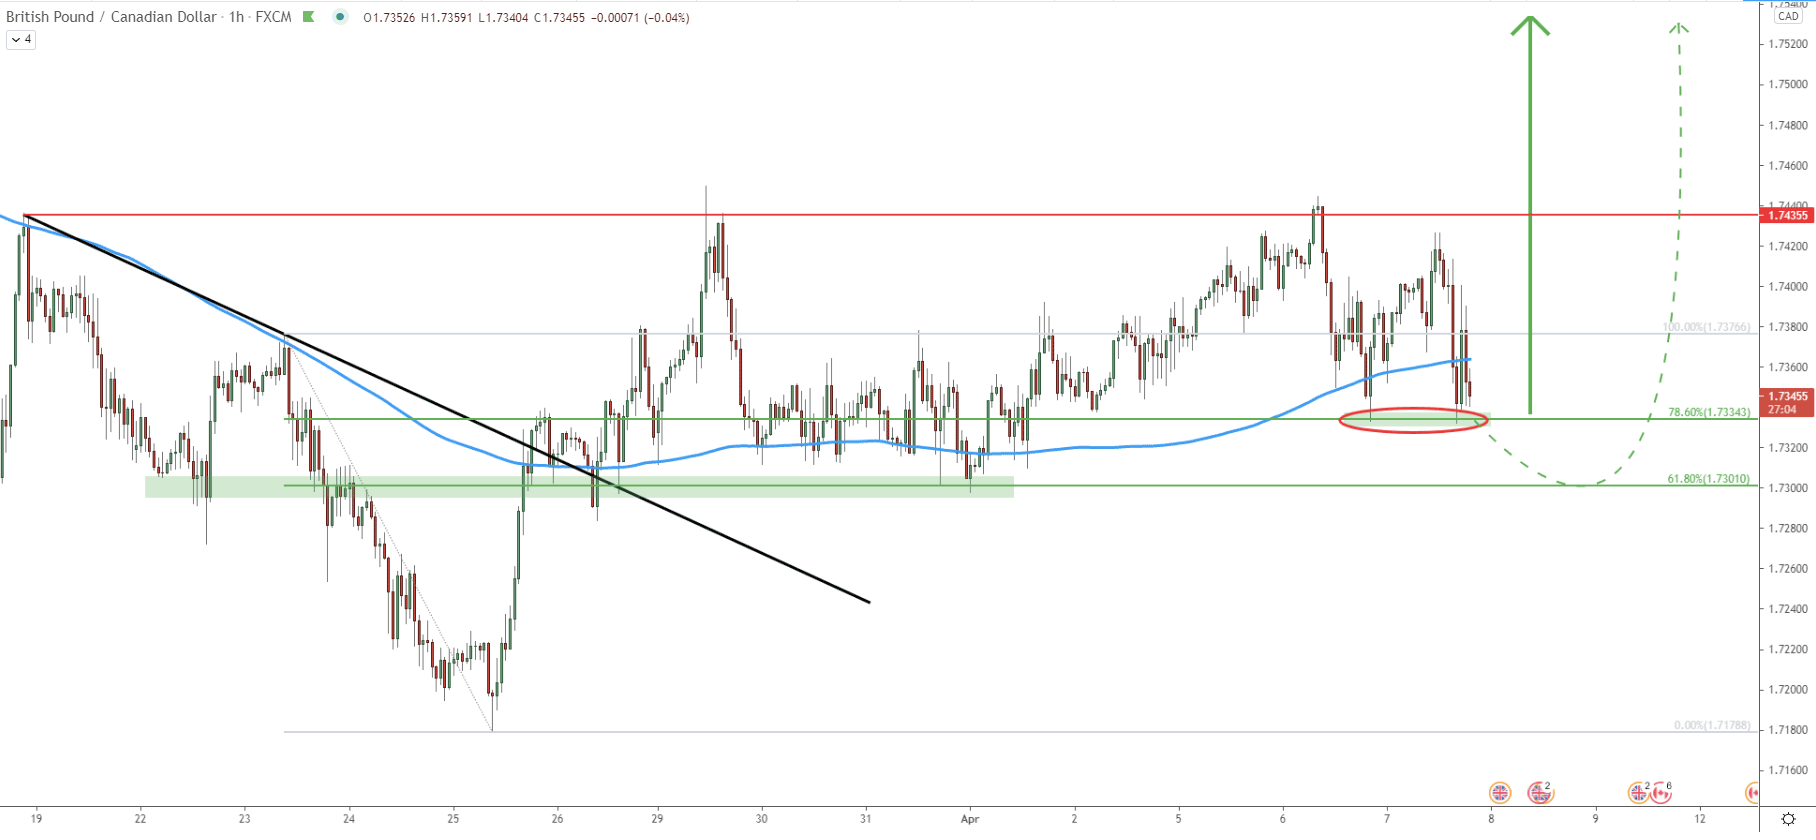
On the hourly chart, the price has been trading within the range yet again, where the support is seen at 1.7300 and resistance at 1.7435. During the past several days, the double bottom has been established right at 1.7330, which is also a 78.6% Fibonacci retracement level. Right now there are two major scenarios that can be expected in case of the uptrend. First is that price will start moving up from this point onwards, obviously only if 1.7330 support will hold. The second scenario is that price will move lower, to re-test the 61.8% Fibonacci support at 1.7300 psychological level. Clearly, 1.7300 is a very strong demand area, which already got rejected multiple times. But if GBP/CAD will correct towards this level, there should be a huge fight between bulls and bears. And based on the price action on higher timeframes, the probability remains in favor of the bulls.
GBP/CAD has been rage trading for 5 years based on the weekly chart. On lower timeframes, buying pressure remains to be high, which should result in the price moving up, towards the resistance area.
As per the daily and 4-hour chart, there are two upside targets to watch. The first is 1.7735, based on 78.6% and 361.8% Fibs, and the second is 1.7800 psychological level, based on 88.6% and 427.2% Fibs.
As per the 16-hour chart, break below the 1.7200 support area, especially the daily close below, will completely invalidate the bullish outlook. In this case, GBP/CAD might initiate a medium-term downtrend, potentially heading towards the 1.6770 support.
Support: 1.7330, 1.7300, 1.7200
Resistance: 1.7450, 1.7765, 1.7800


