
Published: June 24th, 2020
So many times we’ve been discussing the potential strength of the Australian Dollar. Perhaps GBP/AUD is the only AUD pair that was left without analysis. Today we will go through different charts to see the downside or perhaps an upside potential for this currency pair.
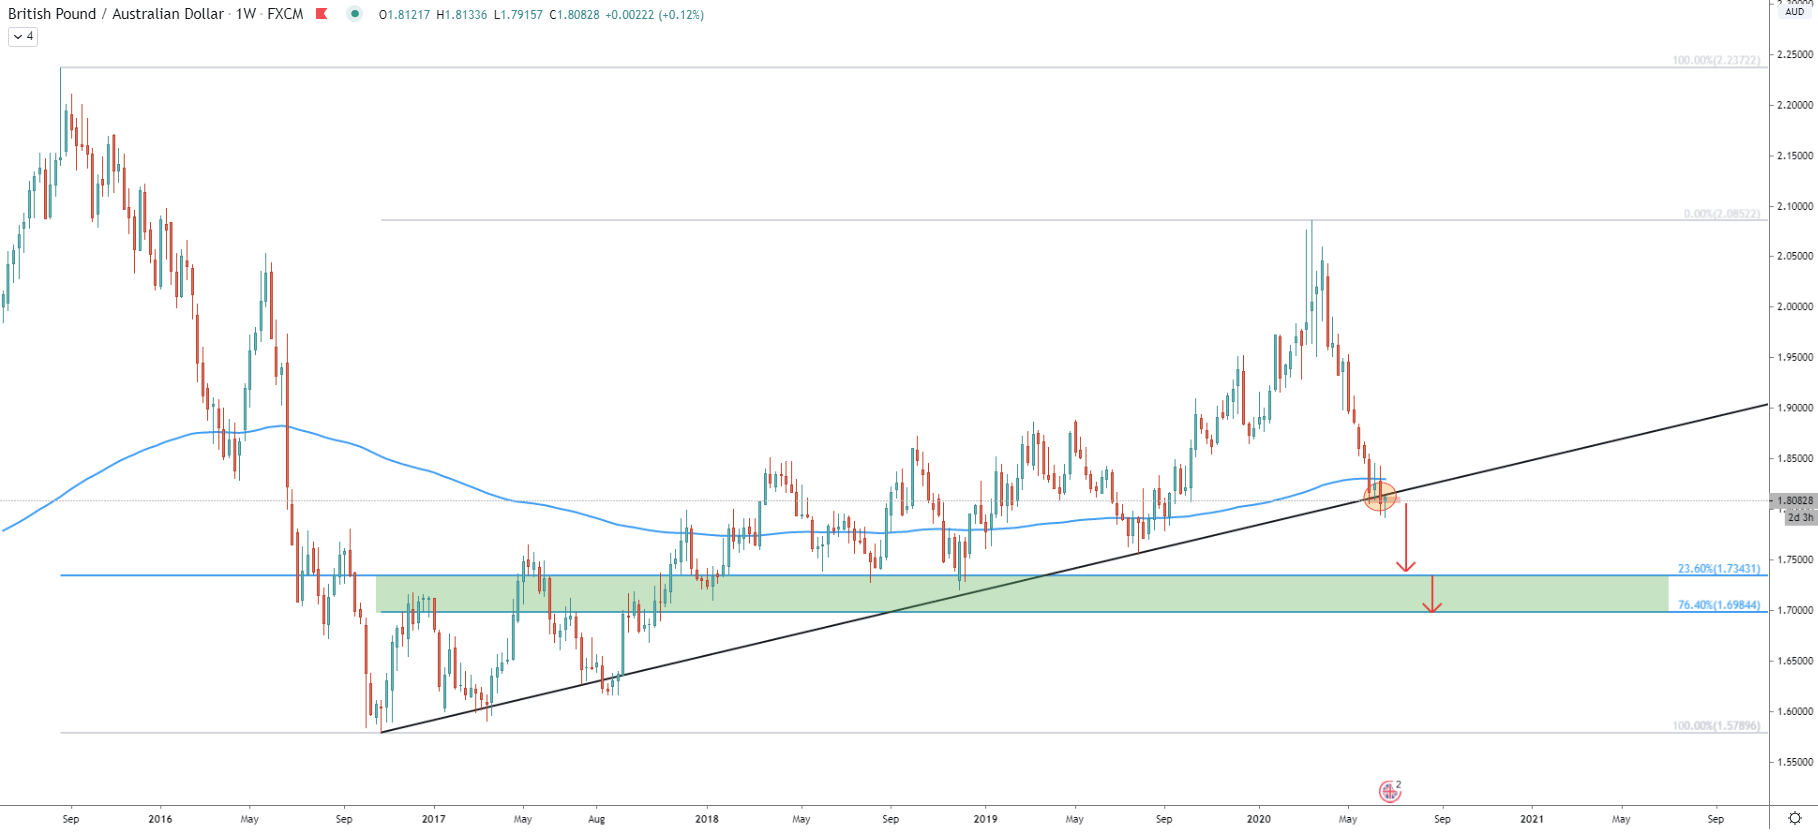
On the Weekly chart price finally broke below the long-term uptrend trendline. Prior to that, GBP/AUD broke below the 200 Exponential Moving Average, which shows the strength of the overall downtrend. These facts are strongly in favor of the downtrend continuation and there are two major support levels to watch.
We have applied two Fibonacci retracement levels, first to the August 24, 2015 - October 24 2016 downtrend. The second was applied to the October 24, 2016 - March 16, 2020 uptrend. These indicators show two important levels, first being the 23.6% retracement at 1.7343, and the second is 76.4% retracement at 1.6984. In the following charts, we will explain the importance of these levels.
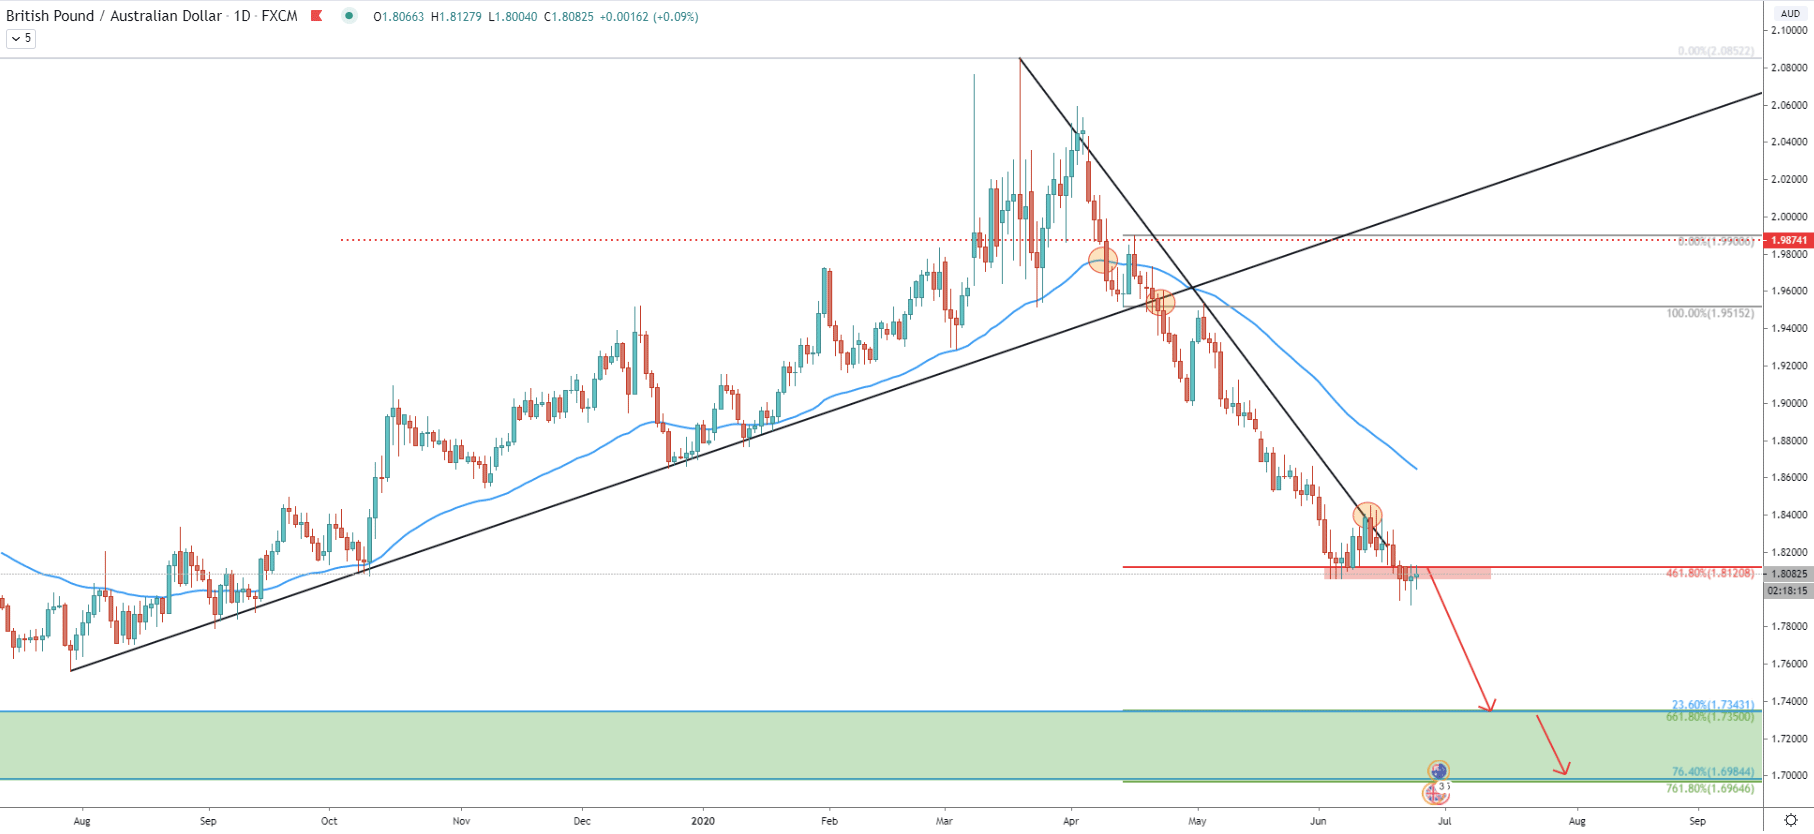
The Daily chart shows a break below yet another uptrend trendline, prior to which price broke below the 50 EMA. We have applied the Fibonacci indicator to the corrective wave up, after breaking the EMA. The interesting part is that 661.8% and 761.8% retracement levels almost exactly correspond to support levels as per the weekly chart. These are 1.7350 and 1.6970 areas.
Another factor is that GBP/AUD rejected the downtrend trendline after which broke below the 461.8% Fibonacci support at 1.8120. Currently, the support has become resistance and as long as daily closing price remains below this level, selling pressure should only increase over time.
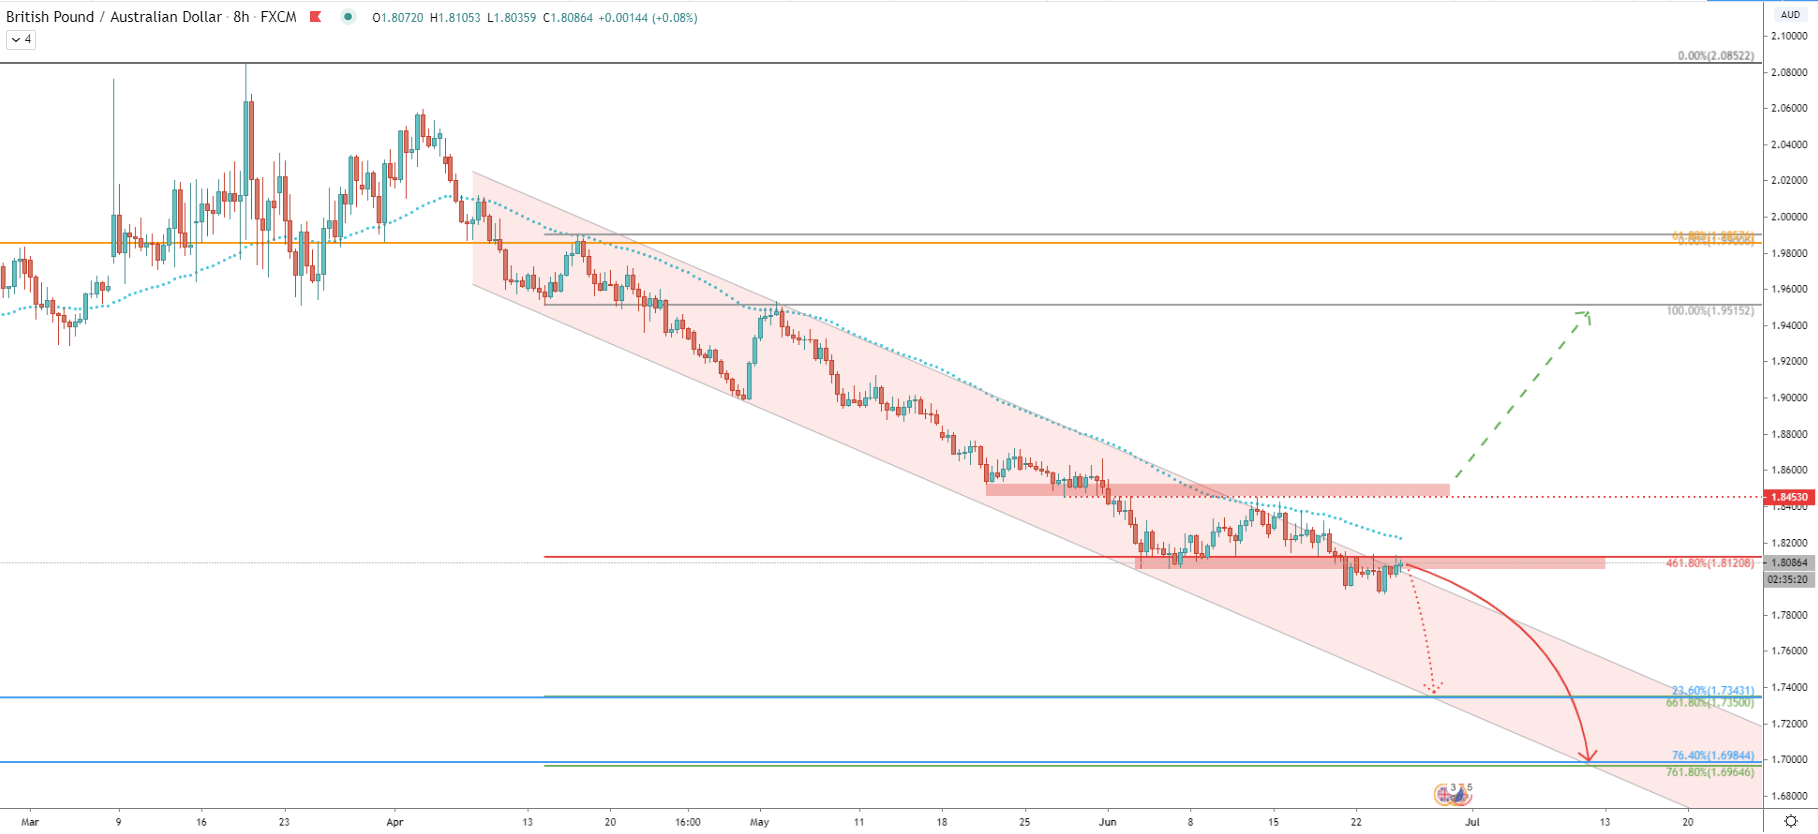
For the past two months, the price has been moving within a narrow descending channel, respecting the lower trendline as well as the upper trendline. On June 12, the upper trendline was rejected, along with the 50 EMA, after which price yet again produced a new lower low.
Now we can expect 3 possible scenarios. The first is where the price will continue to move lower, potentially testing one of the Fibonacci support levels. The second scenario is that GBP/AUD break above 1.8020 and will start to consolidate between the most recent low at 1.7917 and the resistance at 1.8453. The third scenario, which at this point holds the least probability, is that price will break above the 1.8453 resistance and the trend will reverse to the upside.
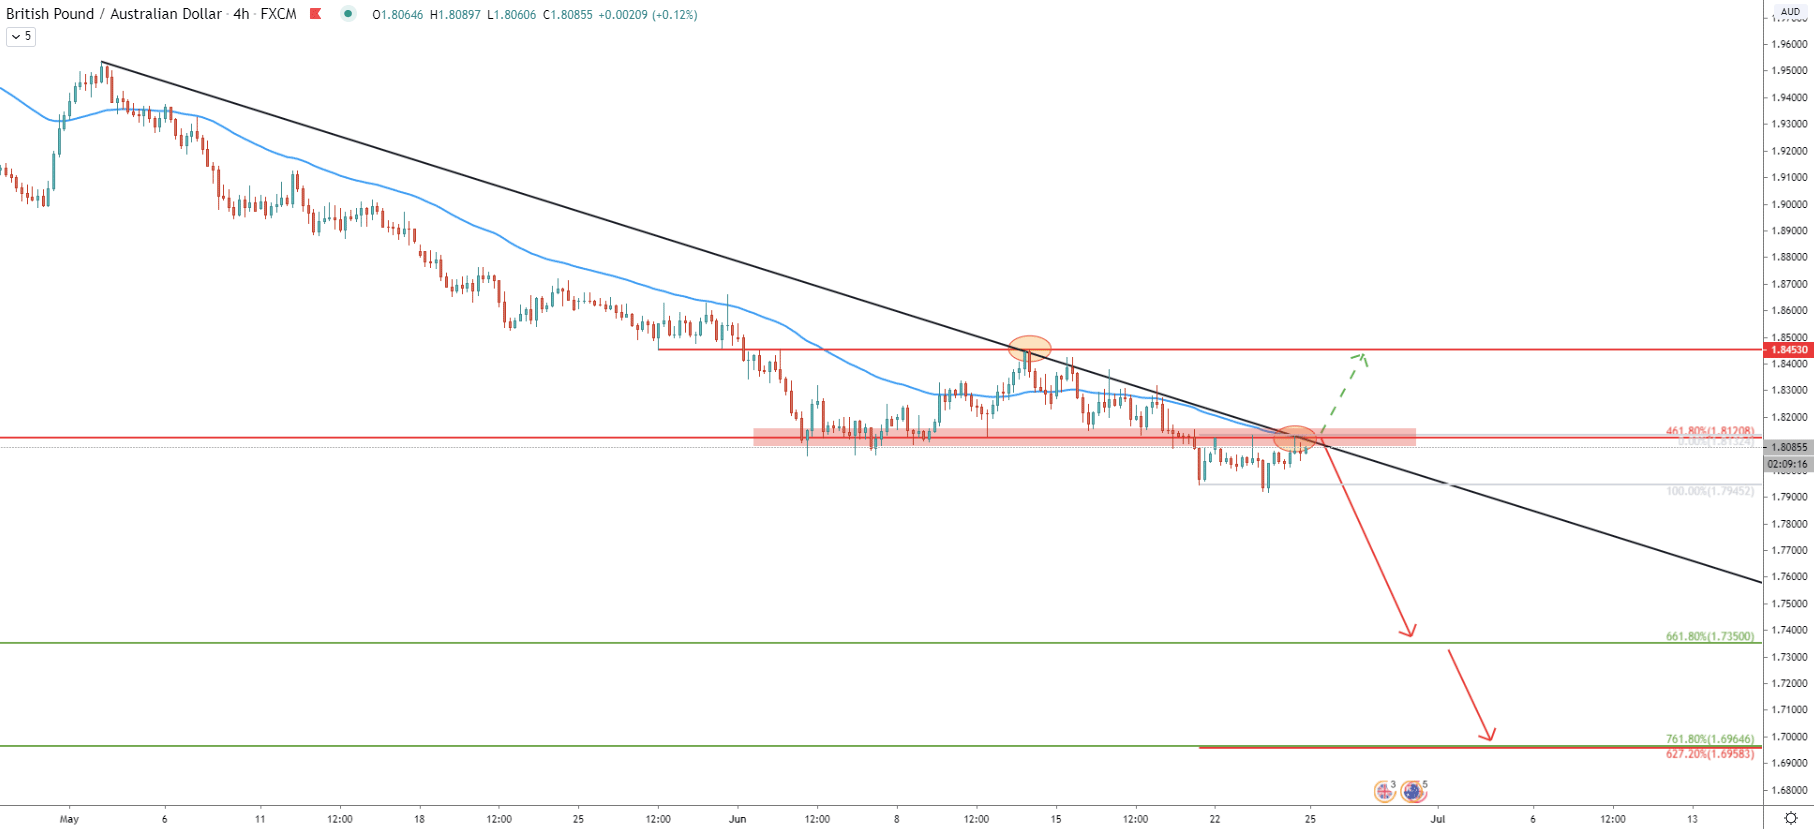
On the 4-hour chart, we have applied the Fibonacci retracement level to the corrective wave up, after breaking below the 1.8120 support. The 627.2% Fibs cleanly corresponds with the final downside target located at 1.6960 area. We can also see that price remains right at the downtrend trendline, which still is being rejected.
There is a possibility that GBP/AUD will attempt to break above the resistance and the downtrend trendline, producing spike above this price. But only Daily close above the 1.8120 could make a downtrend scenario much less likely to occur.
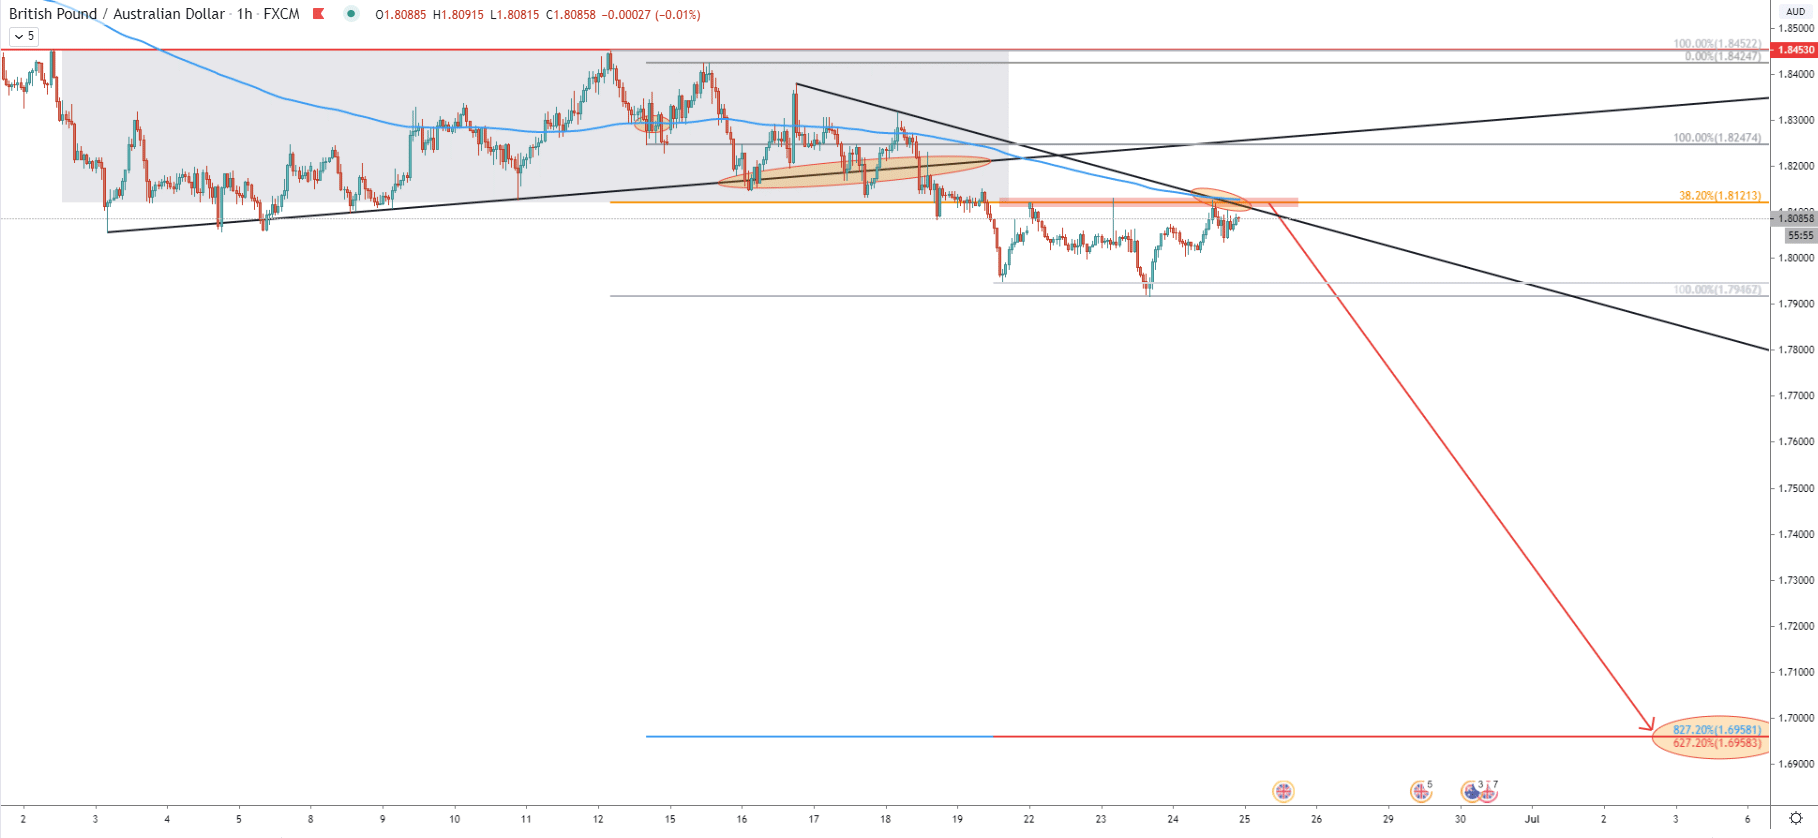
On the hourly chart, GBP/AUD broke out of the range, which has lasted 16 days. After the breakout pair found a strong resistance right at the 38.2% Fibonacci retracement level, which is 1.8121. The resistance was rejected for the 3 consecutive times, suggesting strong bearish domination. And on this chart, we have also applied Fibs, to the corrective wave up after breaking the 200 EMA. And yet again, 827.2% retracement level corresponds to the key support at 1.6960.
The strength of the Australian Dollar might have a huge effect on most AUD pairs in the long term, including GBP/AUD. Currently, it seems we are in the key point of time, where GBP/AUD will show its inventions buy either breaking above the resistance or continuing the long term downtrend.
Based on multiple Fibonacci retracement levels there are two key support levels, which could be considered as potential downside targets. The first is 1.7350 and the second is 1.6965
As per the 8-hour and 4-hour charts, there are two major resistance levels. The nearest one is at 1.8120, and if there will be daily close above the price, GBP/AUD bearish scenario will be invalidated and price should be expected to head towards the second resistance at 1.8453.
Support: 1.7350, 1.6965
Resistance: 1.8120, 1.8453