
Published: March 13th, 2020
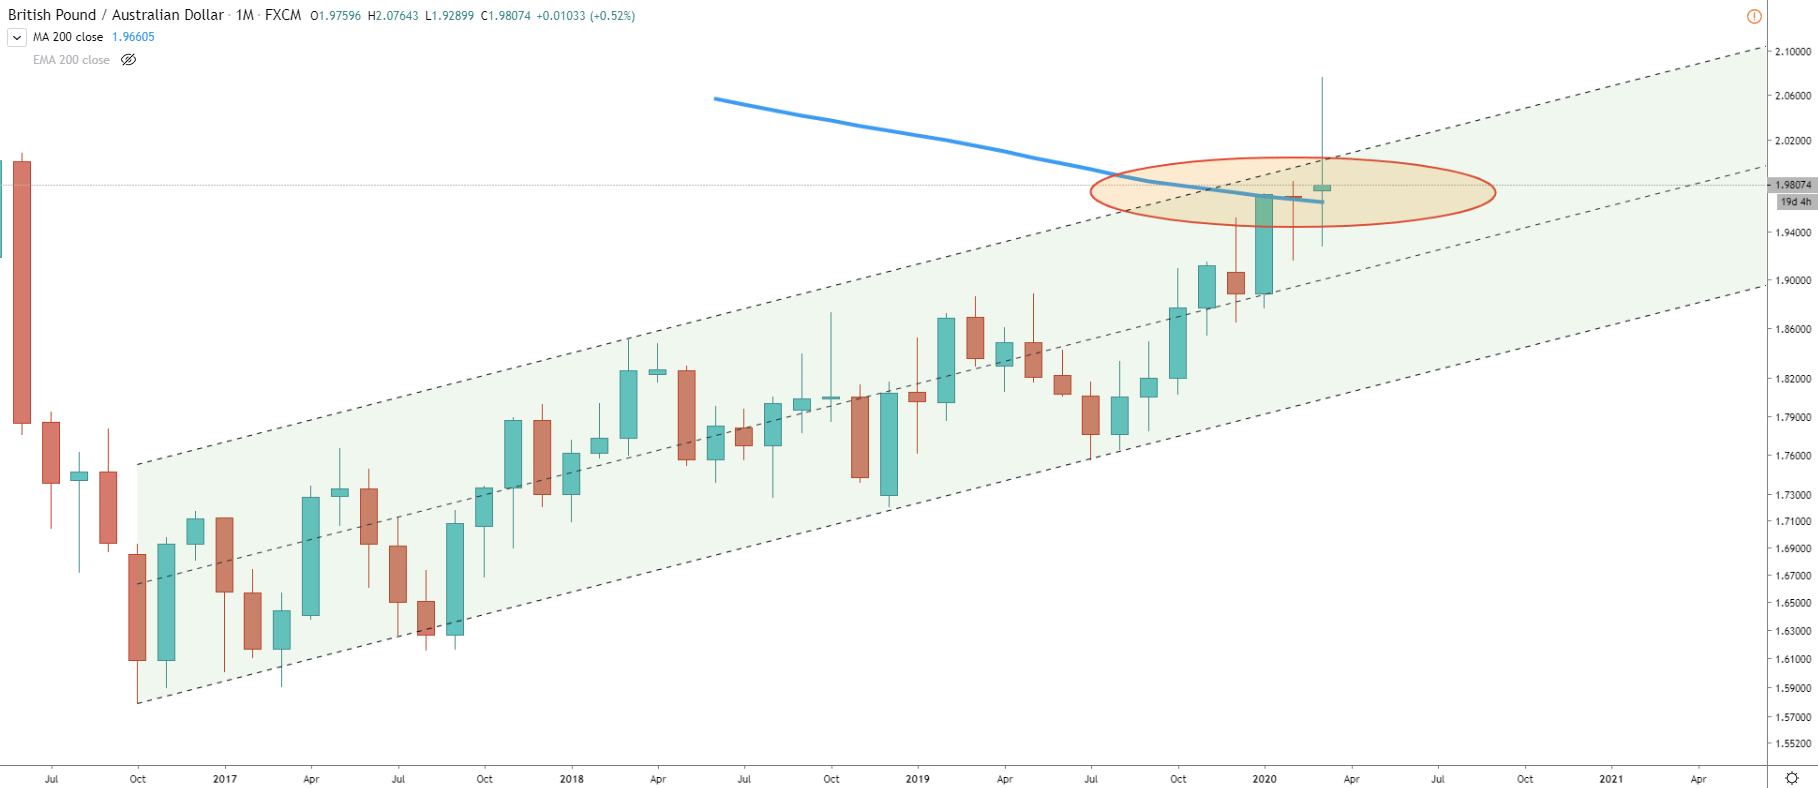
The title says it all, GBP/AUD can in fact initiate a trend reversal. We can see that on a Monthly chart price has reached to top of the ascending channel. What is important, is a monthly close below the 200 Exponential Moving Average. This could be the key to the trend reversal, which actually, could start any day starting from today. We can see, that the previous month close failed to close above previous high, which is a very strong indication that the price is lacking upside traction and sellers could start juping in very soon.
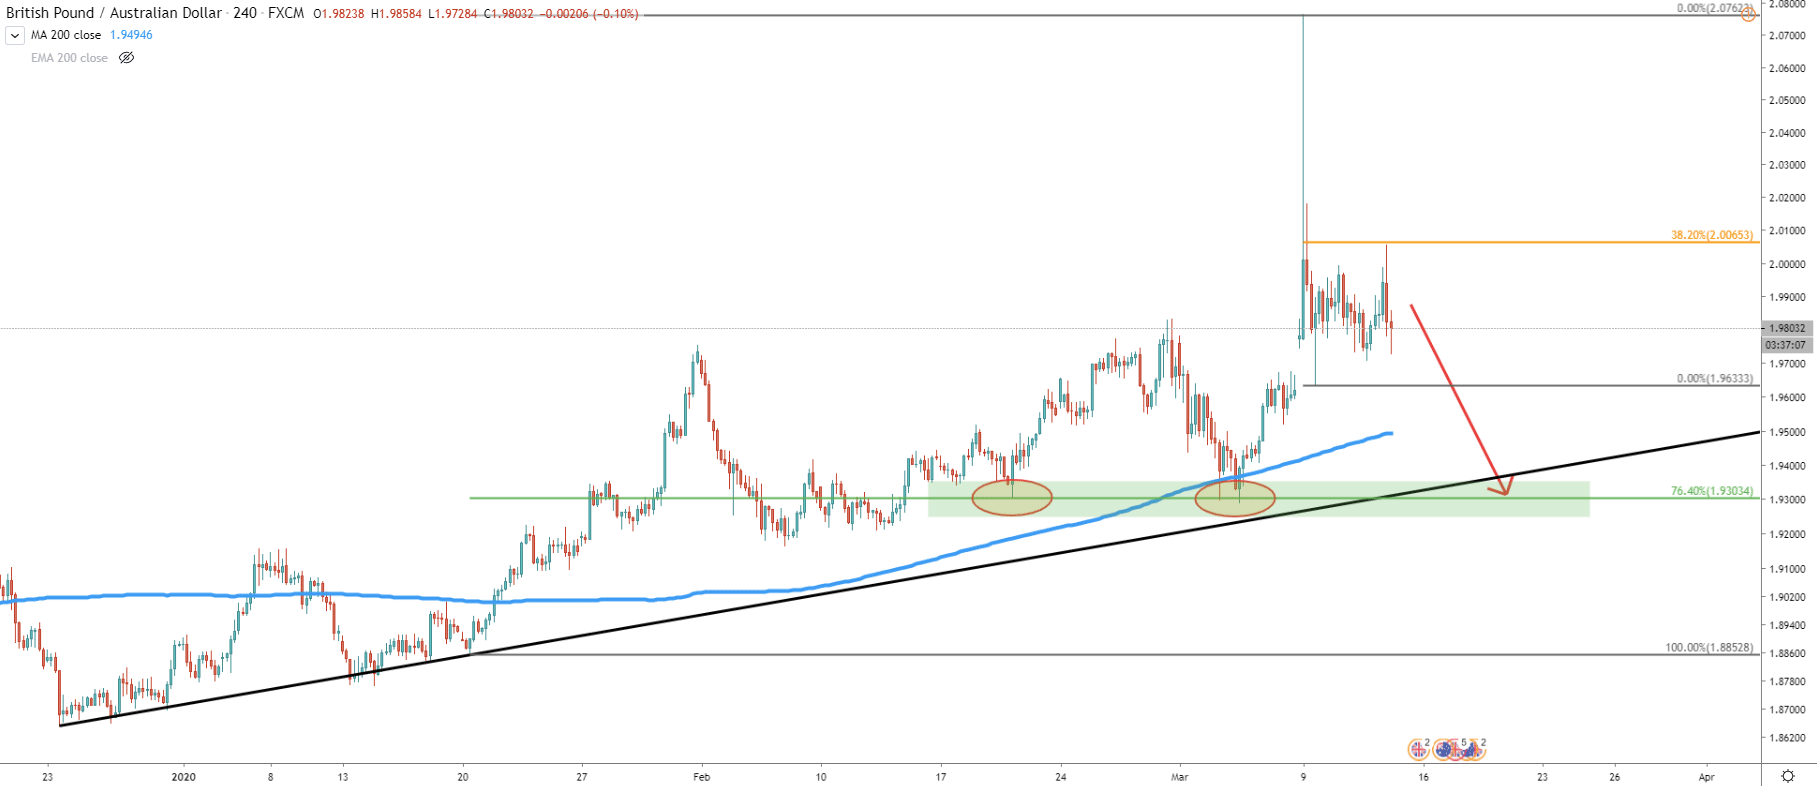
On 4H chart price found the resistance at 2.0065 which is a 38.2% Fibonacci retracement level applied to the recent spike, where price has tested 2.0762 high. Also, we can see a strong support formed previously. This is the 1.9300 area, which price rejected few times back in February. At the very same price level, GBP/AUD rejected the 200 EMA and it also corresponds to the 76.4% Fibonacci retracement level where Fibs were applied through the last bounce of the uptrend trendline and the most recent highest high. We can make a conclusion, that 1.9300 is playing an important role in further price development and could be used as a medium or long term downside target. If price breaks below this support, it could suggest the beginning of a long term downtrend.
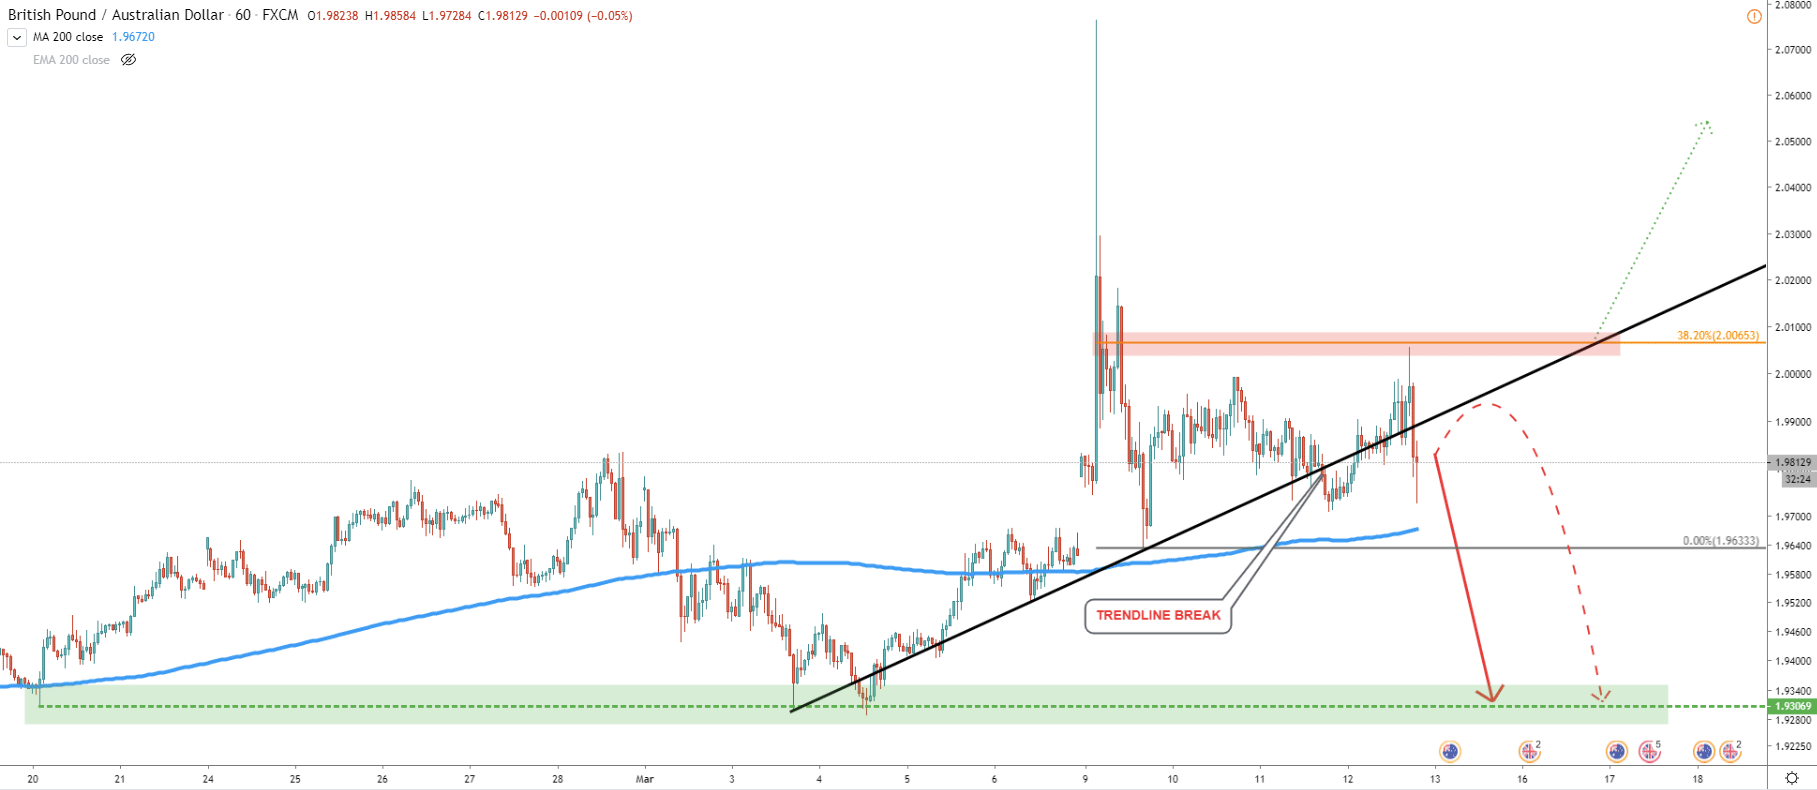
1 Hour chart shows the uptrend trendline break, although price remains above the 200 EMA. This might result in a consolidation phase between 1.9633 support and 2.0065 resistance areas. Therefore, price can get volatile before/if moving lower, but the key confirmation could be a break and close below the 200 EMA. It is also important that 2.0065 resistance won’t be penetrated in general, and in particular, there won’t be 1h, 4h and/or Daily close above this level. Overall 2.0065 could be a strong supply zone.
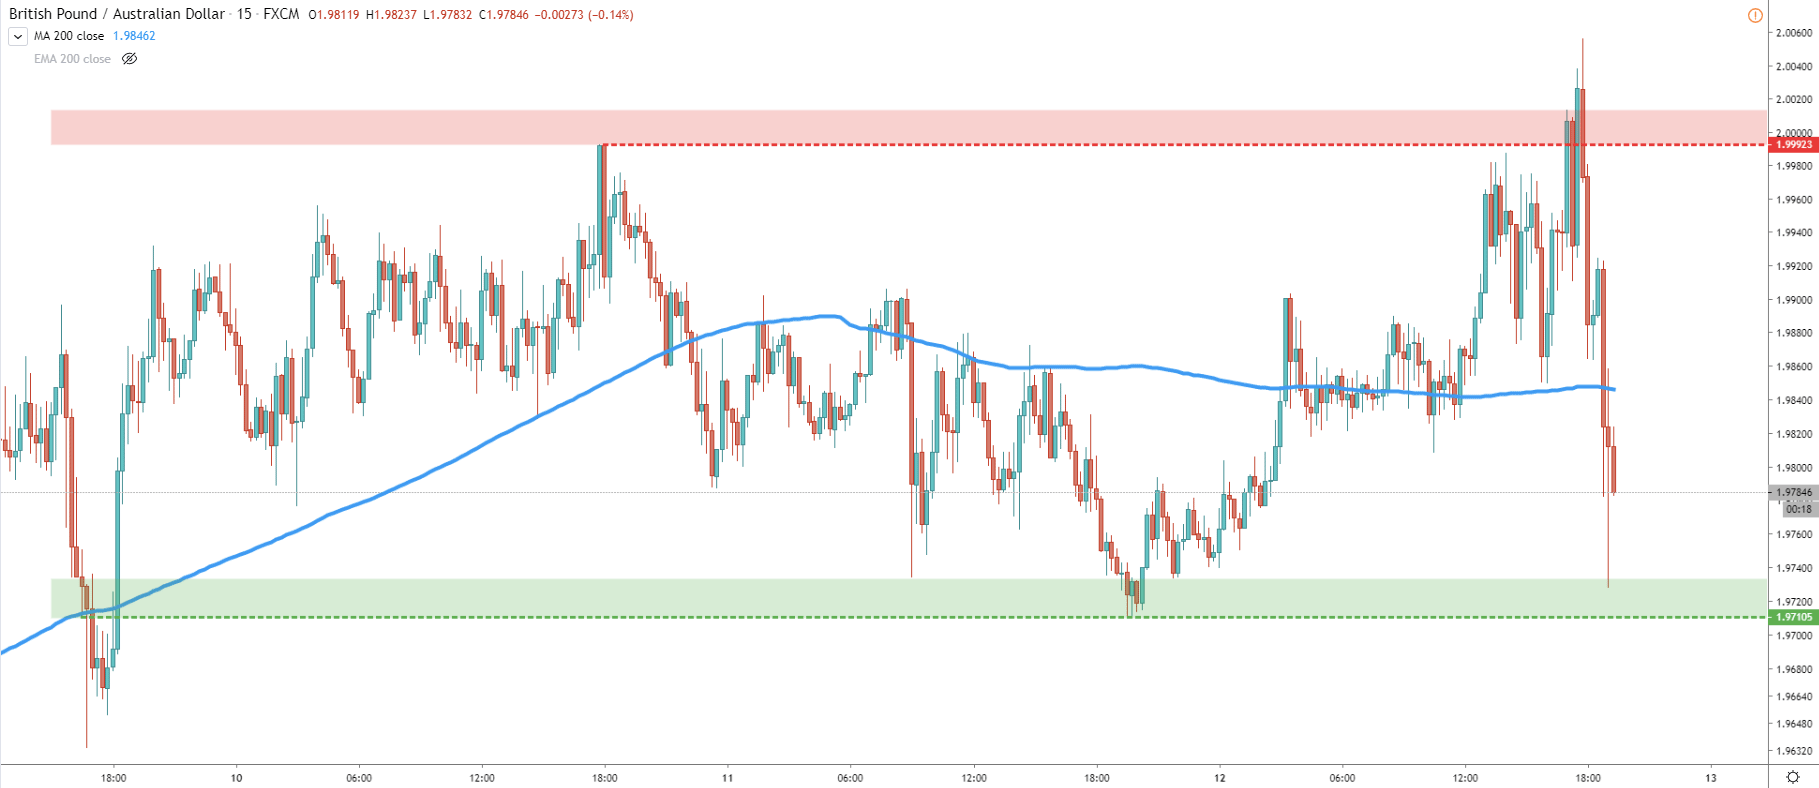
On the 15 minute chart clearly price is ranging. This consolidation could take some time before some sort of breakout. While selling seems to be a priority, it will be better to see GBP/AUD breaking and closing below 1.9700 psychological support. Such price action is likely to initiate a strong impulsive wave down and this is the time when institutional investors are likely to get on the selling train.
GBP/AUD is still trending up, but the price is showing, that it could be getting ready for a reversal. This could be a great opportunity for long term investors, although a tough time for short term speculators.
As already mentioned, 1.9300 is the key level to watch for the profit-taking in case price will start going down. This level previously acted as strong support and it is also confirmed by the Fibonacci retracement level.
All-in-all it is a long term bullish trend. This means that selling at his stage can be risky and price can be quite volatile in the short term. But break and close above 2.0100 would invalidate bullish outlook and is likely to result in a long term uptrend continuation.
Support: 1.9710, 1.9630, 1.9300
Resistance: 2.0065, 2.0100


