
Published: October 30th, 2020
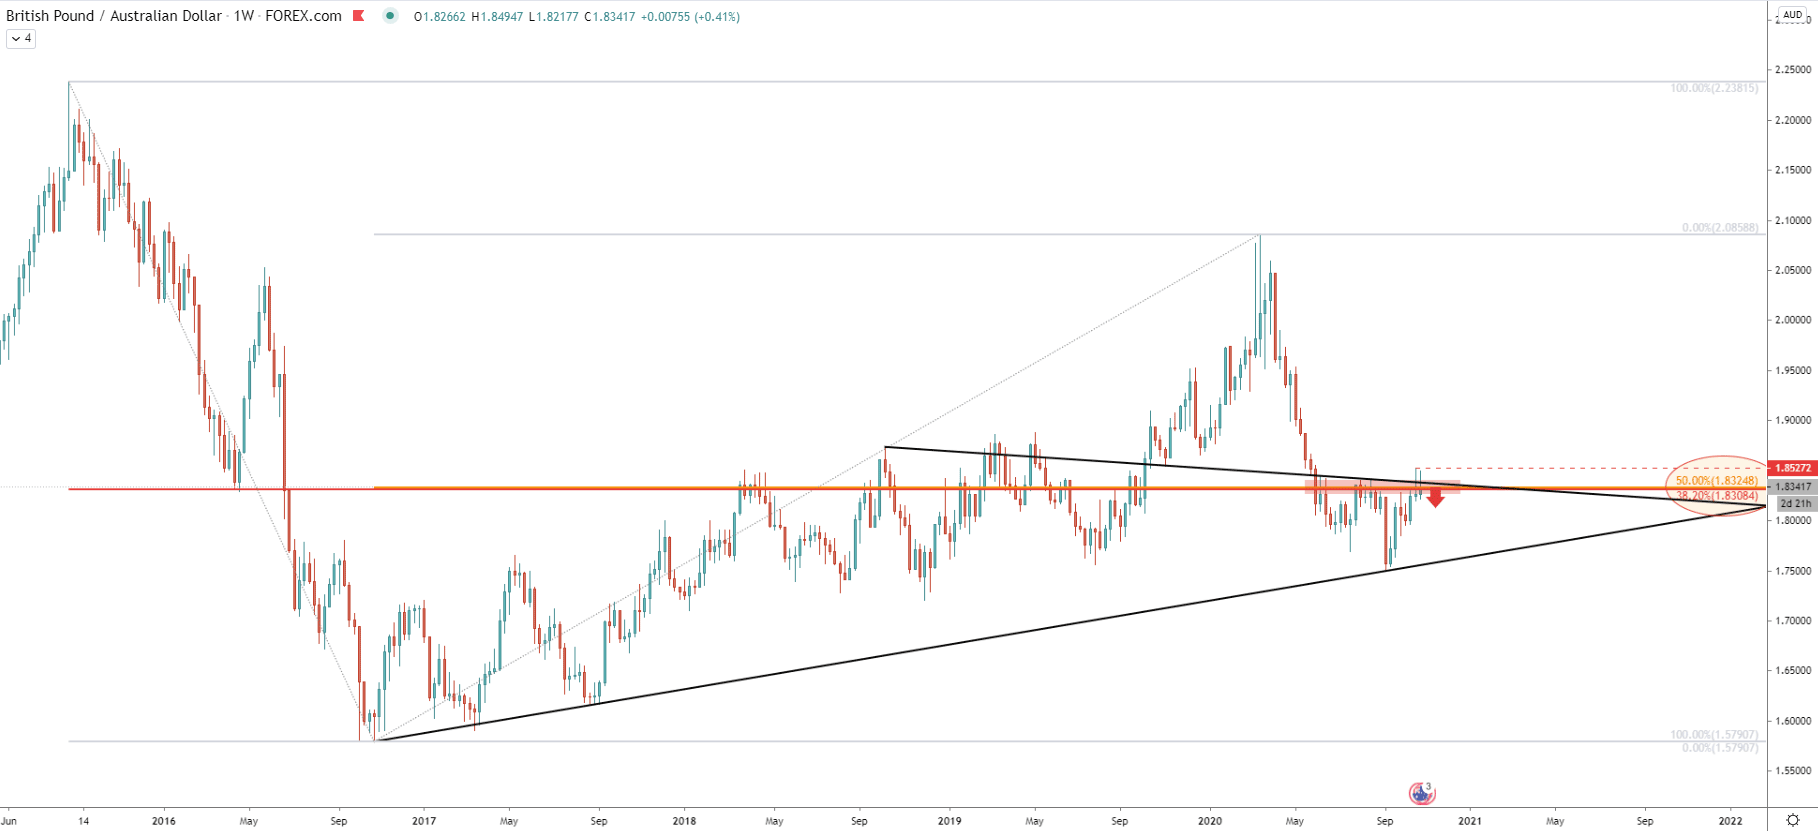
The weekly timeframe seems to show that the overall trend remains bullish as price rejected the uptrend trendline. However, the previous low has been broken and currently high highs and higher lows pattern is invalidated. This might suggest that the trend is turning bearish in the long run, especially considering a double Fibonacci rejection, the 50% and 38.2% retracement levels near 1.8300 psychological resistance. The average price downtrend trendline is also rejected, which might start inviting sellers as long as the price remains below the most recent high at 1.8527.
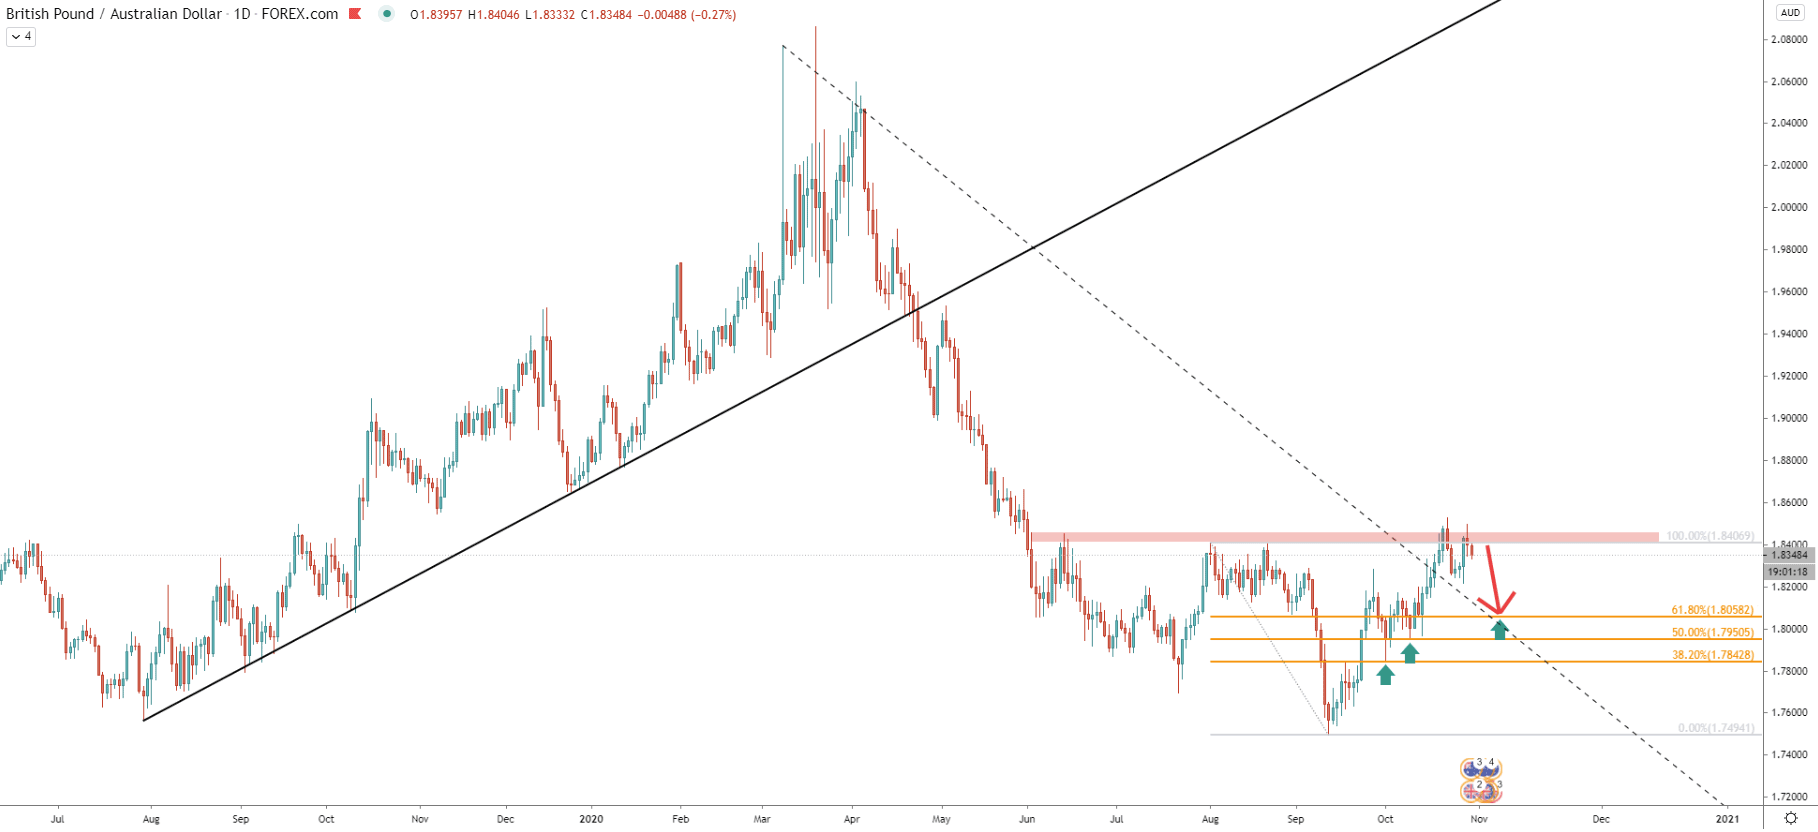
It can be clearly is seen that there is a massive resistance area between 1.8400-1.8300, which has been formed thought the past 5 months. And on this chart, the lower lows and lower highs pattern also invalidated, which means that price can either start consolidating or break to the upside. But as long as GBP/AUD remains below the resistance area, the price is likely to move down, especially considering that the consolidation could have started and the pair remains right on the top of it.
Fibonacci applied to the last wave down, where GBP/AUD bottomed out at 1.7494 shows, that previously 38.2% Fibs at 1.7842 and 50% Fibs at 1.7950 were rejected cleanly. Perhaps the time has come for the 61.8% Fibs at 1.8058 to be rejected, which makes it a good downside target for sellers. Besides this level corresponds to the downtrend trendline and could take only a week for the price to move towards the 1.8058 support.
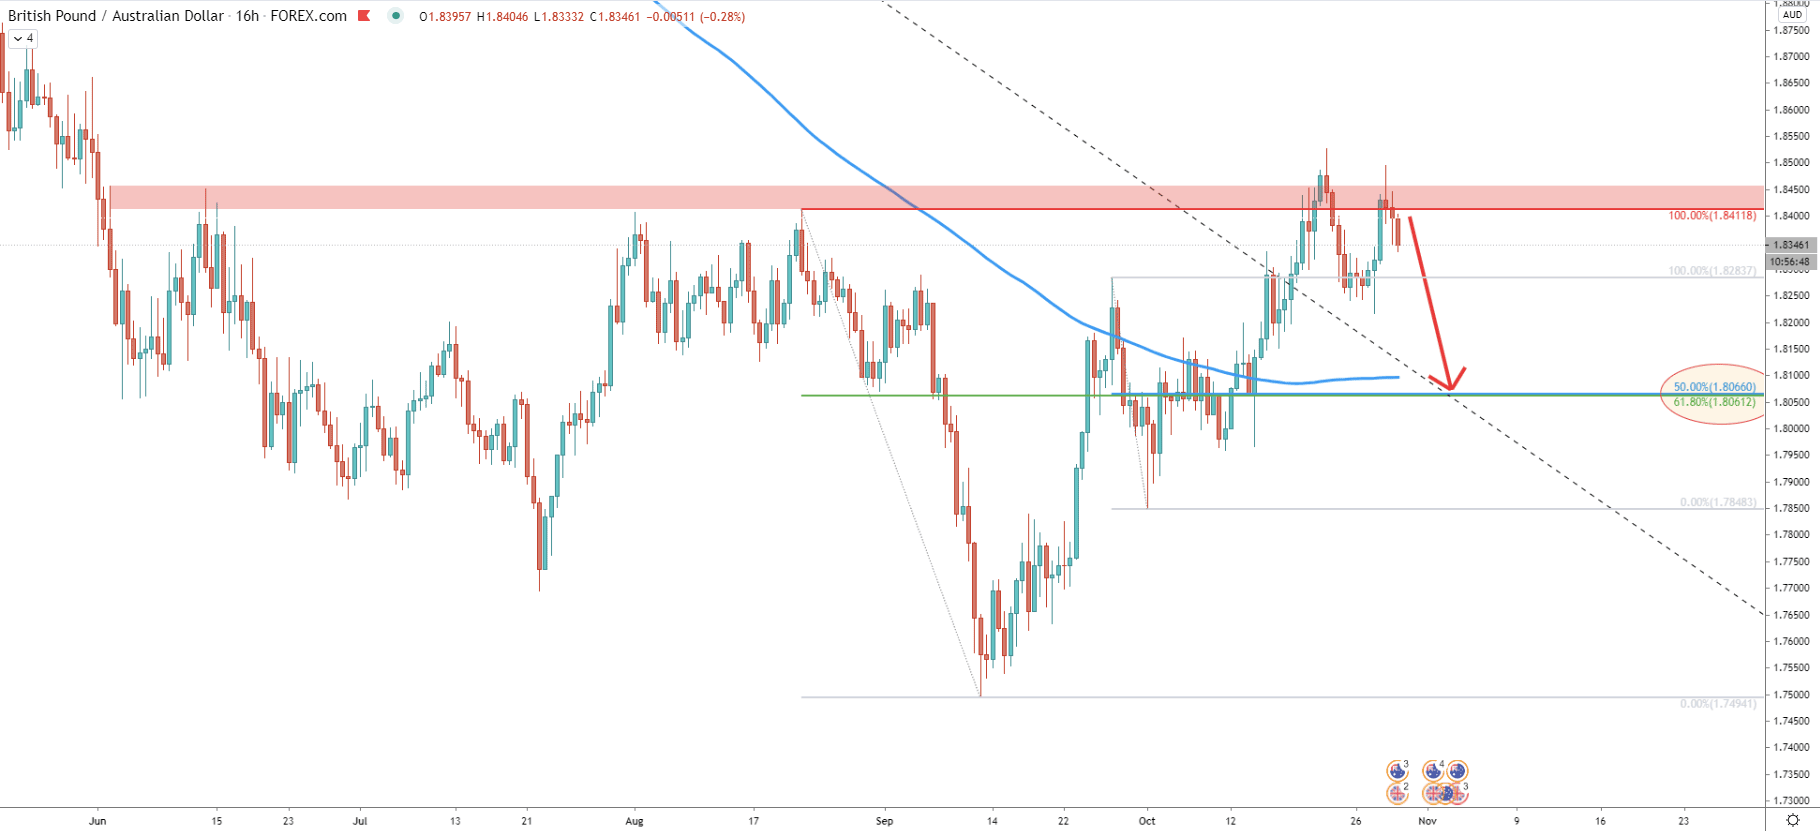
Here the resistance area can be seen more clearly and currently it seems like GBP/AUD has produced a double top after the second attempt to break above the most recently printed high. Maybe from next week, the downside move will take place, resulting in a nearly 300 pips drop. The support on this char is confirmed by two Fibs, 50% and 61.8%, both of which are near the 1.8060 support area. Also, the support corresponds to the downtrend trendline as well as the 200 Exponential Moving Average, making it a strong demand zone where the correction could be ending.
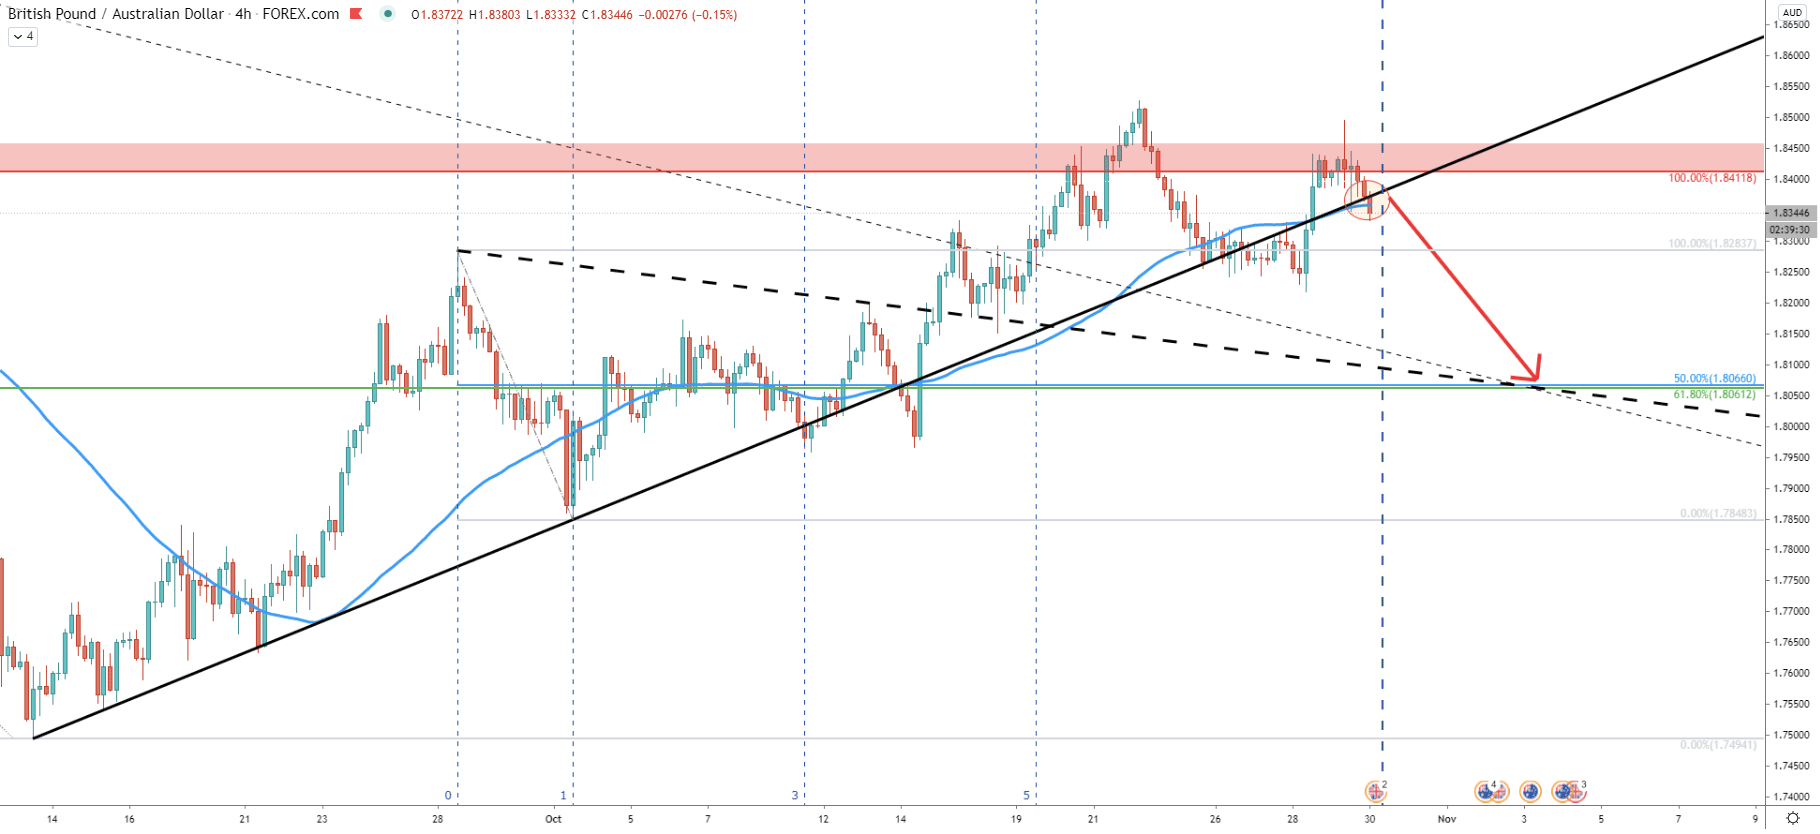
Today GBP/AUD is attempting to break below the upturned trendline and the 50 EMA at the same time, If it will succeed, the probability of further decline will increase substantially. The Fibonacci cycles show, that the next cycle will start within few 4-hour candles, suggesting the beginning of the downtrend to start from today. Obviously, this is only if the 1.8527 will not be touched again. The downside target here corresponds with yet another average-price downtrend trendline, suggesting that GBP/AUD could decline by 300 pips within the next 7 trading days.
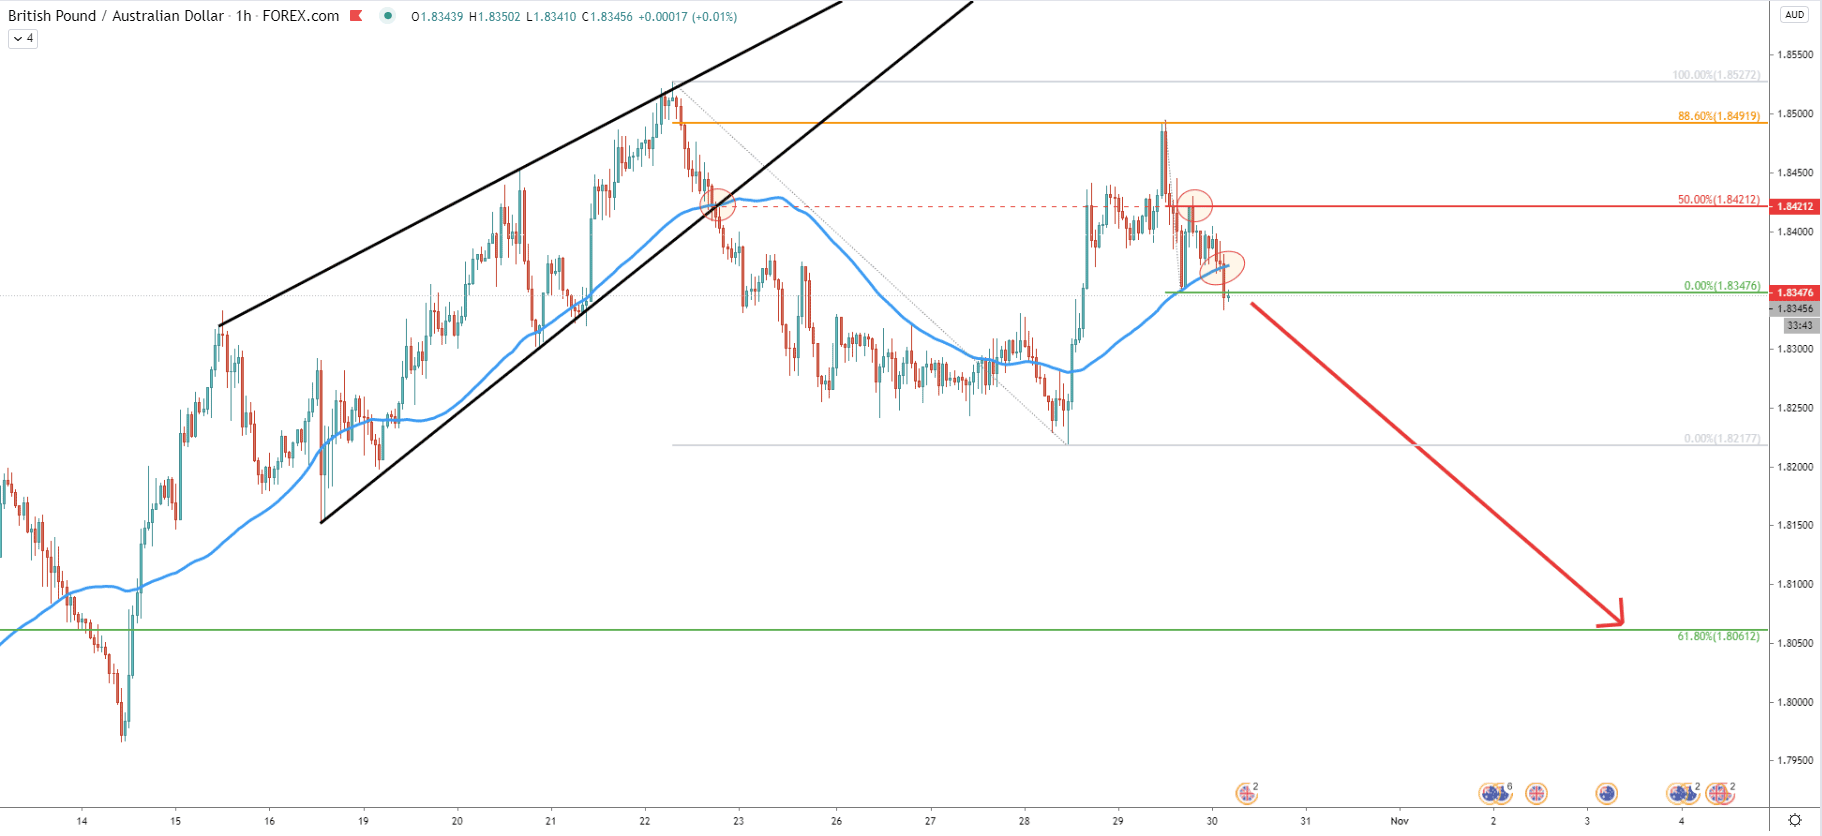
And finally comes the hourly chart, where has rejected the 50% Fibs at 1.8421. This is also the area of the breakout of the downtrend trendline as well st the 50 EMA. After the rejection of the resistance, GBP/AUD broke below the most recent low as well as 50 EMA. This is yet another confirmation that the downside move might be just around the corner and selling pressure is likely to increase this Friday. Nonetheless, there is a possibility that GBP/AUD will attempt to re-test the 88.6% Fibs at 1.8491, but most importantly it must stay below 1.8527 for the downside move to take place.
Right now GBP/AUD is trading right at the key resistance area, which has been formed during the past 5 months. On smaller timeframes price action starting to turn bearish, suggesting the beginning of the downside wave.
As per the weekly, daily, and 16-hour chart, the key support area is located at 1.8060 and is confirmed by 3 Fibonacci retracement levels as well as multiple trendlines.
Daily break and close above 1.8527 will immediately invalidate bearish forecast and the probability of the uptrend continuation will become very high.
Support: 1.8347, 1.8217, 1.8060
Resistance: 1.8400, 1.849, 1.8527