
Published: January 22nd, 2021
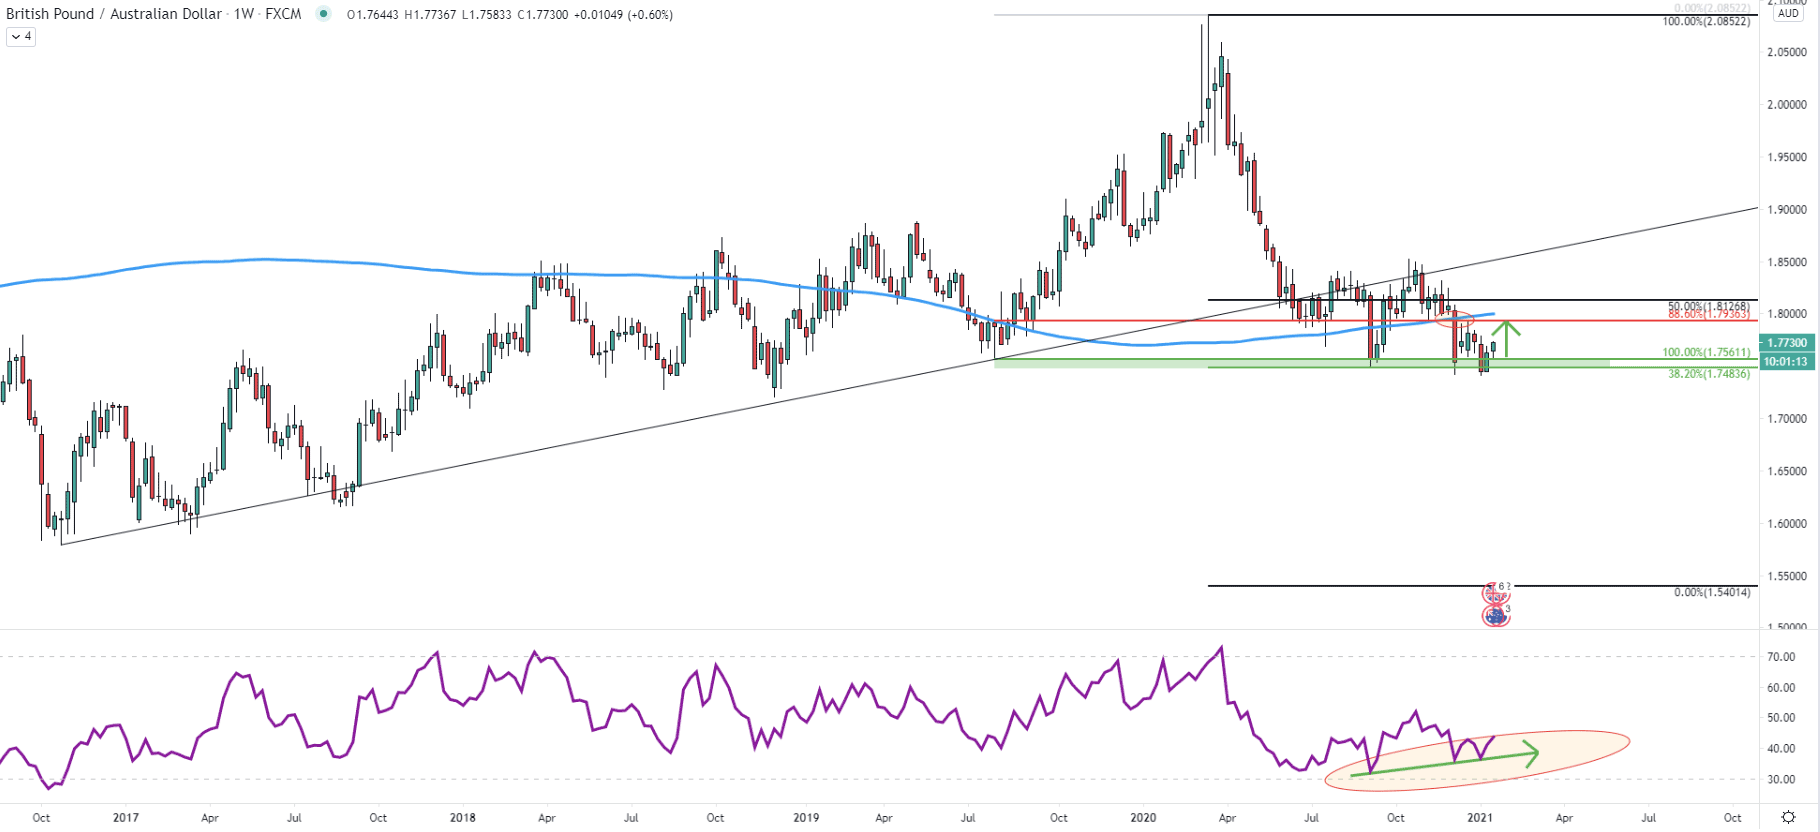
On the weekly chart, the trend has been bullish from October 2017 up until the June of 2020, the point in time when the price broke below the uptrend trendline. Fibonacci retracement indicator was applied so that the 50% is placed at the breakout point of the uptrend trenldine. It shows that the final downside target for the potential downtrend could be located at 0% Fibs, which is a 1.5400 psychological level. However, on September 7, there was a clear rejection of the 38.2% Fibs which is at 1.7483, implying that the local bottom could have been tested. And in fact, after 3 months this support area was tested and rejected yet again, suggesting the formation of the double bottom.
At the same time, a bullish divergence was formed on the RSI oscillator, also suggesting that an upside move on its’ way. The nearest resistance could be located at 1.7936, which is an 88.6% Fibonacci retracement level applied to the last wave up, where GBP/AUD topped out at 2.0855. This resistance corresponds to the previous supply/demand zone and the point of rejection of the 200 Simple Moving Average. All-in-all, there is a potential 200 pip move to the upside as long as the key support holds, which we will discuss in the analysis of a 1-hour chart.
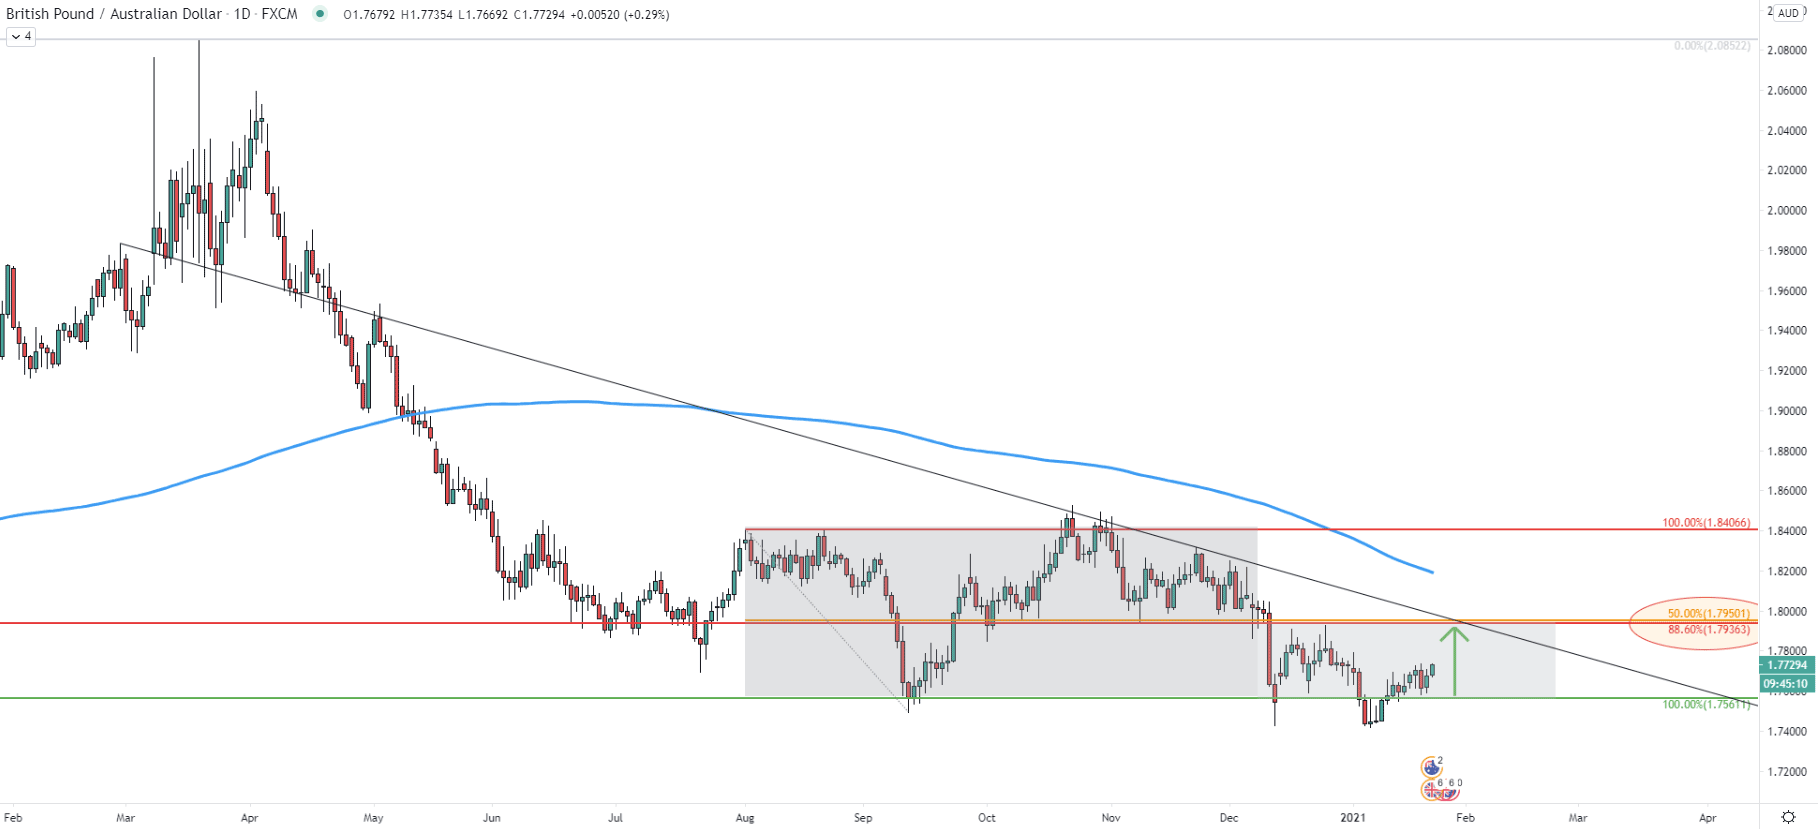
On the daily chart, it can be seen that right now GBP/AUD is trading within a very wide range. The support has been formed near 1.7560 and the resistance near 1.8400 psychological level. This is nearly a 1000 pip wide consolidation where the price has been stuck since August last year. At the same time, there is another range formed during the past few months. The support level is the same but the resistance is near 1.7950. This could be the point of interest for the sellers and at the same time, it could be the potential upside target for the next wave up. This resistance corresponds to the 88.6%, 50% Fibs as well as the average-price downtrend trenldine. If the downtrend is to continue, the 1.7950 area seems like an ideal supply zone.
At the beginning of December price has broken above the simple downtrend trendline after which it corrected down and rejected the 1.7561 support. The following move was up, which resulted in the break above the 50 SMA. Right now, GBP/AUD could be heading north, to test the 1.7963 resistance, which one this chart corresponds to the very strong supply/demand area as can be seen on the chart. Also, the upside target corresponds to the simple downtrend trenldine, which implies a very fast price increase. Therefore, there is a potential for a short-term rally on lower timeframes, especially if the price stays above teh 50 SMA.

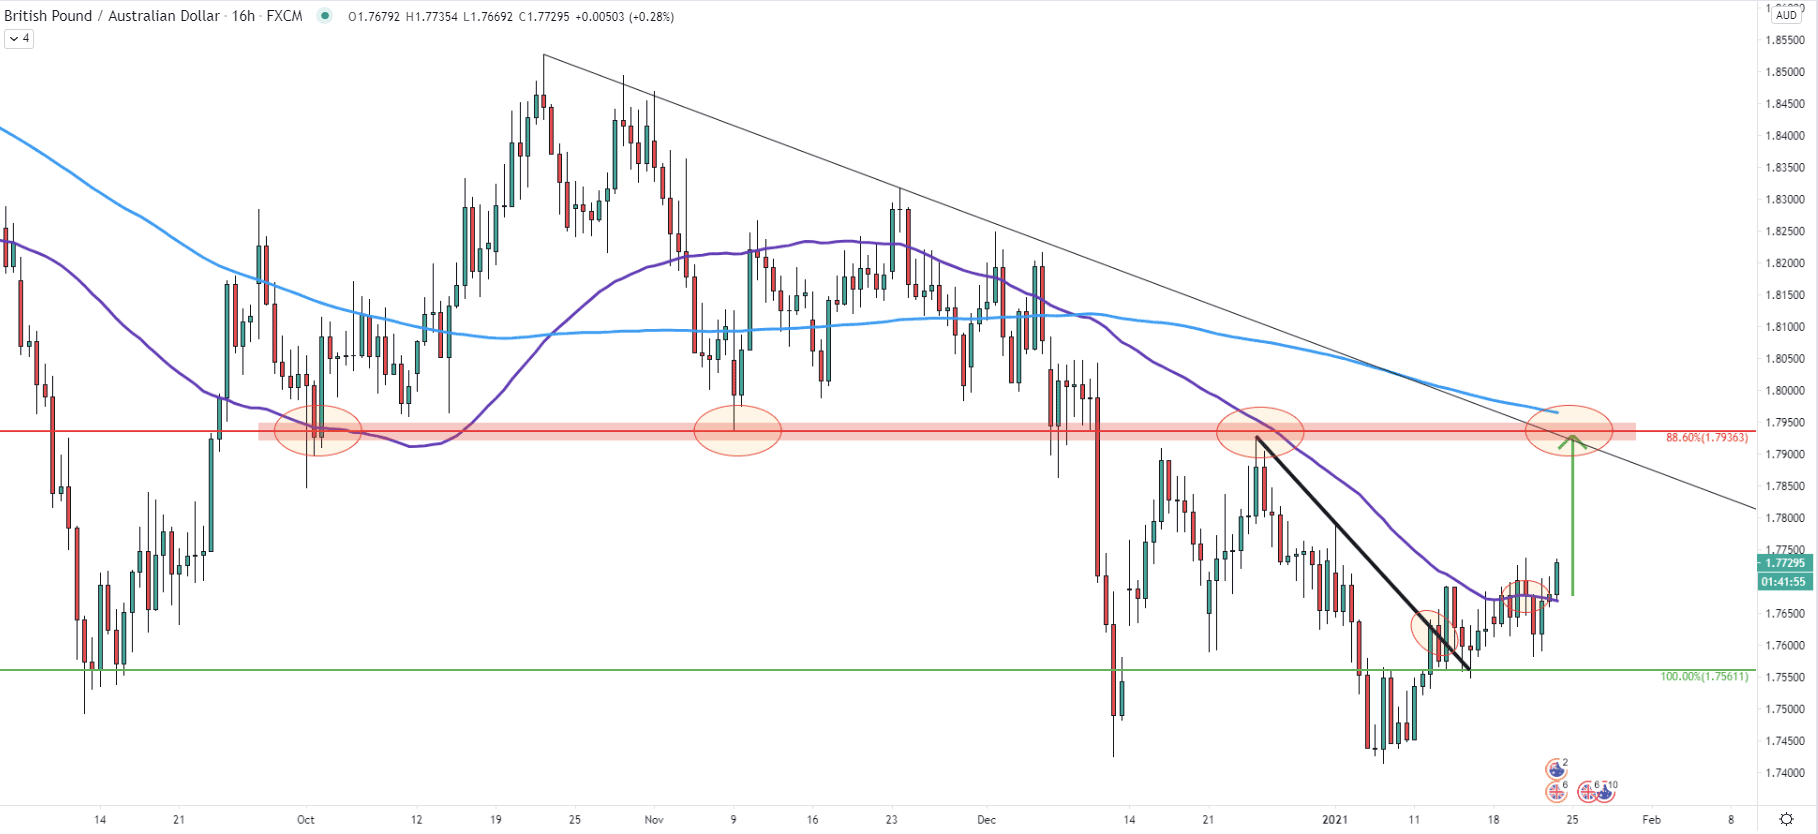
On the 4-hour chart, GBP/AUD found the support at 1.7561, where the 50 SMA was rejected. The price went up and broke above the descending channel. Fibonacci retracement indicator was used, where 50% level is placed at the channel breakout point. It shows that the final upside target, which is 0% retracement level, corresponds exactly to the previously discussed resistance at 1.7936. Finally, right now the price is attempting to break above the 200 EMA, and when/if that occurs, buying pressure could increase, resulting in the fast growth in a relatively short period of time.
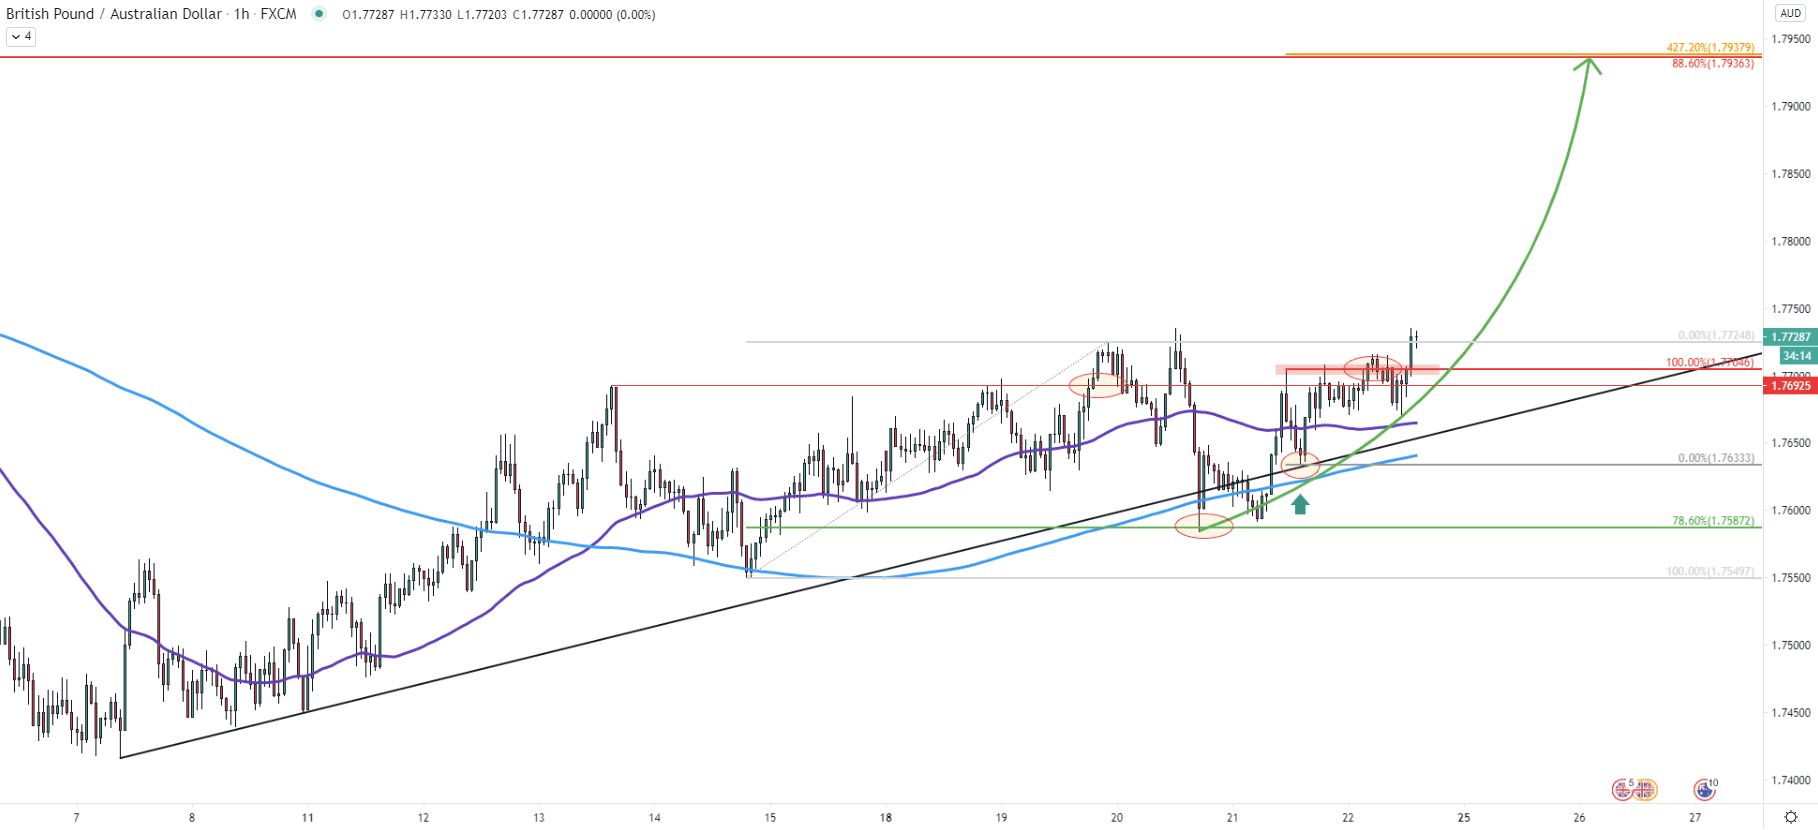
On the hourly chart, it can be seen that the previous resistance, formed on December 13 at 1.7692 was broken. Currently, higher lows and higher highs pattern is in place, validating the uptrend. The recent price action shows that after the break above the 1.7692 resistance GBP/AUD corrected down and rejected the 78.6% Fibs at 1.7587, which is the key support level to watch. After that price rejected the uptrend trendline and broke above the local resistance at 1.7704. Overall, the key psychological resistance at 1.7700 was penetrated, yet again confirming the validity of an uptrend. Therefore, the upside move seems imminent as long as the price remains above 1.7587 support. But at the same time, short term consolidation can take place before/if the uptrend will continue. And the last thing is that 1.7936 resistance now corresponds to the third Fibonacci level, this time it is 427.2% Fibs applied to the corrective wave down where the uptrend trendline was rejected.
GBP/AUD has formed a double bottom while the RSI oscillator has formed a bullish divergence. The current price action on multiple timeframes shows that the probability is in favor of an uptrend, in the short to medium term. This might result in a price increase of 200 pips throughout next week.
As per the weekly, 4-hour, and 1-hour chart, the key resistance and the potential upside target is located at 1.7936. This resistance corresponds to 3 different Fibonacci retracement levels, making it a perfect supply area.
As per the hourly chart, the key support is at 1.7587, where 78.6% Fibs got rejected. As long as the price is above this level, the uptrend will remain valid. However, the break below will invalidate the bullish outlook, and in this case, the long-term downtrend can be expected to continue.
Support: 1.7633, 1.7587
Resistance: 1.7735, 1.7936


