Published: November 26th, 2020
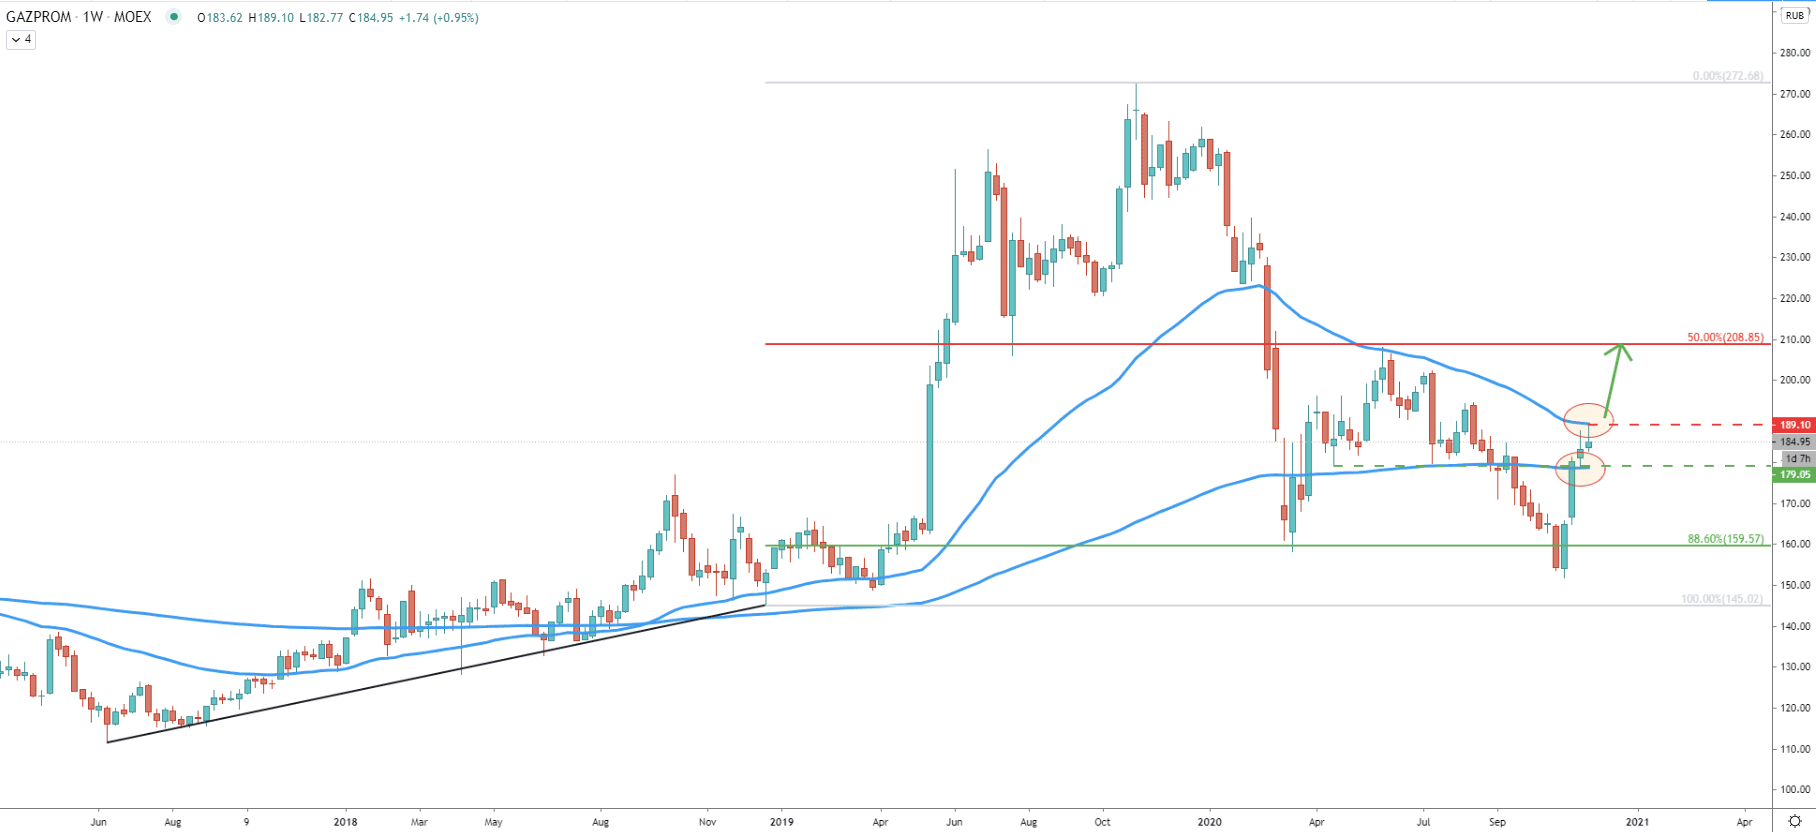
On the weekly chart, it seems like Gazprom has initiated a consolidation phase since the price has rejected the previously established resistance near 208.85. This resistance is confirmed by the 50% Fibonacci retracement level as well as th previously formed support. In regards to the bottom of the range, it has been formed near 159.57, confirmed by 88.6% Fibs and which Gazprom rejected early this year. But, it can be seen that a month ago, this support has been broken, suggesting long-term bearish trend. On the other hand, 200 Simple Moving Average has been broken to the upside, and currently, rice is attempting to break above the downtrend trendline.
Up until now, the weekly close is below the trendline and in order for the uptrend to continue, Gazprom weekly close must be above last weeks’ high. Before that happens, selling pressure might be slowly increasing.
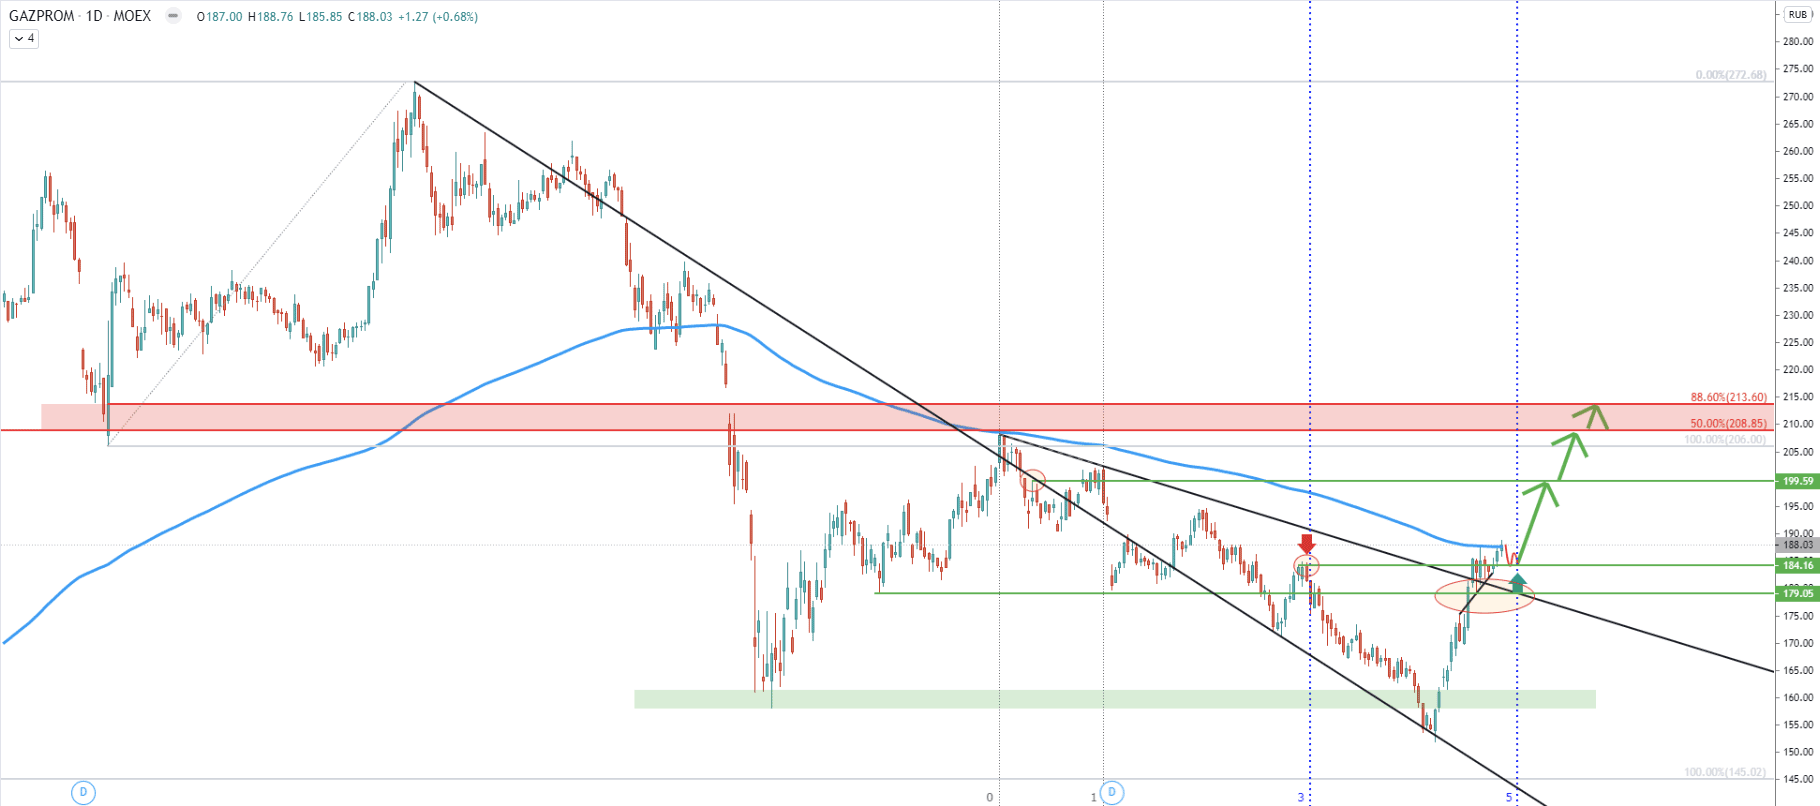
The daily chart shows that the downtrend trendline has been penetrated although the price is now facing yet another resistance. This resistance is the 200 Exponential Moving Average, which was rejected cleanly one month ago. This month’s price is attempting to break to the upside, although still struggling. Therefore, a consolidation phase might take place for several weeks, perhaps until the point when the next Fibonacci cycle starts. If the current month will be able to close above the EMA, the next cycle is highly likely to be bullish. Although close below, might be the very first sign that the trend is about to reverse to the downside.
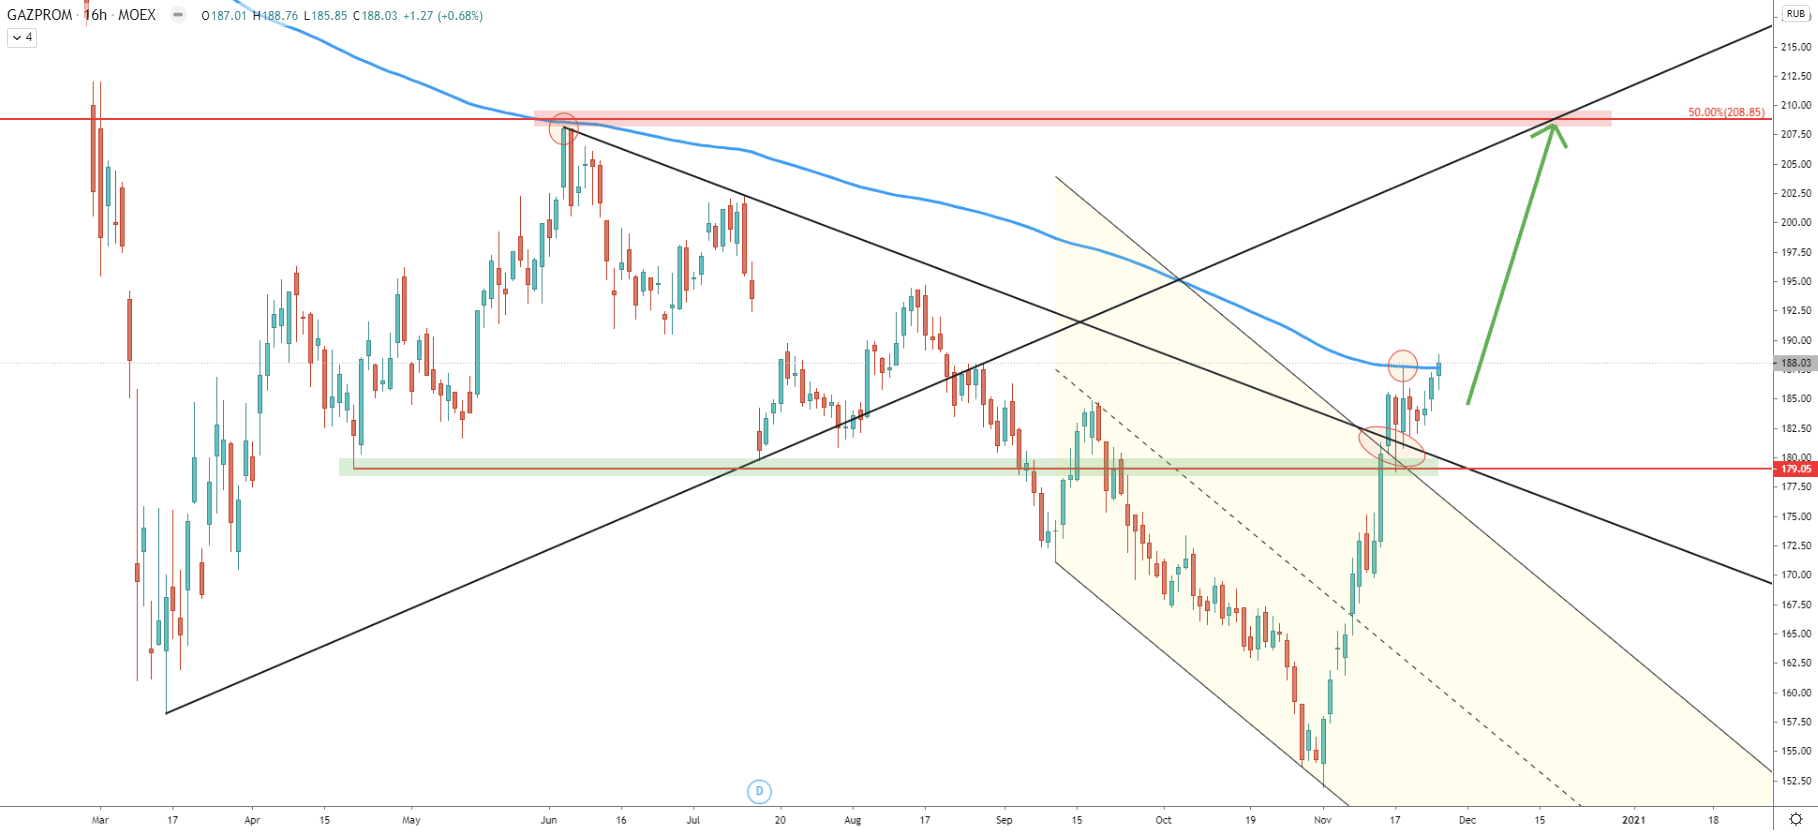
On the 16-hour chart, there is a similar picture to the one on the daily chart. It can be seen, that 200 EMA has been rejected clearly, but on the other hand, the previous level of support at 179.05 became acted as the support once again and was also rejected. This could be showing indecision in the market, making it very dangerous to either sell or buy Gazprom. However, a monthly close above the 188.00 psychological resistance should confirm the continuation of the bullish trend. In this case, the price could rise as high as 200, which is a strong psychological level, or even as high as 208.85, which is a 50% Fibonacci retracement level corresponding tot the uptrend trendline.
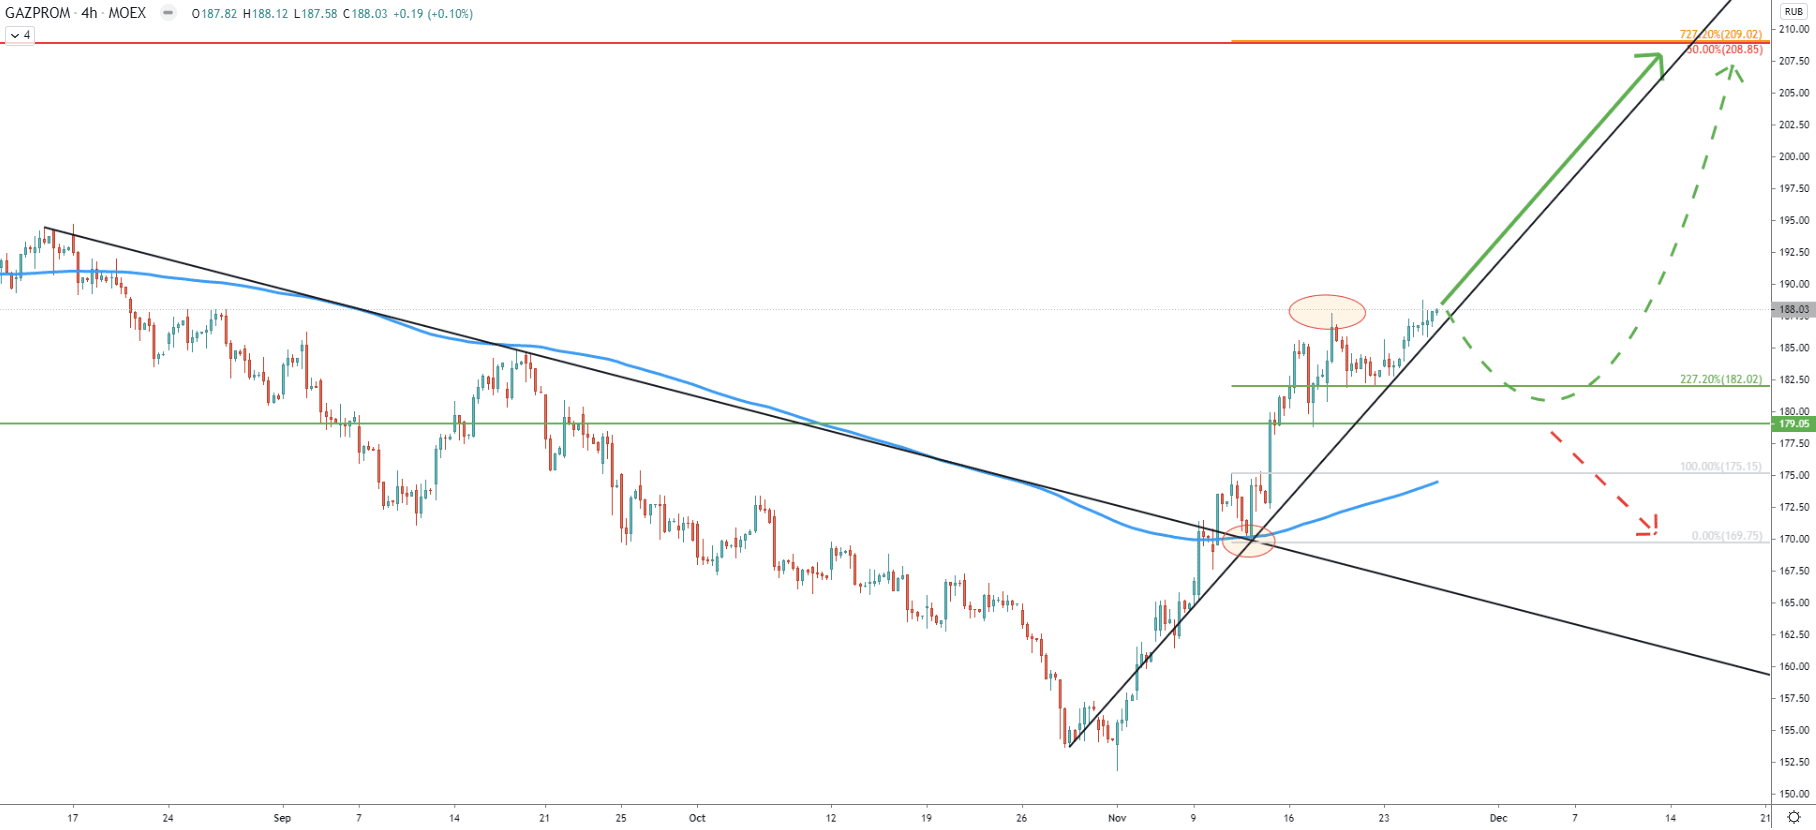
As can be seen, the uptrend trendline is being rejected, suggesting further growth. Nonetheless, the previously formed high hasn’t been broken on the 4-hour timeframe, which could be the confirmation of the further price increase. This is why a correctional move down is likely to take place and might bring the price down to 180.00 psychological support area.
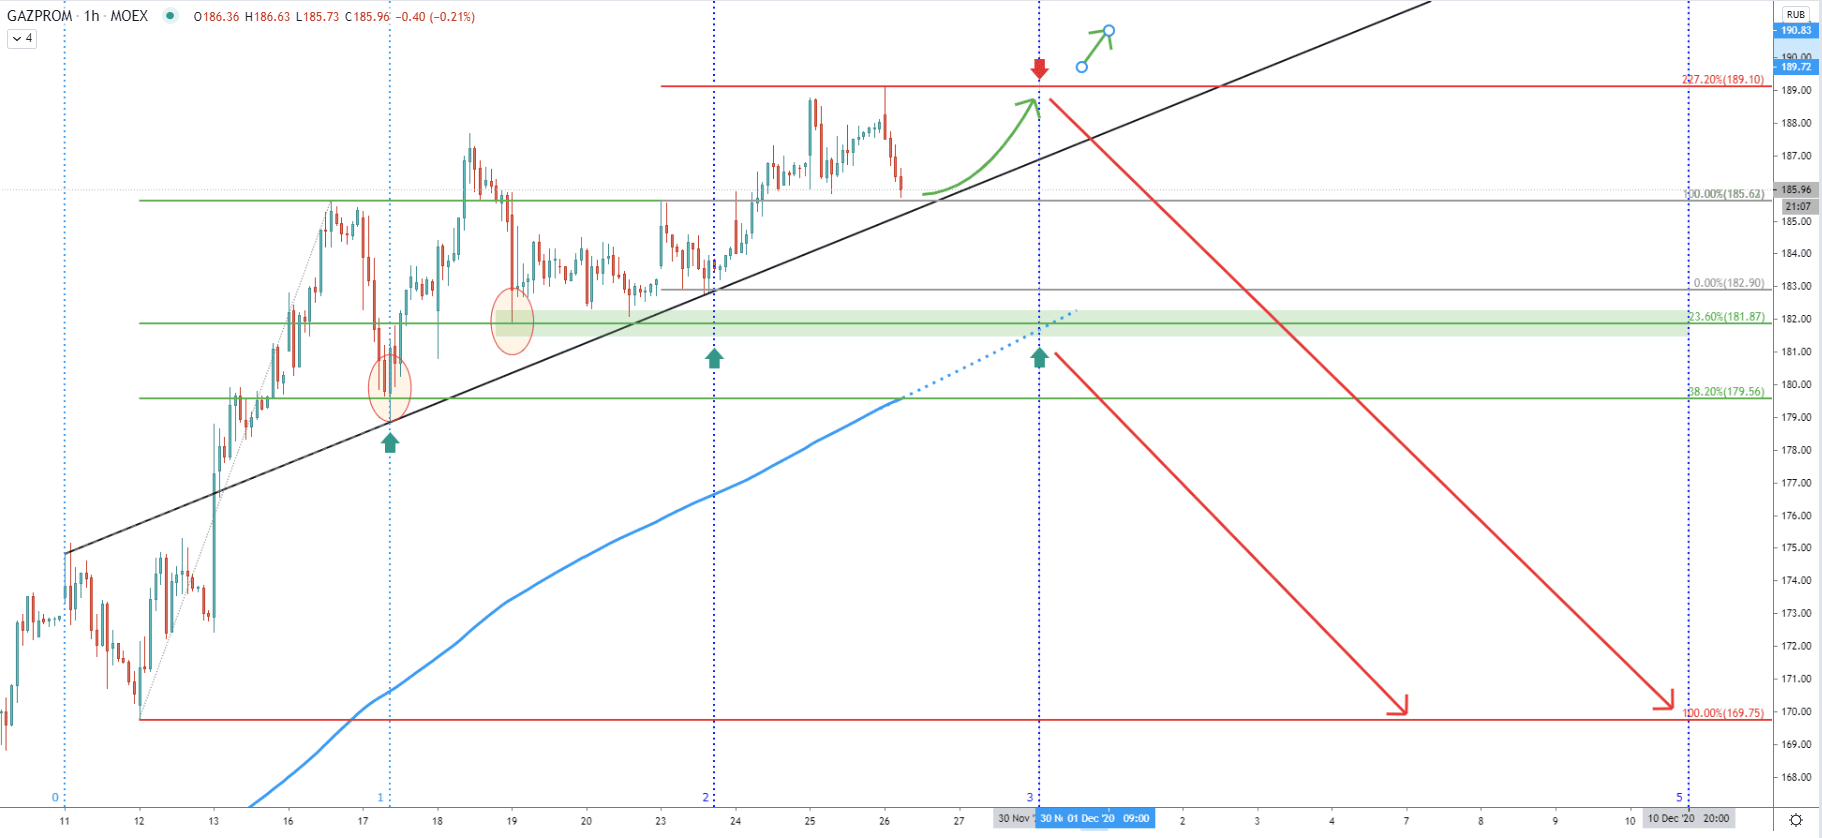
The `1-hour chart seems to provide the key price information, showing that Gazprom could be about to reverse to the downside. Fibonacci applied to the corrective move down when the average-price uptrend trendline has been rejected and the new bullish cycle has started, shows that 227.2% Fibs at 189.10 has been rejected cleanly today. And as long as this resistance holds, especially if the 1h and 4h closing prices will stay below, Gazprom could be slowly reversing to the downside.
The next Fibonacci cycle starts on November 30, and this will be either a bullish or a bearish cycle. But based on the current price action, it seems like sellers are getting full control, and throughout this and next week, trend reversal might take place.
The long-term trend for Gazprom is extremely bullish. However, analysis on lower timeframe show, that it is possible that Gazprom could have reached the top and now is about to reverse to the downside. Overall, as long as 189.10 resistance holds, it will be under strong selling pressure, but weekly and/or monthly close above this level should confirm an uptrend continuation.
As per the 4-hour chart, the key resistance is located at 208.85, although Gazprom is yet to provide confirmation of the bullish trend.
At this point the probability of the downtrend remains very high, especially considering a clean rejection of the resistance on the hourly chart.
Support: 184.00, 182.00
Resistance: 189.10, 208.00


