
Published: April 2nd, 2025
A public blockchain called GateChain was created to make digital asset transactions easier while transaction fees are the main purpose of GateToken (GT), the network's native coin. To safeguard the network and confirm transactions, users can also stake GT and receive rewards in exchange.
Users can manage their digital assets directly on the network with GateChain's on-chain wallet, eliminating the need for third-party wallets. It also seamlessly deploys Ethereum-based smart contracts on the platform because it is completely compatible with the Ethereum Virtual Machine (EVM).
The network maintains incredibly low gas fees, as low as $0.0001 per transaction. It boasts a block duration of only 4 seconds and the ability to process up to 2,745 transactions per second (TPS).
With GateChain, developers may design and implement unique smart contracts, which opens up a plethora of possible applications.
GateChain updated its account system and included an "EVM account" type to entice Ethereum developers. Additionally, the platform supports Ethereum's 0x address, which eliminates the need for users to register for a new GateChain account to manage their assets across both networks using a single address.
Let's see the further outlook from the GT/USDT technical analysis:
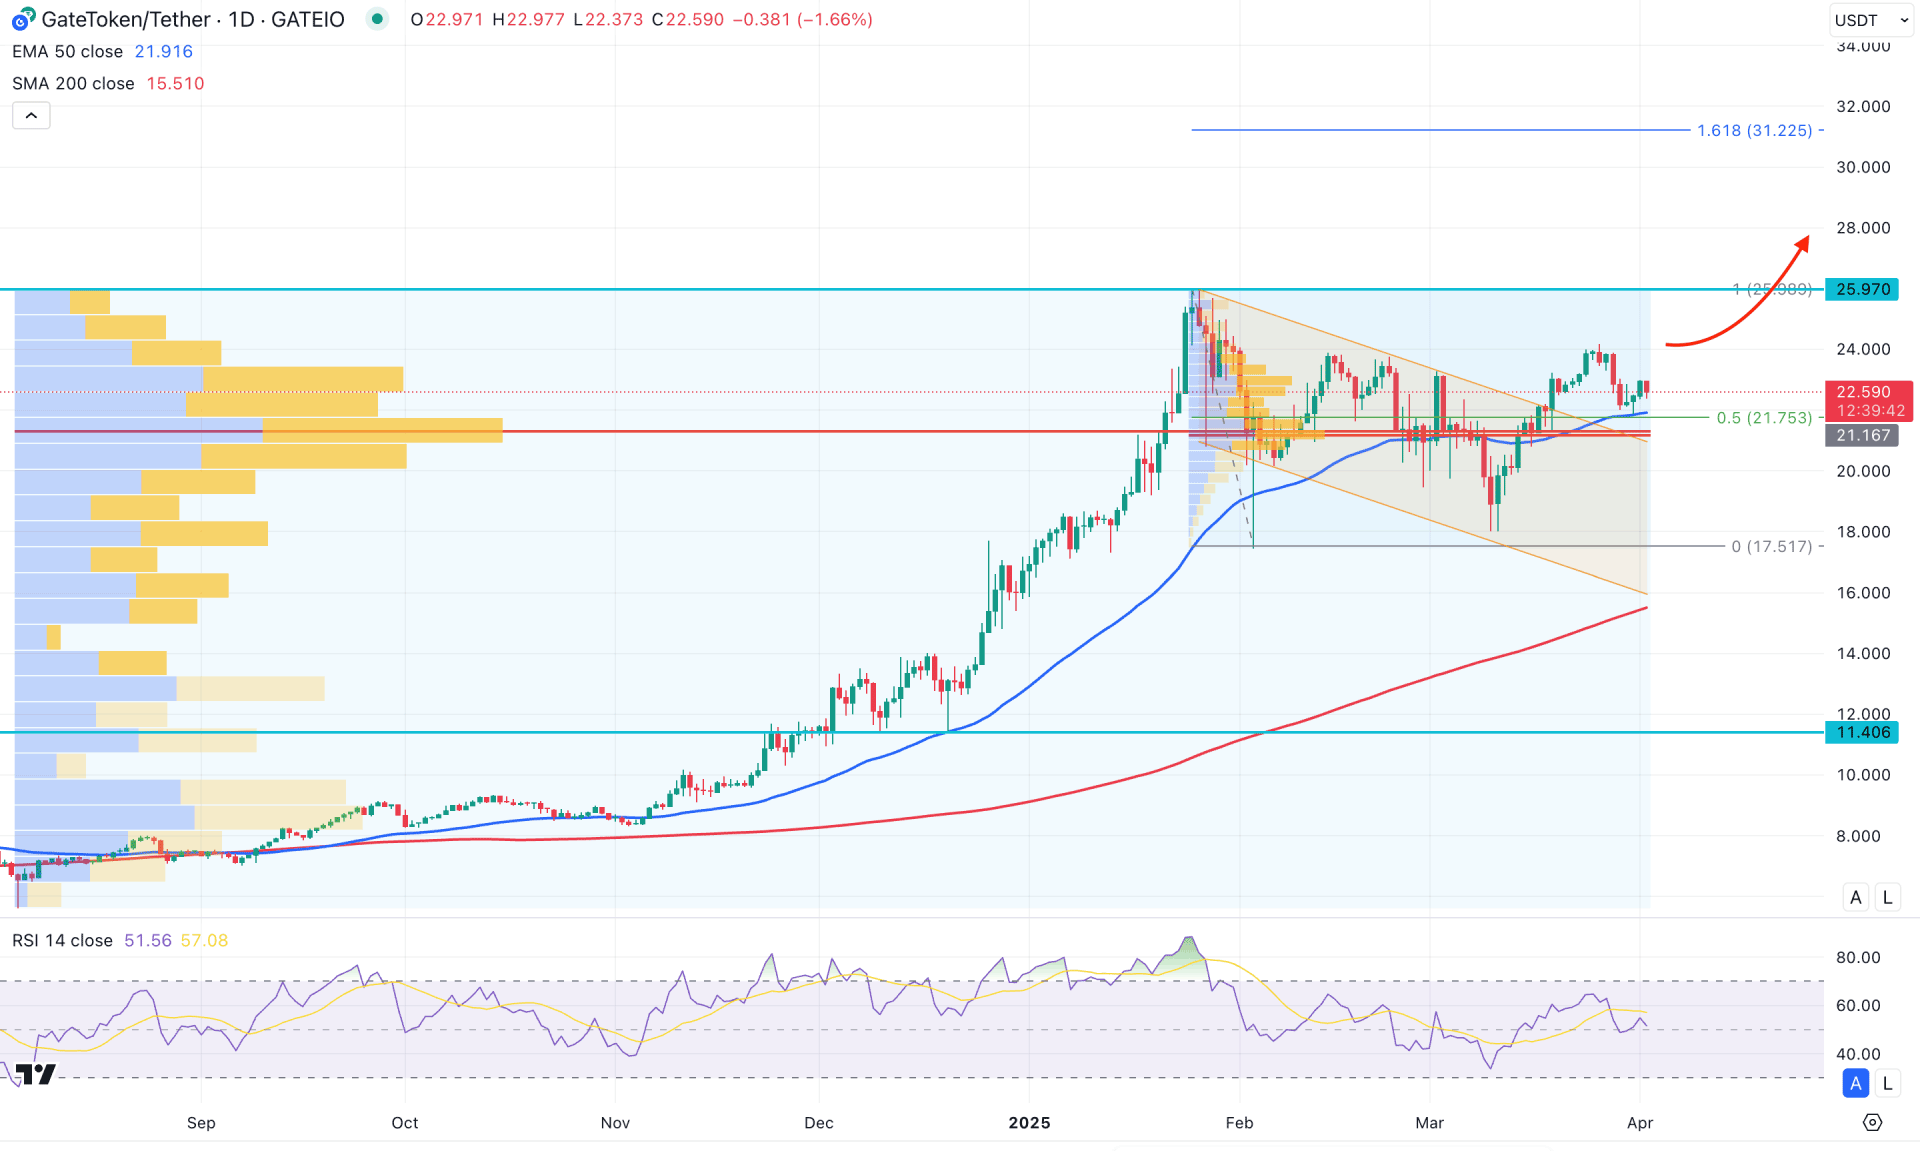
In the Gate Token (GT/USDT) daily chart, the recent price action shows extended bullish pressure, with a 355% gain from the 5.70 bottom to the 225.97 high. After setting this high, the price shows no signs of a downturn. As a result, the bulls are likely to maintain the momentum and push the price above the existing all-time high.
Looking at the volume structure, the most significant level since August 5, 2024, is at the 21.16 level. Another high-volume point from January 24, 2025, aligns with the previous high-volume level. This indicates that the price is trading above the highest activity level, which suggests institutional buyer activity in the market.
Although the bullish trend is important, the gap between the current price and the 200-day SMA has widened, as it is below the 17.51 key support level. However, the 50-day EMA is supporting the price, remaining below the 21.75 immediate static level. In this case, even if the price falls below the 50-day EMA, the bullish trend will remain intact, and the price could rebound at any time, following the major trend.
The Relative Strength Index (RSI) has been moving sideways since February 2025. It is currently hovering around the 50.00 neutral point without any clear direction.
Based on Gate Token's daily market outlook, the recent breakout from the descending channel could present a strong bullish opportunity. In this case, the price is likely to extend higher as long as the 21.16 high-volume level is maintained. A bullish break with a candle closing above the 23.90 level could trigger further bullish pressure, targeting the 31.25 Fibonacci extension level.
On the other hand, failing to hold the price above the channel support would initiate a potential recovery towards the 17.51 bottom before providing another long opportunity. However, a deeper drop below the 200-day SMA would likely invalidate the buying opportunity at any time.
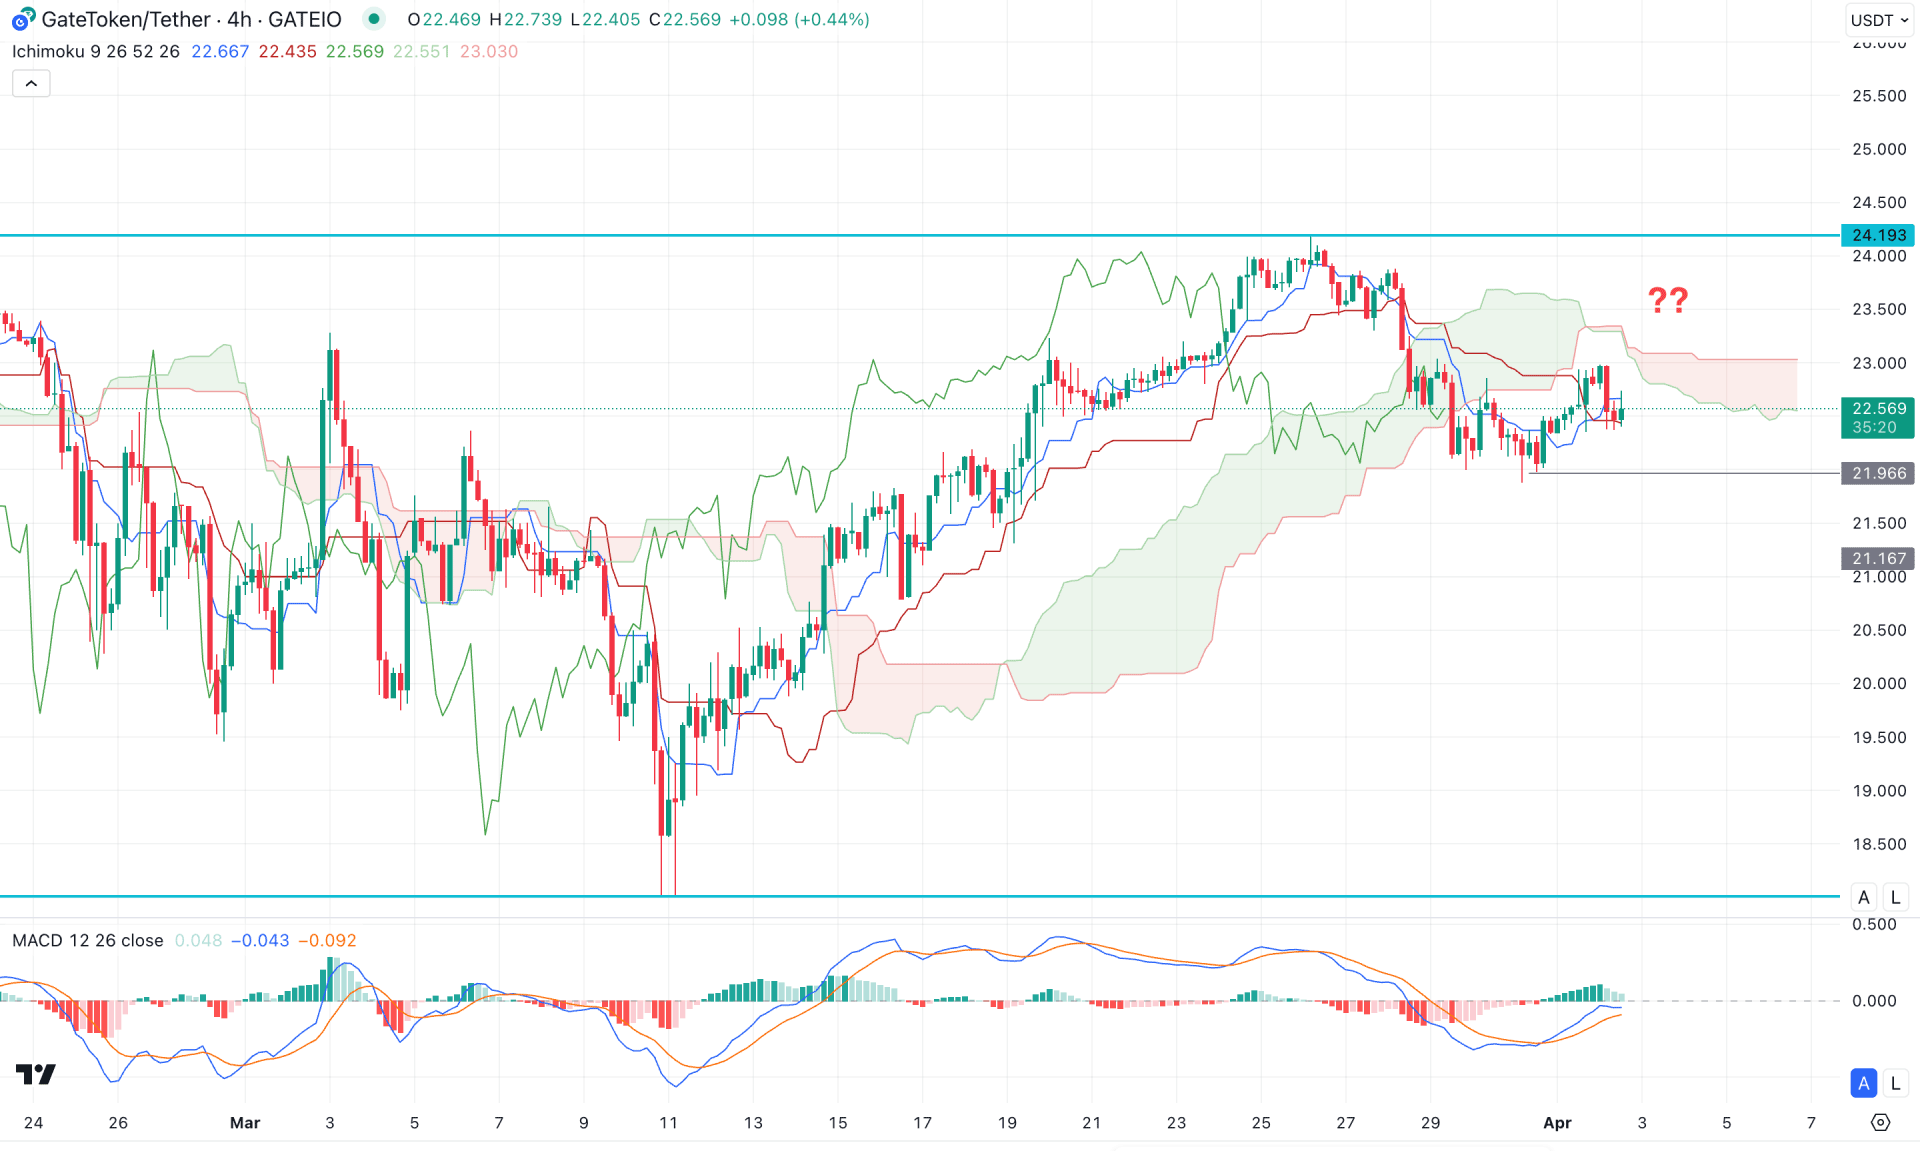
In the 4-hour timeframe, a consolidation is observed as the recent price failed to maintain momentum above the cloud support. As a result, an immediate bearish signal is visible, while the recent price is trading sideways within dynamic lines. Moreover, the future cloud flipped its position, with the Senkou Span A line moving above the flat Senkou Span B line.
In the indicator window, the MACD histogram has started to lose its bullish momentum and closed near the neutral point. Additionally, the signal line has become flat after forming a bullish rebound from the bottom.
Based on the 4-hour outlook, a clear price direction is not yet evident, and investors might wait for a breakout to establish the trend. Primarily, a break below the 21.99 low would initiate a bearish drop, potentially aiming for the 19.74 support level.
On the bullish side, a possible recovery requires a breakout above the 24.18 level, which could extend the momentum beyond the 30.00 area.
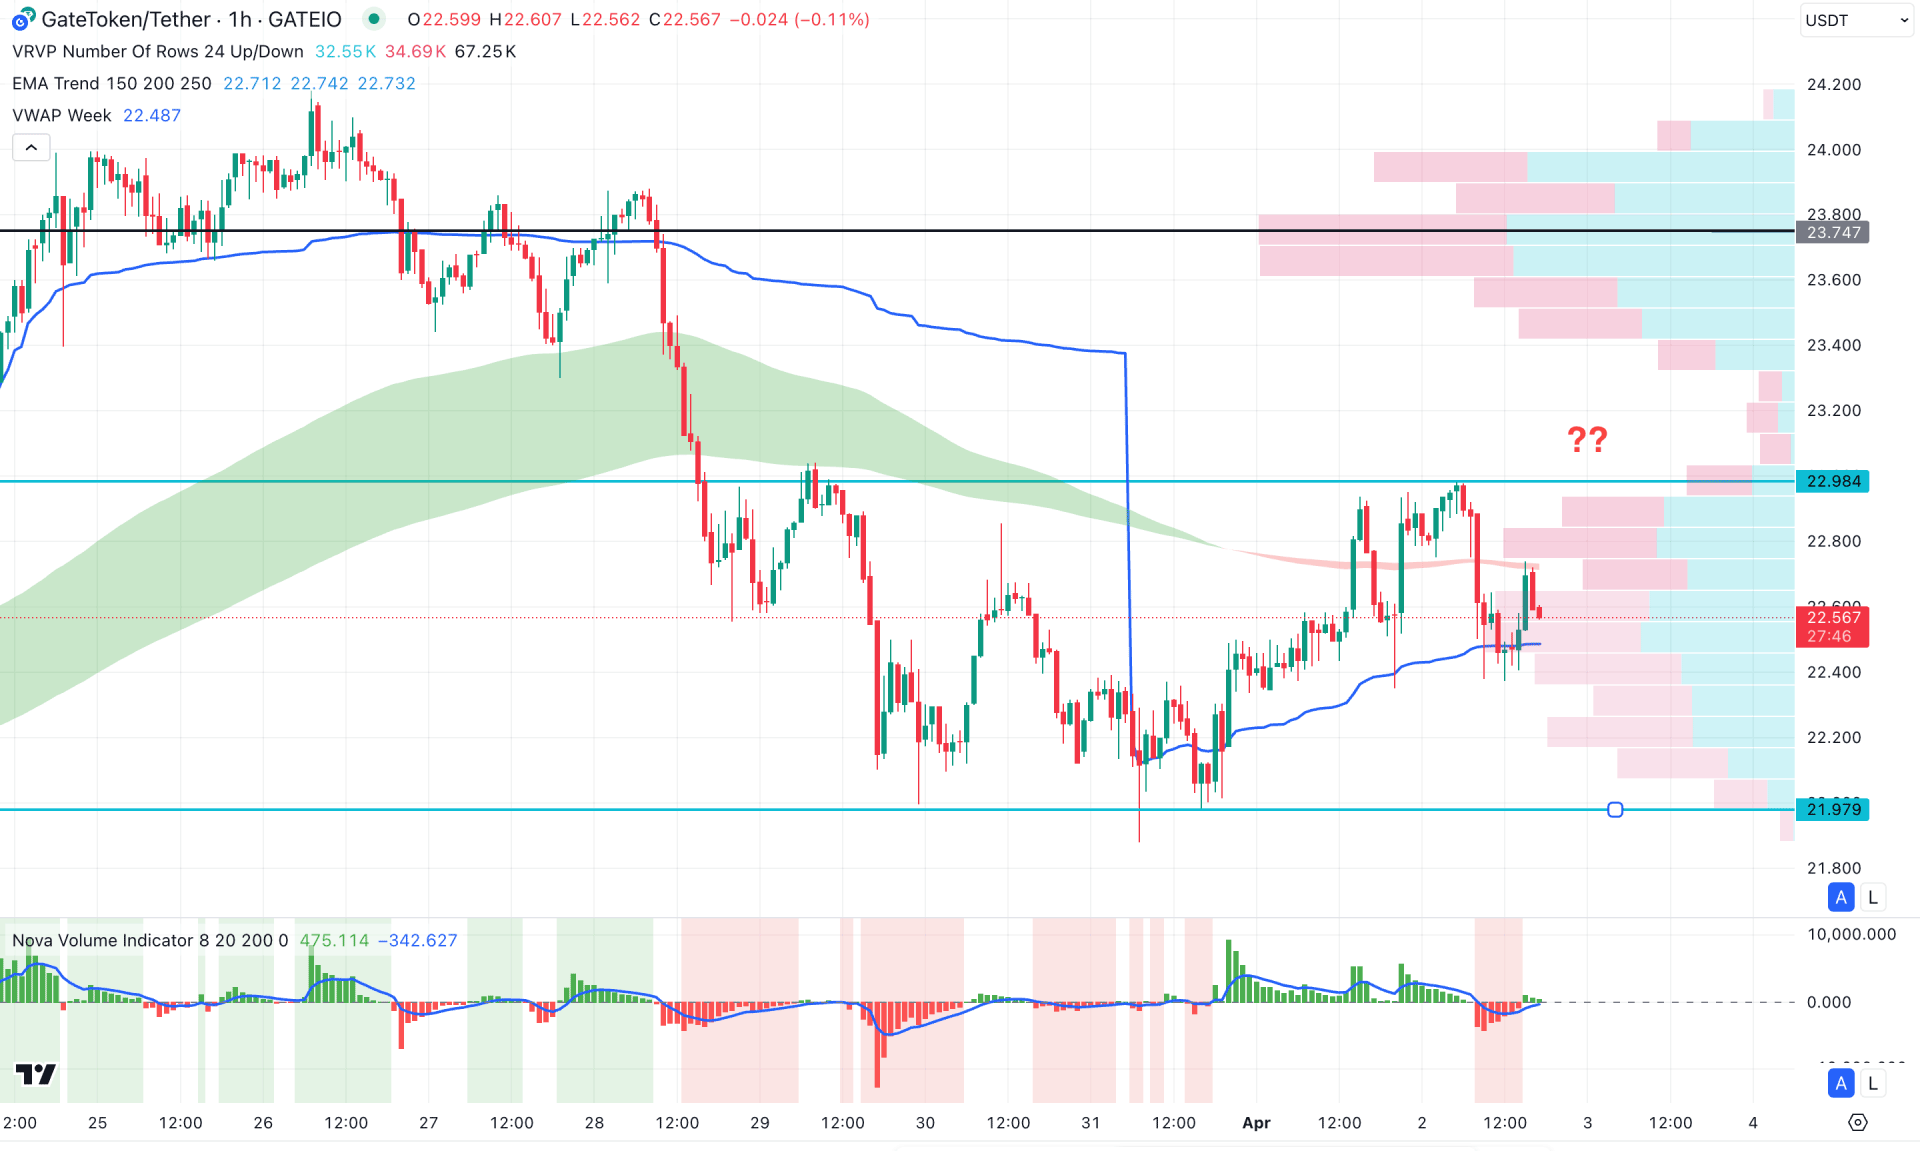
In the hourly time frame, the ongoing market momentum is corrective, where the most recent price is trading below the Moving Average wave area.
On the other hand, the weekly VWAP is below the current price and is working as an immediate support. The volume Histogram shows the same structure, where the current vertical line is closer to the neutral point. It is a sign of a lower activity in the market, which needs proper validation from a breakout.
Based on the hourly structure, the intraday high volume line is above the current price, working as a crucial resistance. In that case, a bearish H1 candle below the weekly VWAP line could be a potential intraday bearish opportunity, aiming for the 21.97 level.
On the other hand, overcoming the 22.98 level could initiate the corrective buying pressure towards the 23.60 level. However, overcoming the 23.74 level might invalidate the current bearish opportunity and initiate a long-term bull run.
Based on the current market structure, GT/USDT is facing intraday selling pressure, from which a bullish recovery might come after a valid breakout. The hourly high volume line is a crucial price area to look at, as bullish pressure beyond this level might signal an early long opportunity.


