
Published: June 12th, 2024
In its second share sale this month, GameStop, the US video game retailer, has raised more than $2 billion. This surge resulted from a rally influenced by investment influencer Keith Gill, also known as Roaring Kitty, who recently returned to YouTube after a three-year absence.
During the pandemic, GameStop's popularity among retail investors contributed to the emergence of meme stocks, which acquired traction through platforms such as Reddit. Significant price volatility was frequently observed in these stocks, which professional investors, including hedge funds, extensively shorted.
On Tuesday, GameStop released a statement to the New York Stock Exchange in which it disclosed that it had sold all 75 million shares it had issued, resulting in a total revenue of $2.137 billion. The company has raised over $3 billion through share sales in the past month, as its market value has increased.
This figure encompasses the $933.4 million generated by the sale of 45 million shares last month. Shares experienced a surge in value earlier this month following the publication of a screenshot by a Reddit account associated with Gill on June 2.
The value of a considerable options position that Gill disclosed earlier this month has experienced significant fluctuations due to volatile stock prices. According to a screenshot posted on June 2, Gill held 120,000 GameStop on June 21 call options with a strike price of $20, purchased at $5.6754 per contract, accumulating $68.1 million. As of June 2, the screenshot also disclosed that he possessed 5 million GameStop shares valued at $115.7 million.
Let's see the future price direction of this stock from the GME technical analysis:
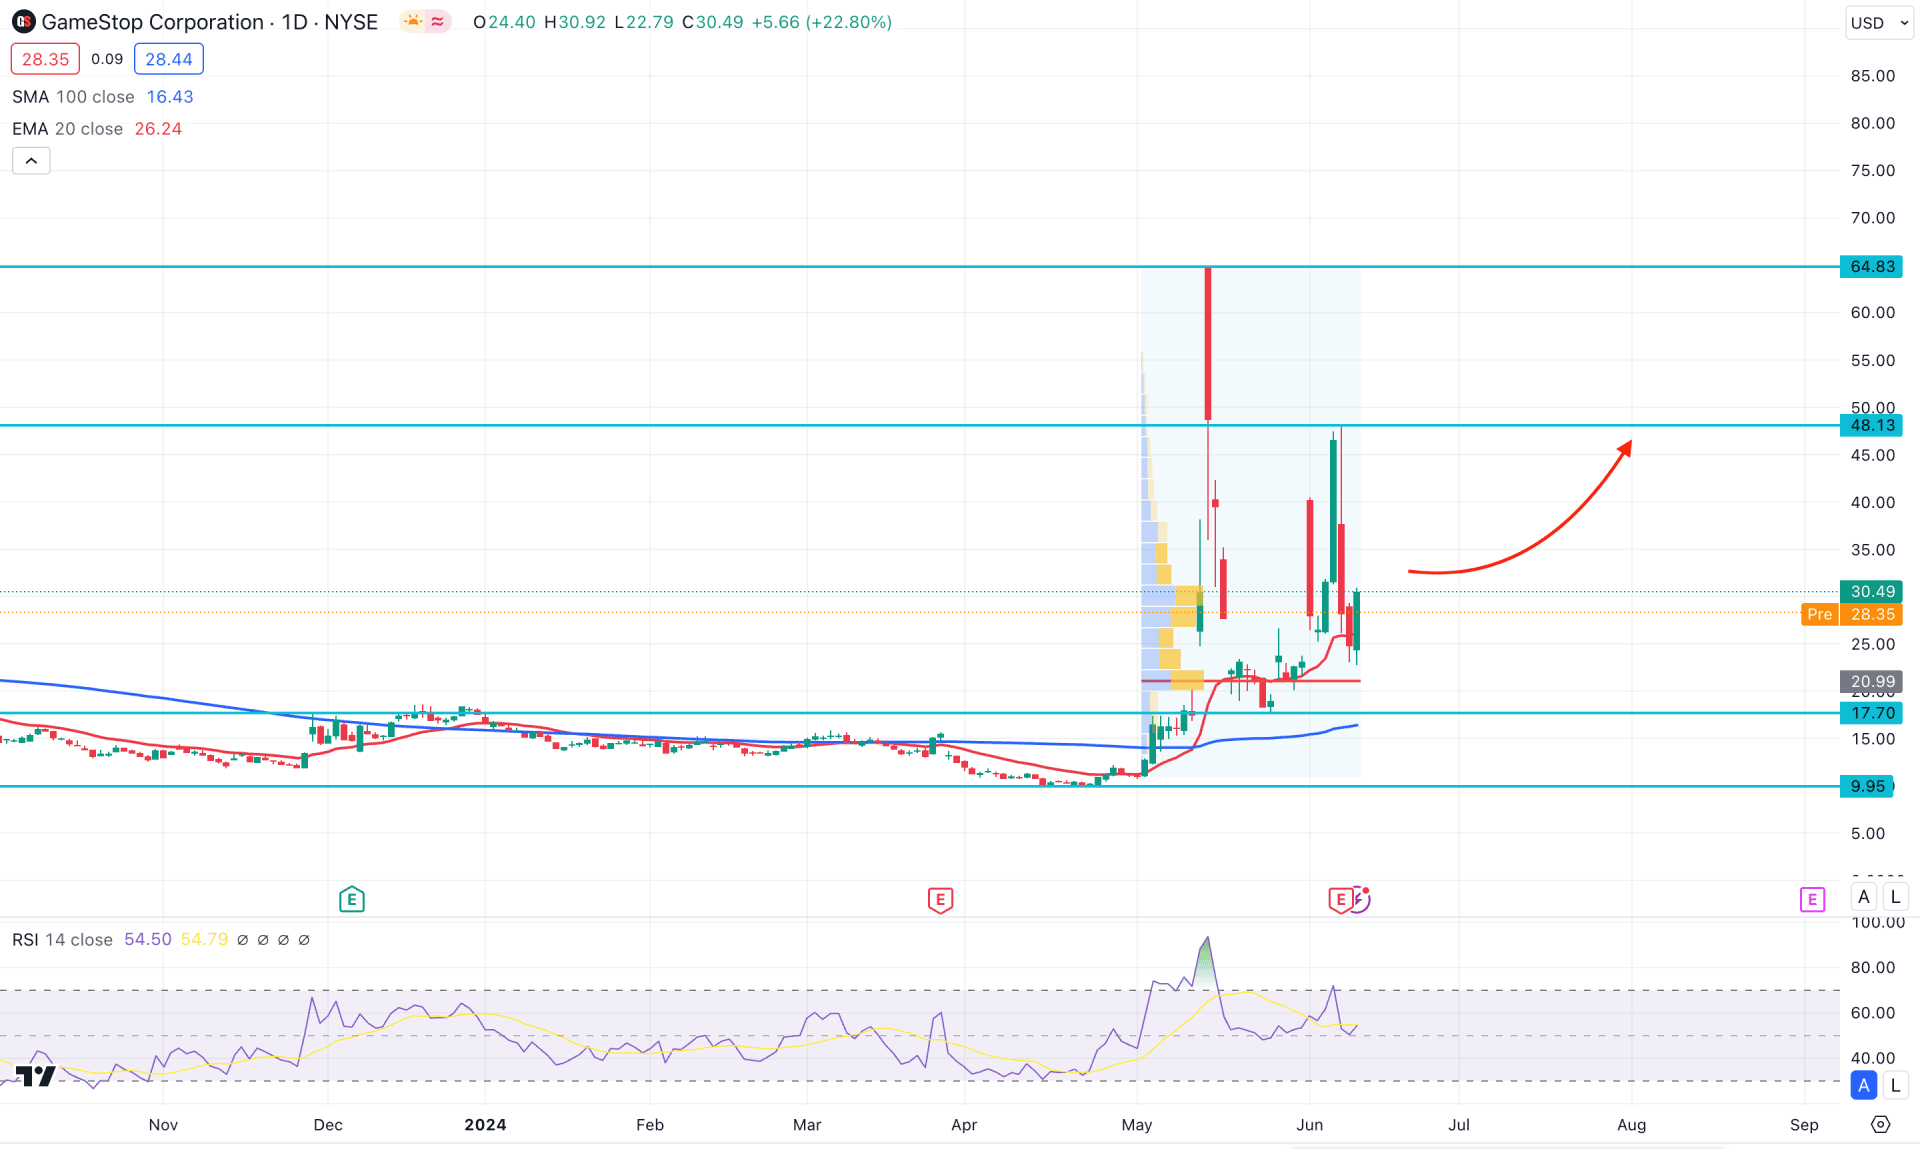
In the daily chart of GME, the recent price showed excessive volatility, creating an immediate upward pressure at the 64.83 high before forming a bearish exhaustion. In this context, investors should remain skeptical, anticipating the stock price with a proper confirmation.
Looking at the higher timeframe, May 2024 came as a blessing to bulls as it came with a potential pennant breakout with a monthly close at the multi-year high. Also, the excessive volatility is visible in the weekly chart, where the current price hovers above the crucial 100-week SMA line.
In the volume structure, the buying pressure is potent as the most recent price hovers above the 20.99 high volume line. Investors may expect the buying pressure to extend as long as the high volume level remains below the current price.
Looking at the daily chart- the 100-day Simple Moving Average is below the 17.70 static support level. It is a sign that long-term investors are still bullish on this stock and can take the price even higher, depending on the price action. Moreover, the 20-day Exponential Moving Average is closer to the current price, working as an immediate support.
In the secondary indicator window, the 14-day Relative Strength Index (RSI) failed to move below the 50.00 line and formed a bullish reversal. It is a sign of buyers' presence in the market, which might initiate buying pressure until the RSI reaches the 70.00 area.
Based on the daily market outlook of GME, the ongoing bullish pressure is potent, as the recent price closed as a bullish two-bar reversal from the 20-day EMA. In that case, the upward pressure is potent, where the main aim would be to test the 18.13 key resistance level.
On the other hand, a struggle to hold the buying pressure above the high volume line with a daily candle below the 17.70 level could limit the buying pressure and lower the price toward the 10.00 psychological level.
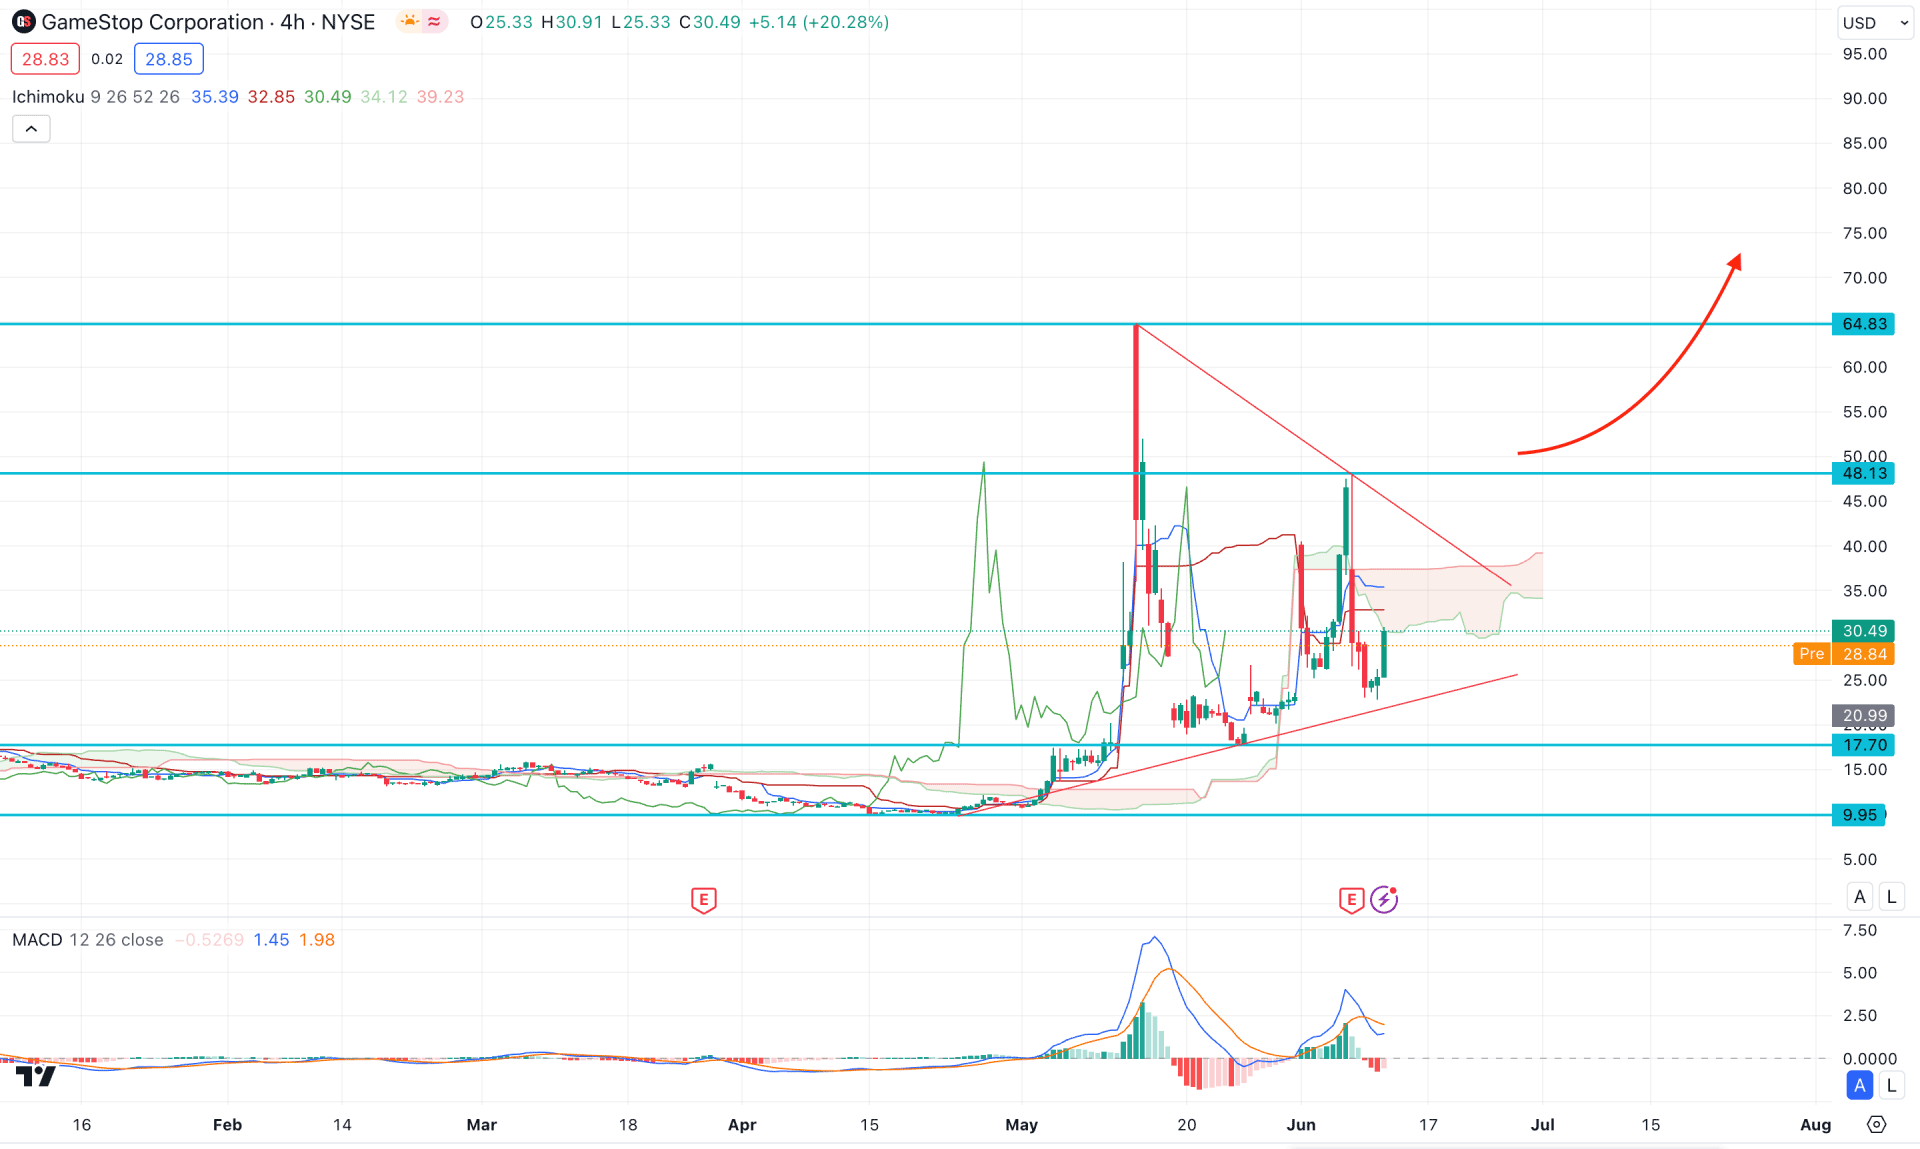
In the H4 timeframe, the ongoing price action is corrective within a bullish pennant pattern. Moreover, the recent price hovers below the dynamic Ichimoku Cloud zone from where no significant selling pressure is visible.
In the future cloud, the Senkou Span A remains below the flat Senkou Span B, showing a mixed sentiment from medium and long-term traders.
In the MACD Indicator, the Histogram shows a minor downside pressure, with an ongoing bearish momentum from the signal line.
Based on the H4 structure, the downside pressure is limited for the GME price, where a valid bearish trend line break could be a potential short opportunity.
On the other hand, the long-term market direction is bullish for this stock, where a valid H4 candle above the Cloud zone could be a bullish opportunity, targeting the 48.00 level. Moreover, a stable market above the 40.00 psychological level could extend the upward pressure above the 64.00 area.
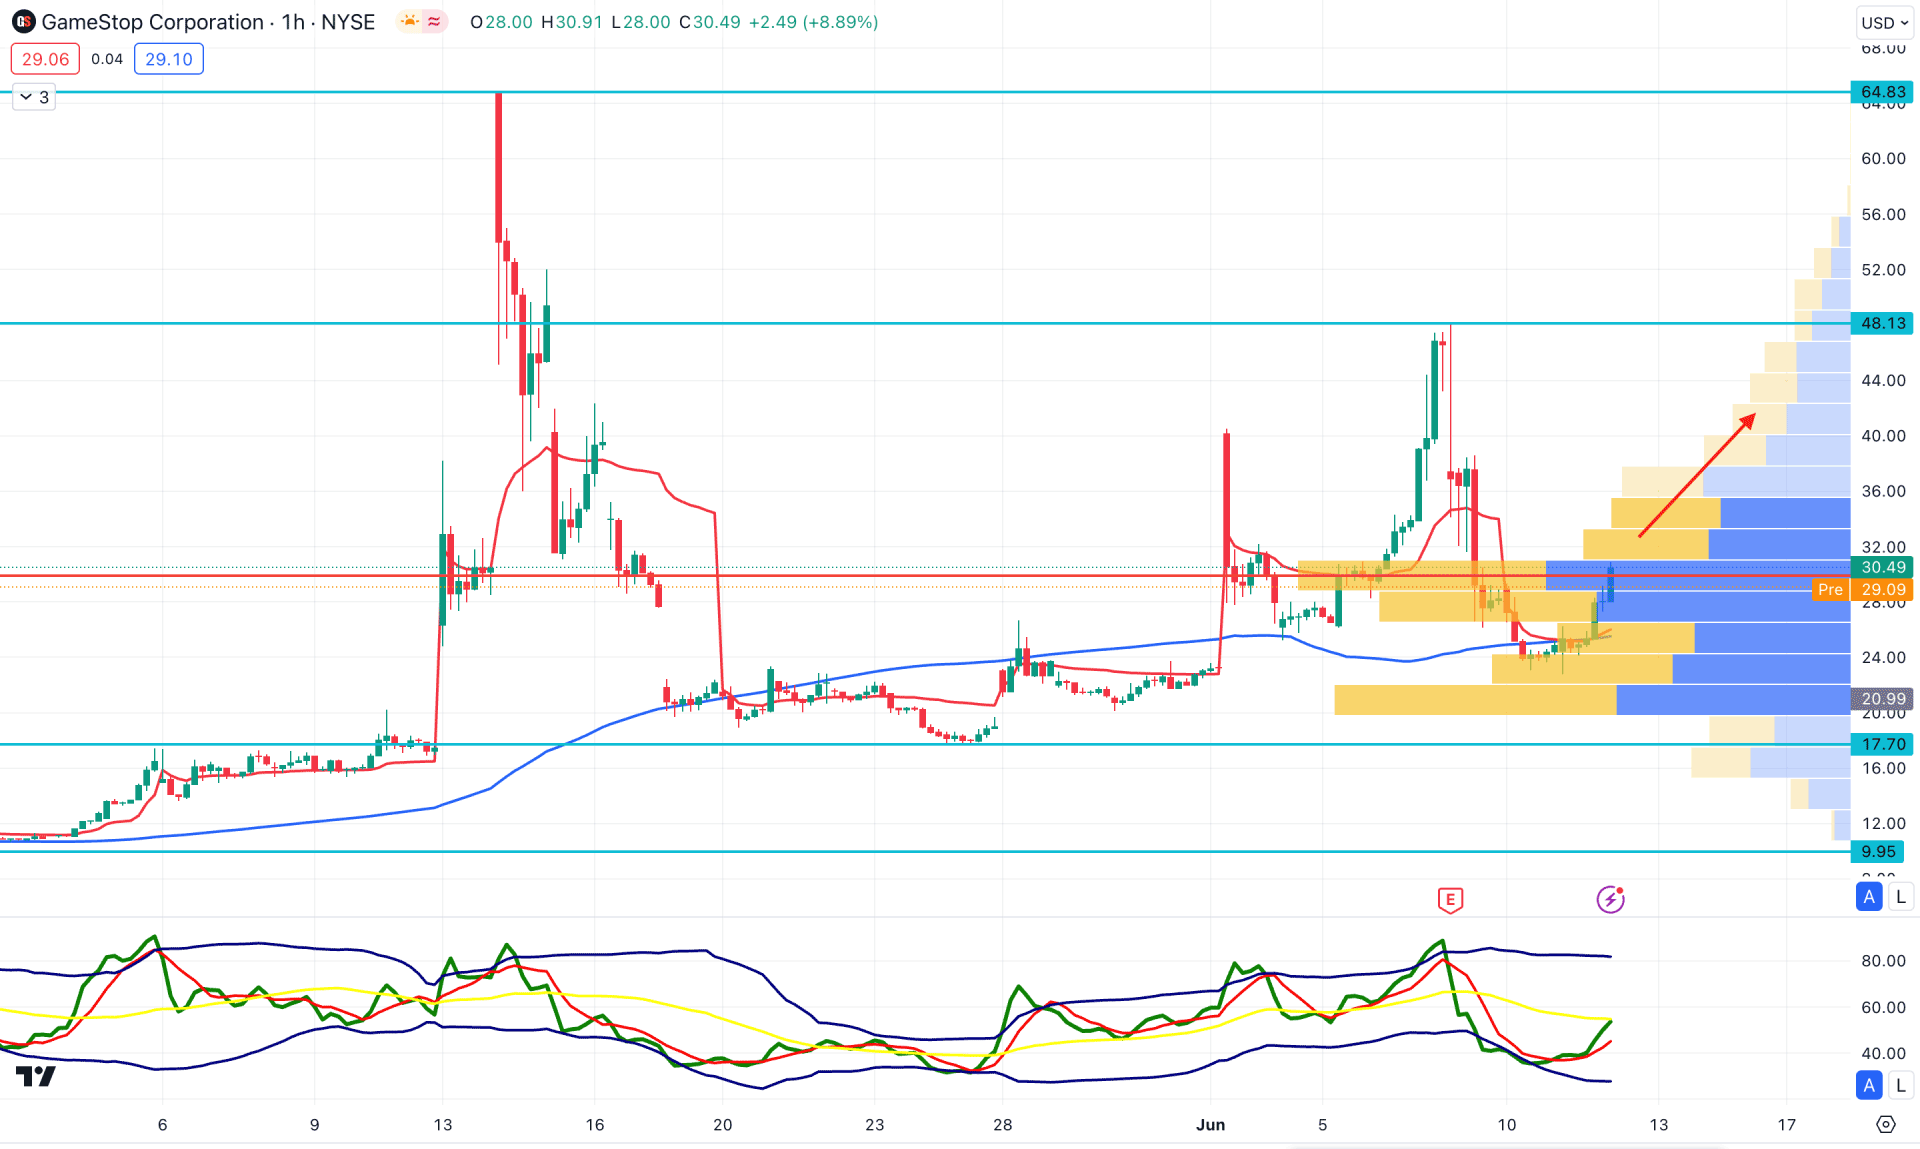
In the hourly time frame, the overall market momentum is sideways, where the current price hovers above the 100-day SMA line. The dynamic weekly VWAP level found a base at the 100 SMA area and showed a confluence bullish signal.
In the volume structure, the intraday high volume line is at the 29.80 level, which is at the current area. Meanwhile, the Traders Dynamic Index (TDI) found a base at the lower band area and rebounded above the 50.00 line. Based on GME's hourly price structure, the ongoing bullish pressure is more likely to lift the price above the psychological 44.00 line.
On the other hand, any bearish reversal from the 36.00 to 40.00 zone might open a short opportunity, aiming for the 17.70 support level.
Based on the current multi-timeframe analysis, GameStock Stock (GME) is more likely to increase the buying pressure in the coming days. Besides finding an early long opportunity from the intraday chart, investors should be careful about excessive volatility by taking a skeptic approach.


