Published: January 19th, 2022
FTT is the native cryptocurrency token of the FTX platform that was launched on 8 May 2019. Behind this project, some largest crypto-traders found issues regarding the mainstream crypto exchanges and decided to launch an effective trading platform. FTX owners found this platform to eliminate those drawbacks and provide a centralized collateral pool and stablecoin settlement.
The collateral is limited to specific token wallets in general crypto futures exchanges. Therefore, it is often hard for traders to prevent trading positions from getting liquidated. FTX derivatives, on the other hand, provide stablecoin settlement with one universal margin wallet. Moreover, it provides a leveraged facility that will allow traders to utilize leverage without trading on margin.
Almeda Research, one of the largest crypto liquidity companies, provides the backup to FTX, which is a sign of a professional’s hand behind this project. As a result, investors can consider the FTX token as a potential investment opportunity, where only 39% of tokens are in supply. Since its inception, this token has already provided 4299.87% ROI.
Let’s see the upcoming price direction from the FTT/USDT technical analysis:

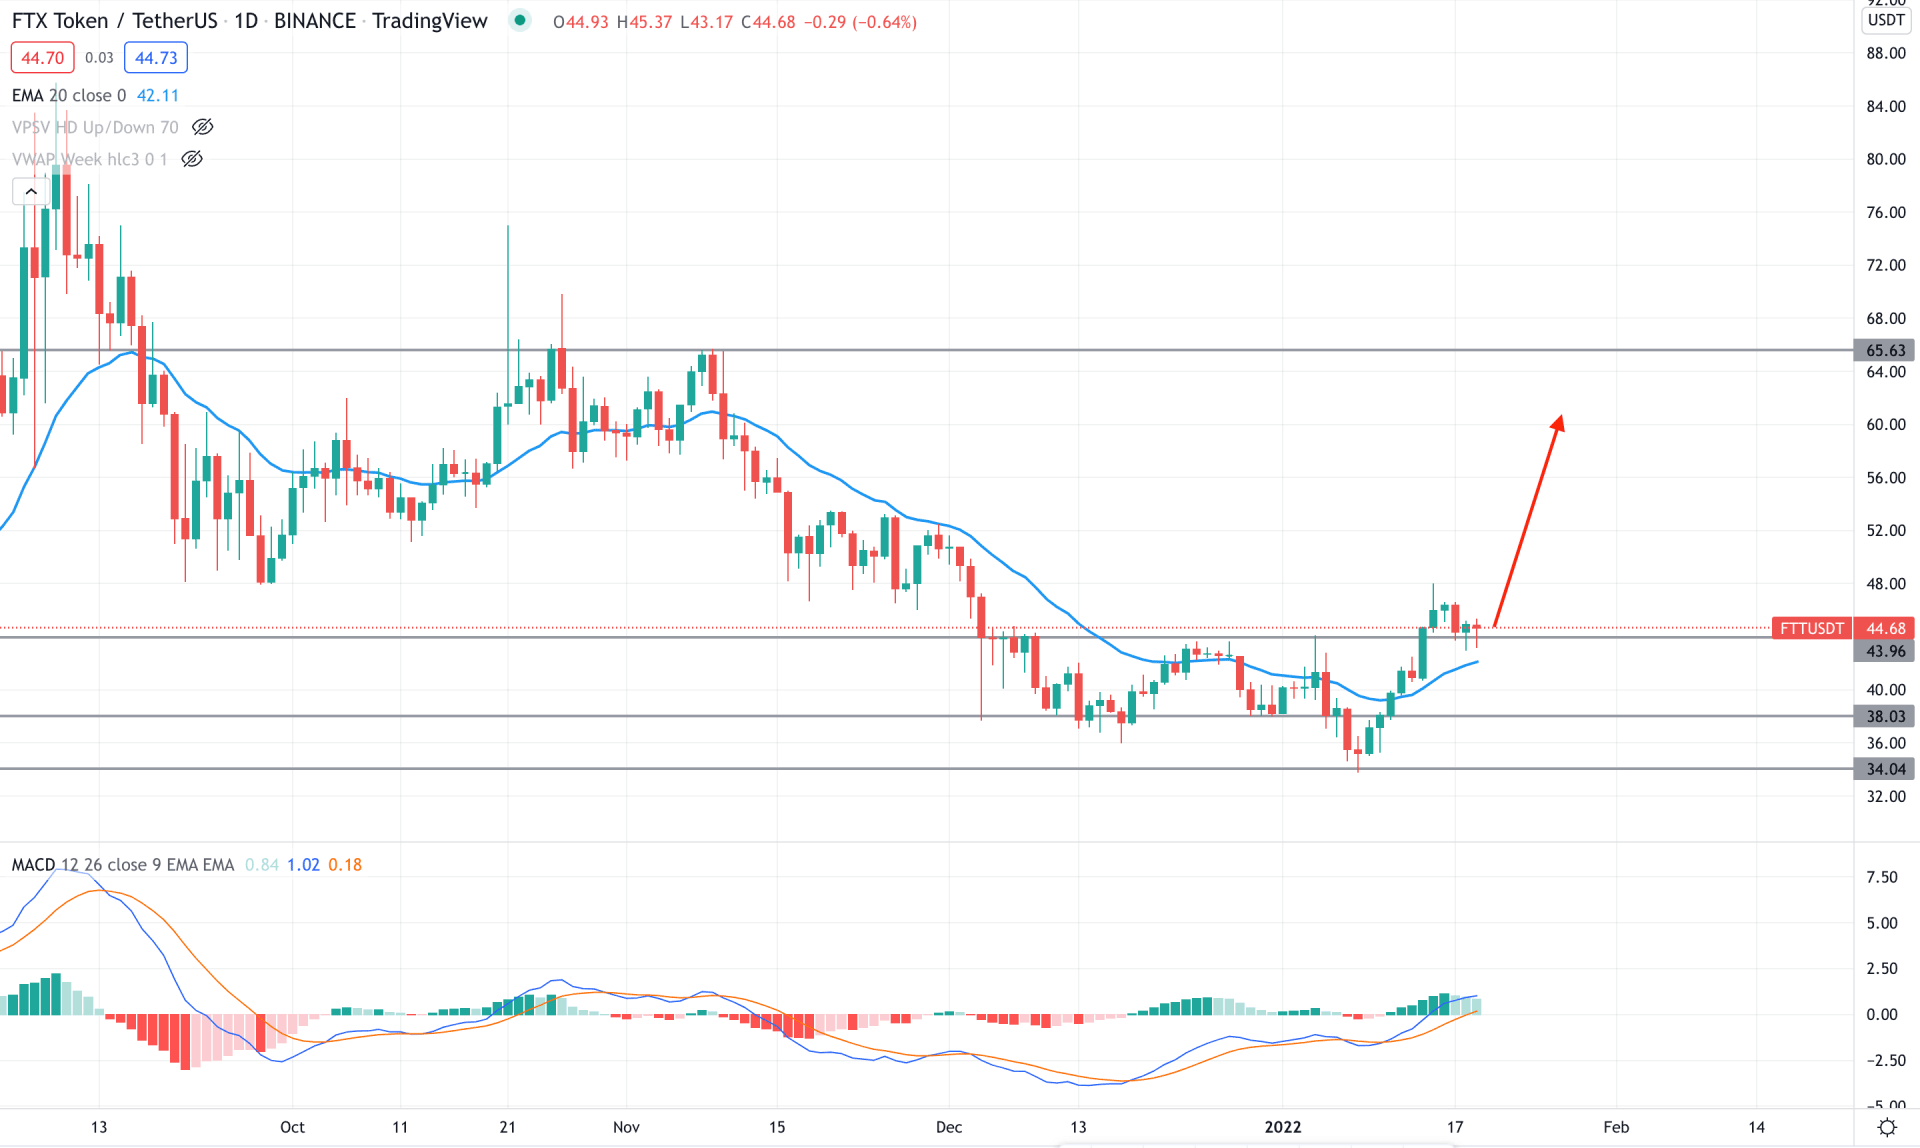
FTT/USDT is trading within a corrective momentum in the daily chart where the most recent price surged higher from the 34.00 swing low. As a result, the bulls managed to take the price above the dynamic 20 EMA with a stable position above it. Therefore, as long as the price trades above the dynamic 20 EMA, we can expect the further price direction as bullish.
The above image shows how the price breached near-term resistance levels with a structure break from the 43.96 swing high. On the other hand, the MACD Histogram is bullish and aiming more elevated, which is another reason for the bullishness in price.
Based on the current price structure, investors should wait for a new swing high above the 44.50 level or a bullish rejection from the dynamic 20 EMA. In that case, the primary target of the bullish pressure would be towards the 65.60 area. On the other hand, if the price moves below the 38.00 level with a bearish daily close, we can consider the current bullish setup is invalid. In that case, the price may come lower towards the 30.00 area.

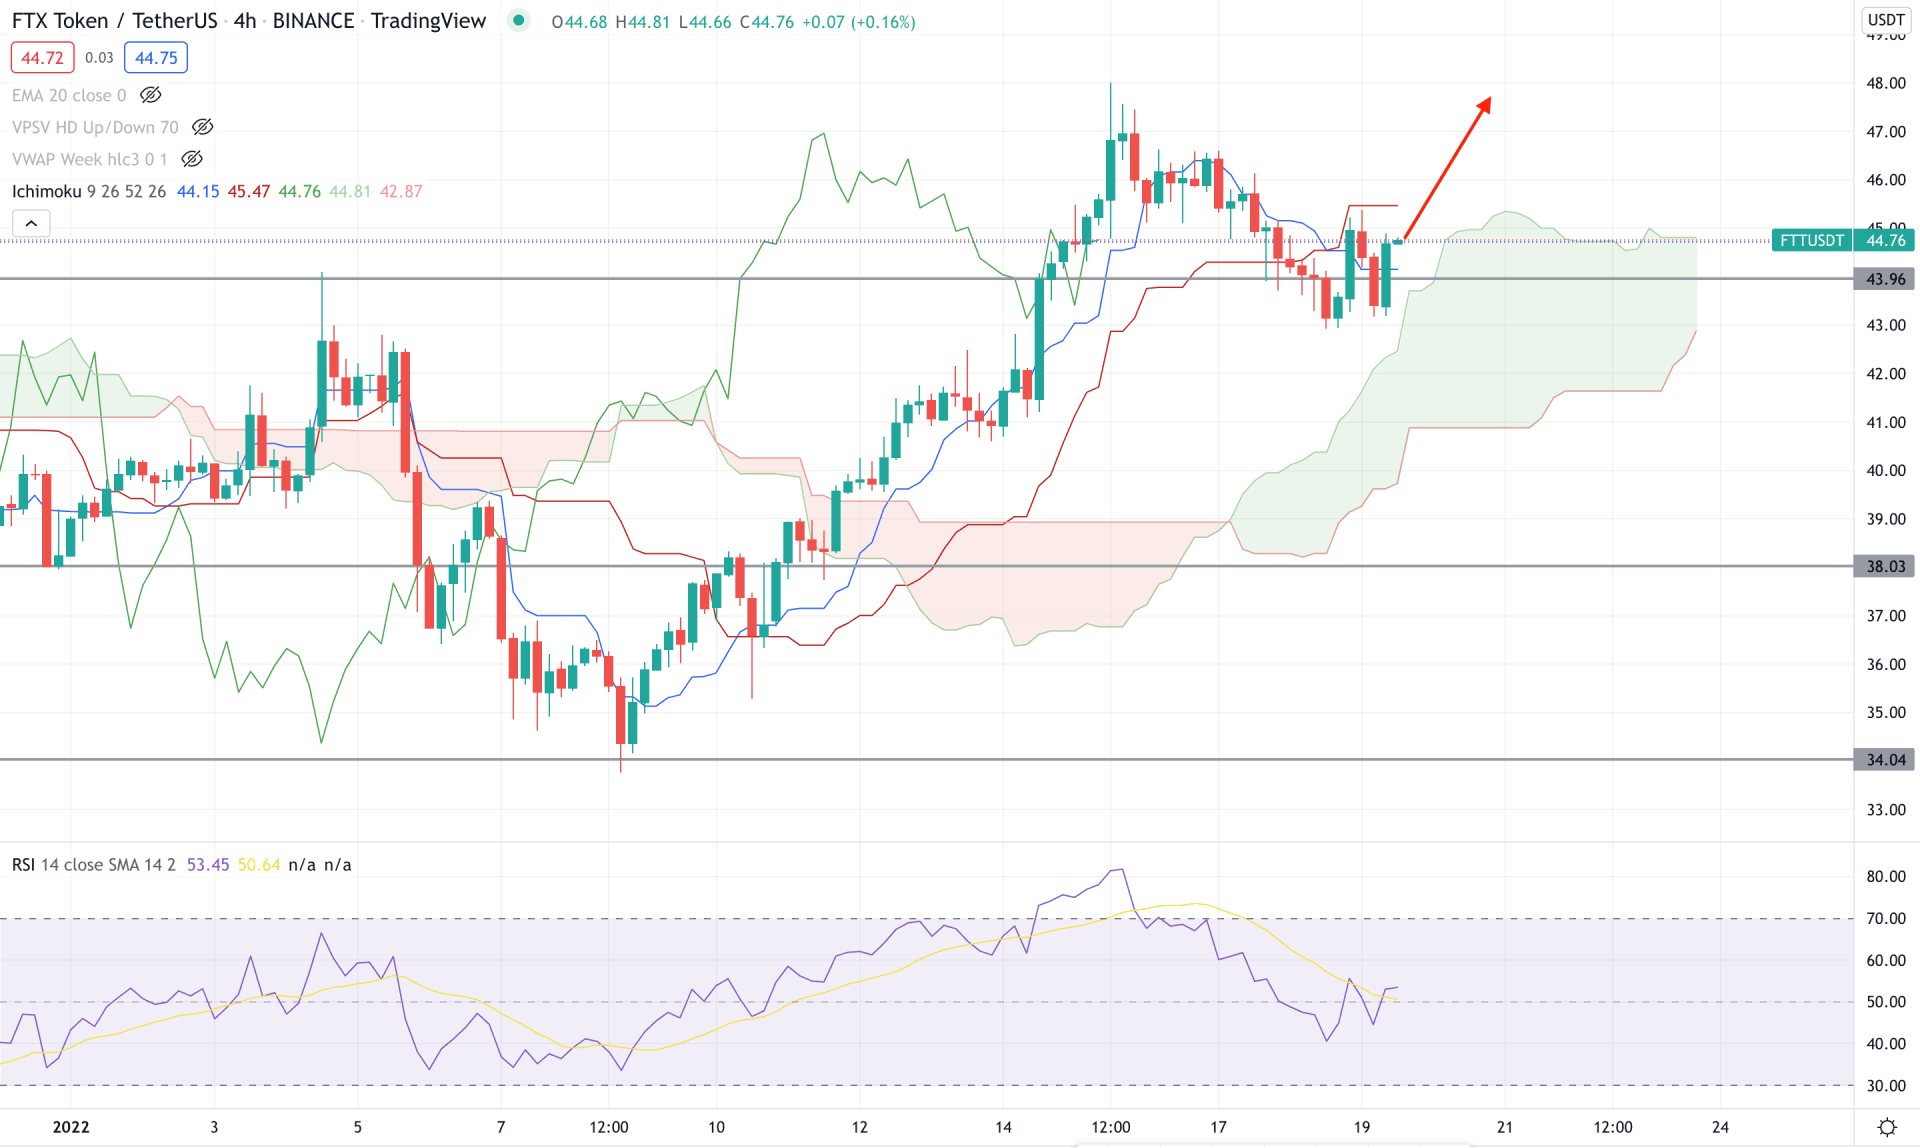
According to the Ichimoku Cloud analysis, FTT/USDT is trading within extreme buying pressure. In the future cloud, the Senkou Span A is above the Senkou Span B and both of these lines are aiming higher. Moreover, the recent price showed a bullish H4 candle above the 44.00 key support level, from where the bullish pressure may come.
In the above image, we can see the H4 chart of FTT/USDT where the RSI failed to reach the 30 level and rebounded above the 50 area. Therefore, if the RSI moves up with a bullish candle above the dynamic Kijun Sen, we can expect the bullish pressure to extend in the coming days.
Based on the H4 context, investors should wait for an H4 close above the dynamic Kijun Sen to go long with the target of 60.00 level. On the other hand, if the price moves down below the 40.00 level with a bearish H4 close below the Kumo Cloud we can expect the selling pressure to extend towards the 33.00 area.

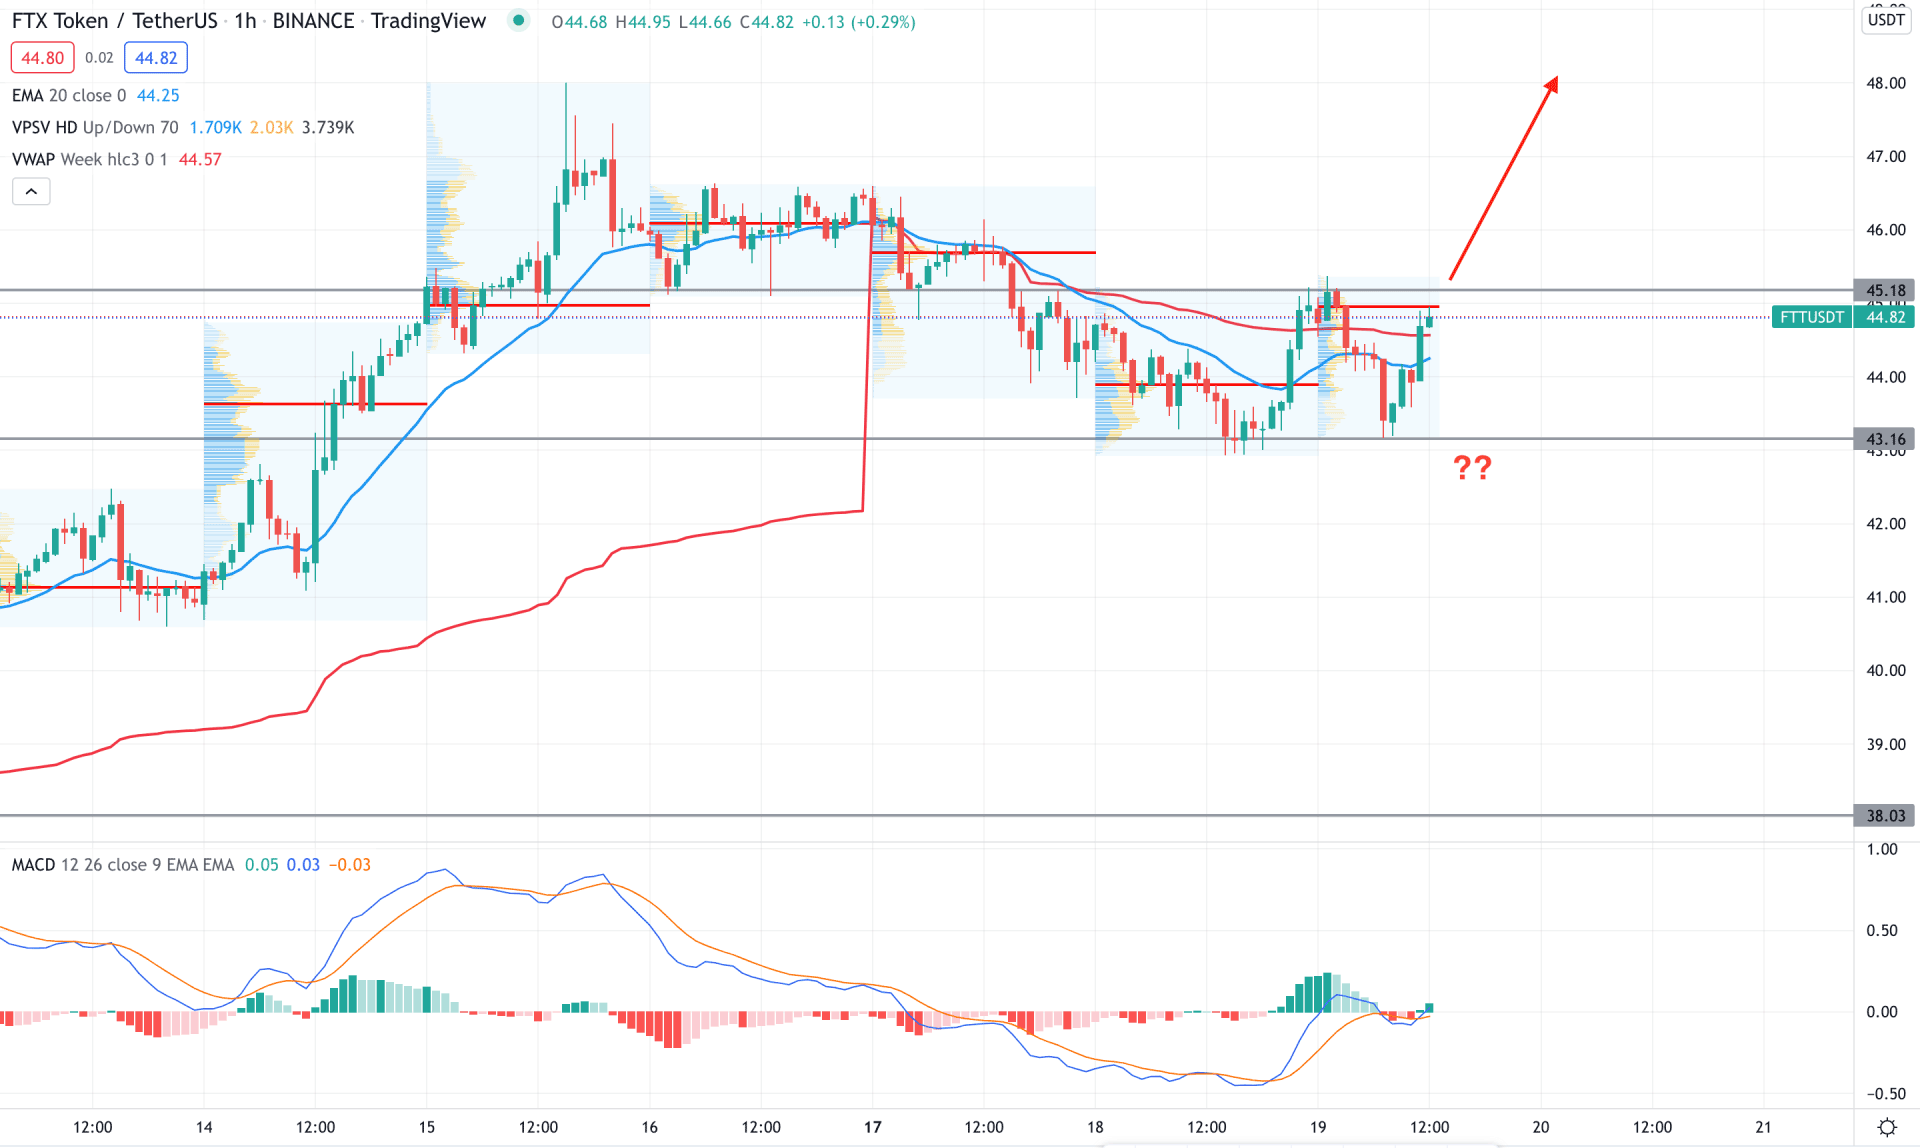
In the FTT/USDT intraday chart, the most recent price shows buying interest by moving above the dynamic 20 EMA with a strong H1 close. However, bulls should wait for the price to breach the 45.18 static level before going long in this pair.
The above image shows how the price is heading towards the intraday high volume level where a bullish breakout is important to see before anticipating bullish sentiment. Moreover, the MACD Histogram is bullish and making new highs, which is another reason for possible bullish sentiment.
Based on the H1 context, a bullish H1 close above the 45.0 level is ideal for going long in this pair while a break below the 43.00 may alter the current market structure and initiate a bearish correction towards the 40.00 area.
According to the current observation, FTT/USDT needs an intraday bullish sign before opening the buy position where a big upside pressure is expected. On the other hand, a break below the 38.00 might alter the current context with a correction towards the 30.00 area.