Published: August 13th, 2024
The FTSE 100 started the week with a positive sentiment with a 0.3% increase on Monday, capping a turbulent week that included a significant global selloff and a rebound.
India's Bharti Enterprises purchased a 24.5% stake in BT Group from Altice, causing the company's shares to increase by 7.6%.
Conversely, Marshalls' stock dropped almost 4% due to underwhelming performance, especially in its landscaping business, which sells kerb slabs and paving stones.
Despite a new £10 fee on certain routes, Heathrow Airport reported unprecedented passenger and cargo volumes throughout the summer.
Regarding monetary policy, Bank of England member Catherine Mann, a hawk, warned against getting too comfortable with the recent decline in inflation, pointing out that there are still significant foundational price pressures.
She warned that years may pass while there are ongoing wage pressures and rising costs for products and services.
Let's see the further aspect of this index from the FTSE 100 technical analysis:

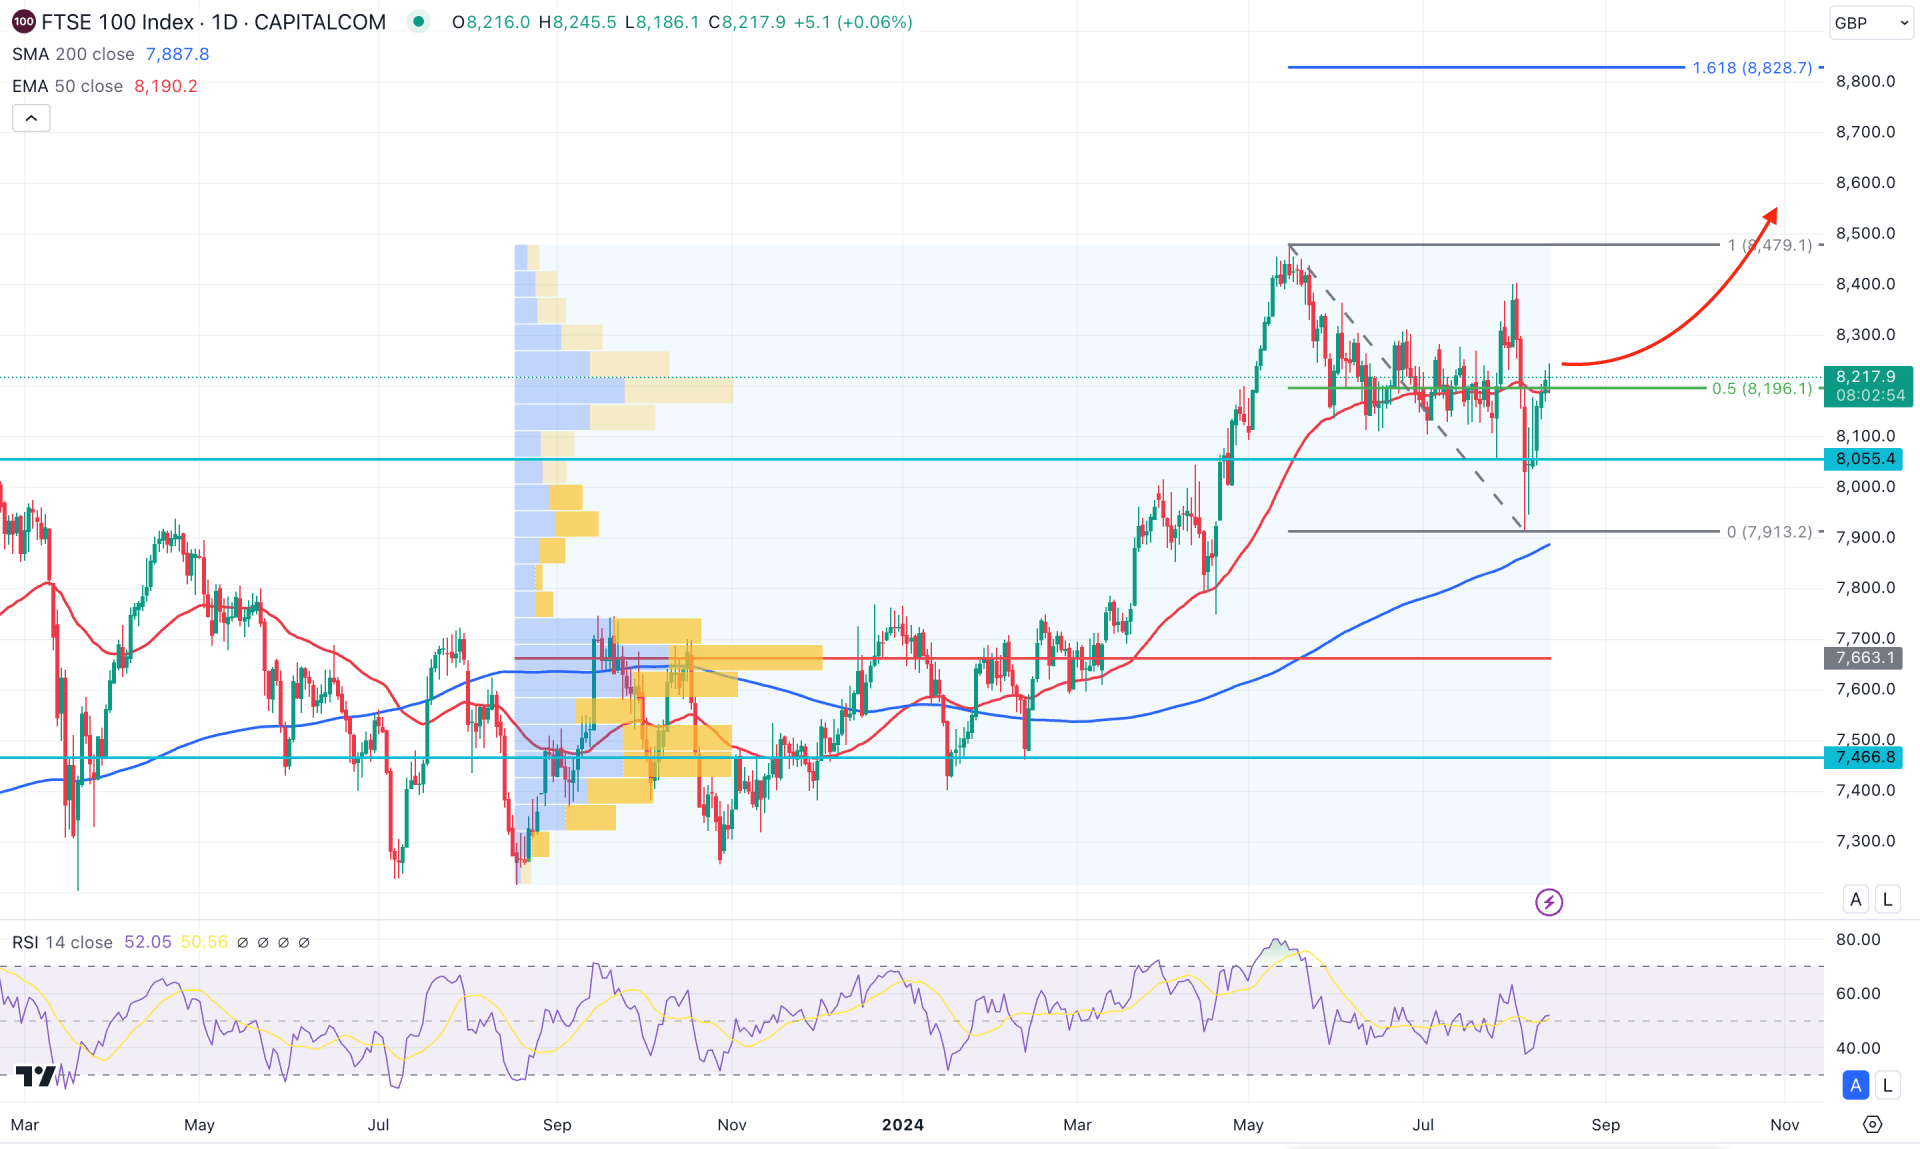
In the daily chart of UK100, an extended selling pressure is present, where the current price is trading above the 200 day Simple Moving Average.
In the higher timeframe, the ongoing buying pressure is visible as the monthly candle is trading above the July 2024 low, sweeping the sell-side liquidity. As the recent price is backed by strong buying pressure, a valid price action above the 8055.40 low could be a potential long opportunity, depending on the price action. Moreover, the recent weekly candle closed as a hammer, suggesting a confluence bullish factor.
In the daily market structure, the 200-day Simple Moving is the immediate support, while the major trend is bullish. Moreover, the 50-day EMA is also below the current price, indicating a Golden Cross continuation.
In the Fibonacci indicator, a downside correction from the 8479.10 high to the 7913.20 low provided a strong bullish possibility as the low came with a significant liquidity grab. Therefore, the above-mentioned swing low could be a lower limit of the current structure. Moreover, the high volume level since September 2023 is at 7663.10 level, which could be the extreme point on the downside.
Based on the daily market structure, a Golden Cross continuation strategy could be a potential bullish signal, where the primary aim would be to test the 161.8% Fibonacci Extension level at the 8828.70 level.
On the other hand, investors should closely monitor how the price reacts at the 8400.00 psychological line. A failure to break above this line could limit the gain and lower the price towards the 7700.00 psychological level.

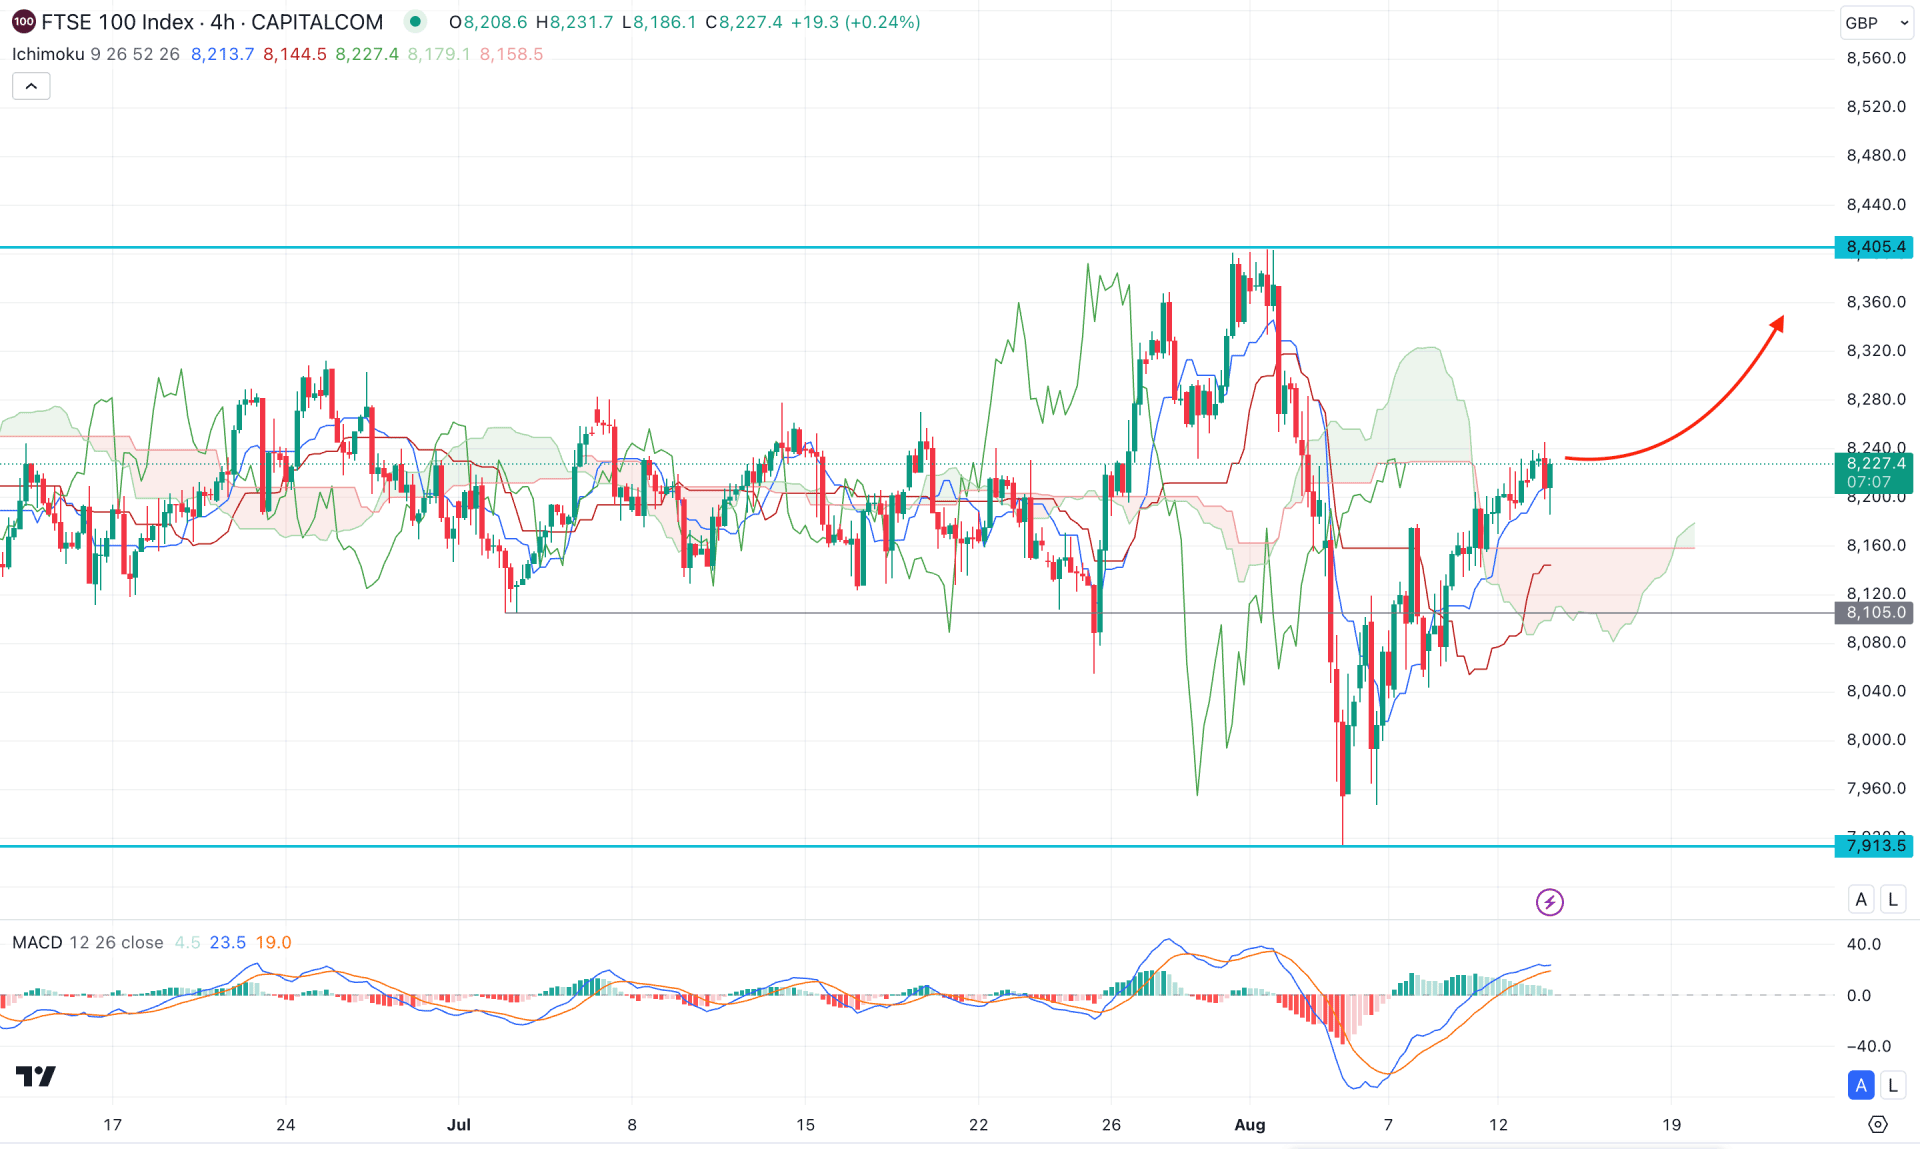
In the H4 timeframe, the recent price showed massive selling pressure below the Ichimoku Cloud zone but failed to hold the momentum. As a result, a counter-impulsive bullish pressure came with an H4 close above the cloud resistance. In that case, investors should monitor how the price trades above the cloud zone, as a consolidation could signal more upward pressure.
In the indicator window, the MACD Indicator suggests a corrective pressure as the Histogram reaches the neutral level. Also, the signal line became flat above the Histogram, suggesting a struggle for bulls.
Based on this outlook, a consolidation above the 8105.0 level could signal a bullish opportunity aiming for the 8405.40 resistance level.
On the other hand, a failure to hold the price above the cloud zone with an immediate bearish H4 candle below the 8100.00 level could resume the bearish trend below the 7900.00 level.

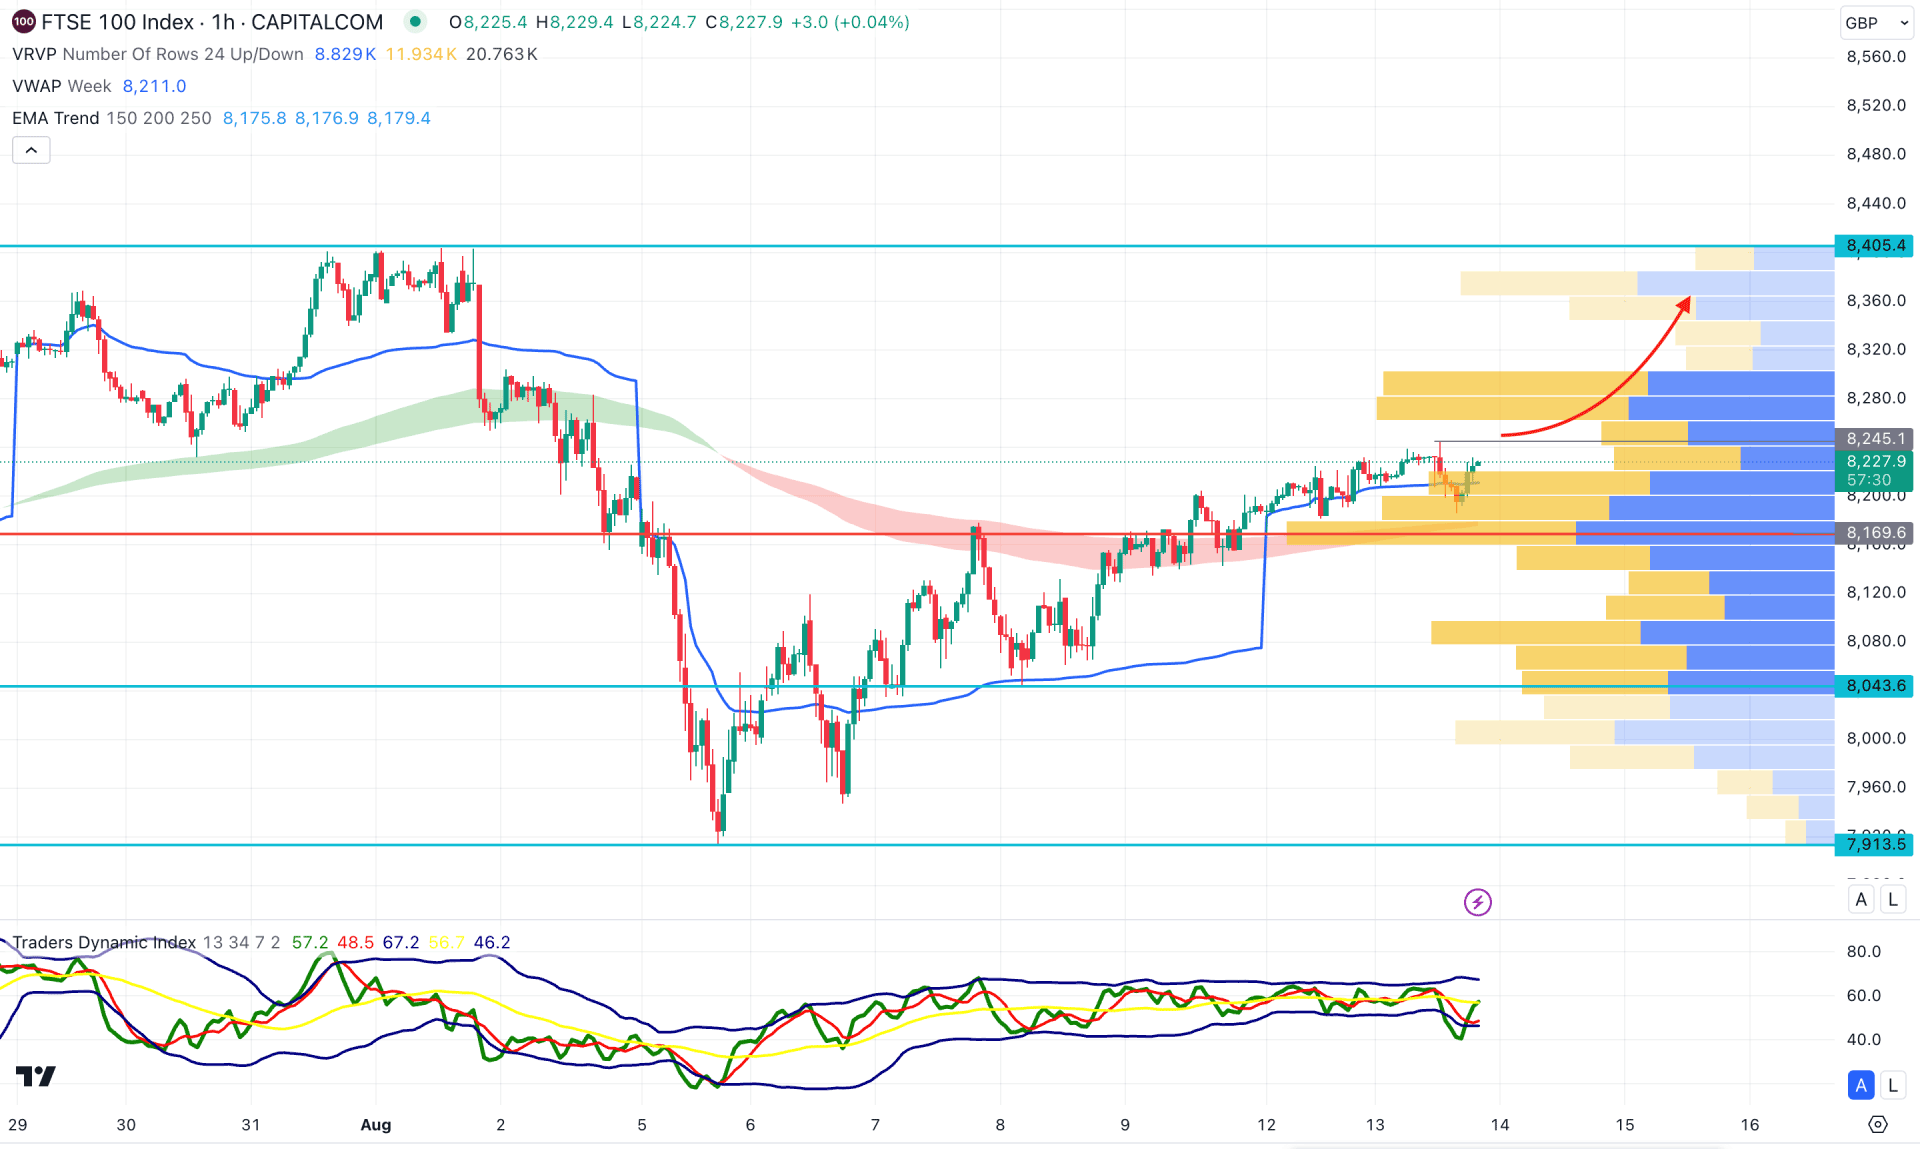
In the hourly time frame, the most recent showed a bullish V-shape recovery and closed with a bullish candle above the weekly VWAP level. Moreover, the EMA cloud with 150 to 250 MA lines is below the current price, working as a confluence bullish factor,
In the indicator window, the Traders Dynamic Index (TDI) found a bottom and rebounded above the 50.00 neutral point.
Based on the hourly structure, an extended upside pressure is possible in this index. Primarily an immediate bullish hourly candle above the 8245.10 high could be a potential long opportunity, aiming for the 8400.00 level.
On the other hand, a downside correction is possible towards the 8169.60 high volume line, but below this line, the immediate support is at the 8043.60 level.
Based on the current market pressure, the UK100 is trading within a bullish trend, where a potential trend trading opportunity is present in the intraday chart. Investors should closely monitor how the price reacts at the H1 chart, as it might signal the trend's continuation.