
Published: August 11th, 2022
Flow ecosystem is a blockchain network that can build usability improvements to its protocol layer. As a result, the world’s top developers and the largest brands started using this network, where the main aim is to experience top-tier content.
Flow blockchain has a rich ecosystem consisting of the development studio, venture-backed startups, and many startup brands. Moreover, this platform has partnerships with world-famous IP brands like NBA, Warner Music, Binance, Ubisoft, Opensea, etc.
The native token of the Flow network is FLOW, which can work as an entire borderless digital economy. This token is used as a currency for the network and applications besides using it as a reserve asset for the overall Flow economy. Everyone, including validators, users, and developers, can earn this token by participating in the Flow network.
The circulating supply of this token is 1.04B FLOW with a market cap of $3,165,256,493. In the last 24 hours, this token showed a 10% increase in trading volume to $273,604,441, while the current ROI from its inception is 2944.49%.
Let’s see the future price direction of the Flow token from the FLOW/USDT Technical Analysis:
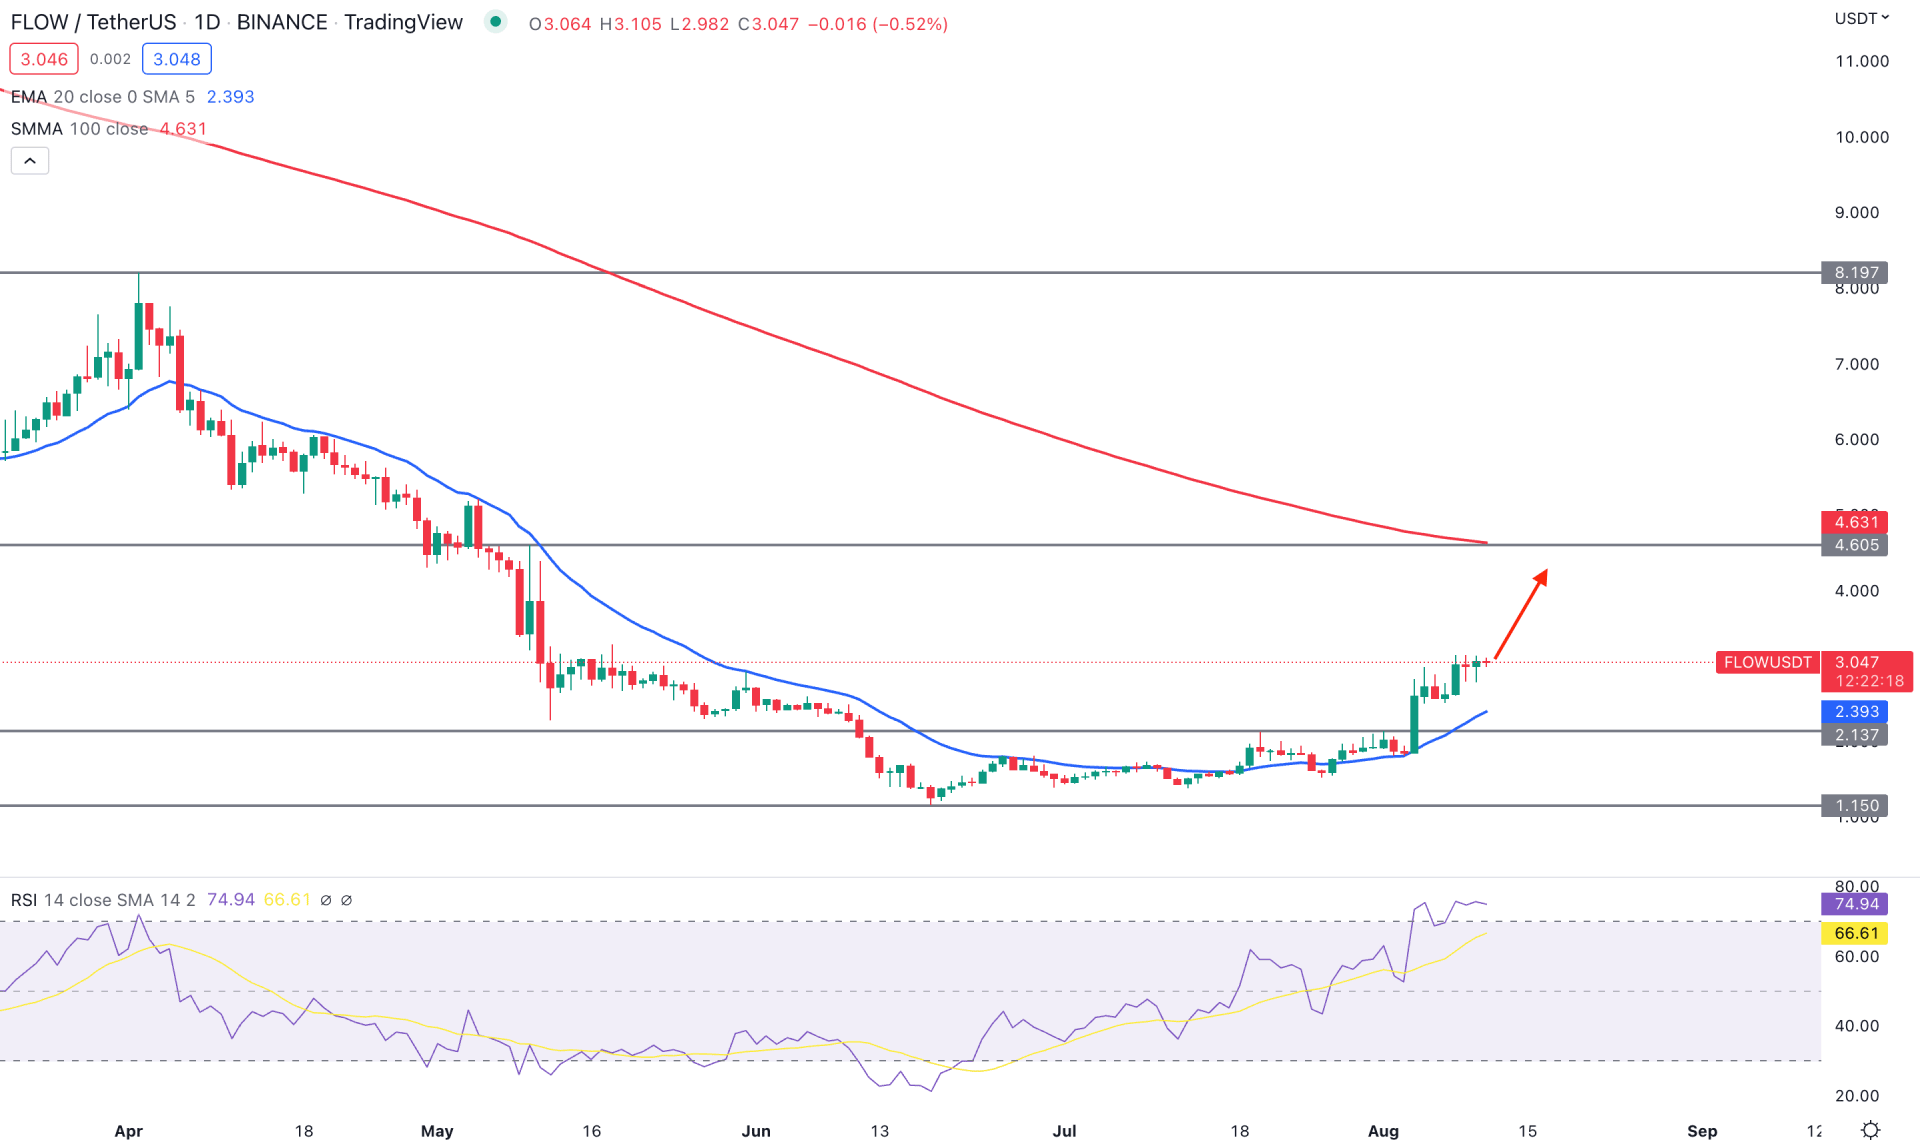
FLOW/USDT made a significant loss from the April 2022 peak, where the price lost 86% of its value from the 8.21 swing high to the 1.21 swing low. However, the price became corrective after reaching the 1.21 low, where a volatile market momentum was seen. The buying pressure was extended once the price increased from the 2.13 to 1.15 zone with a massive bullish daily close from the dynamic 20-day EMA support. The price made multiple inside bars after the bullish daily candle with no sign of a recovery. In that case, the strong buying position above the 20-day Exponential Moving Average could extend the momentum toward the 4.60 resistance level.
The strong buying pressure is visible from the Relative Strength Index, where the current RSI is above the 70% zone. The price action in the last six trading days failed to show sellers' activity, ignoring the overbought RSI. The dynamic 20 EMA also started moving higher, which can work as an immediate support level.
Based on the daily price action of FLOW, investors may expect the price to extend higher towards the 4.60 key resistance level in the coming days. The buying pressure is valid as long as it trades above the 20-day EMA level. On the other hand, the alternative trading approach is to see the price below the 2.00 psychological level, before considering it a sell.
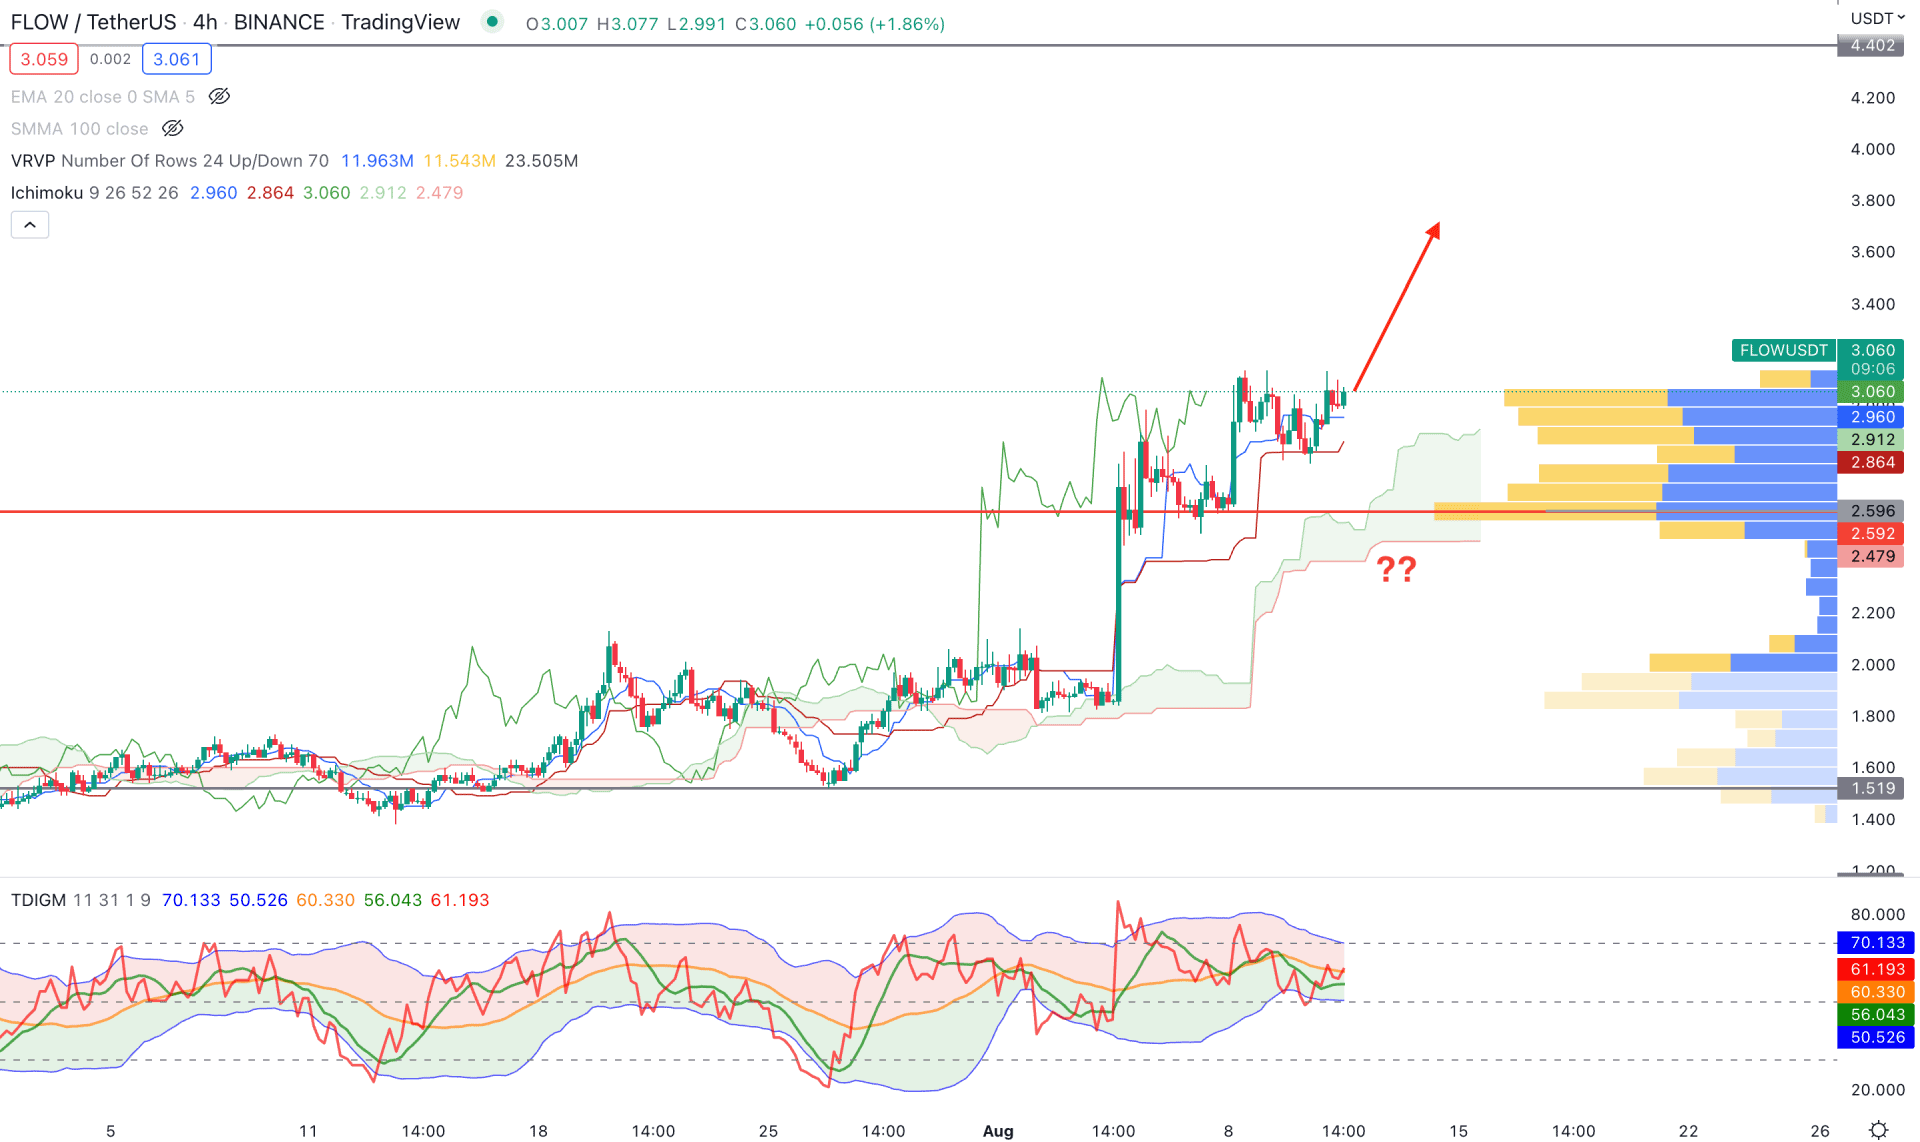
In the H4 chart, FLOW/USDT price shows a strong buying pressure that can extend the bullish momentum in the coming days. The primary sign of the bullish momentum came from a strong bullish H4 candle from the Ichimoku Kumo Cloud that closed with a 43% price change. Later on, the price extended the buying pressure and made a new swing high at the 3.00 key resistance level.
The strong buying pressure came with massive volume support from the 2.59 level, as shown in the visible range trading volume indicator. Moreover, the gap between Senkou Span A and Senkou Span B is widening, indicating possible buying pressure in the coming days.
Although the price is holding bullish momentum, the Traders Dynamic Index shows more upside possibilities as the TDI line holds a strong position above the 50% level. In that case, the buying pressure may extend in the coming days, where the main aim is to test the 4.40 key resistance level. However, breaking below the 2.40 level could eliminate the current scenario with a bearish pressure towards the 1.51 area.
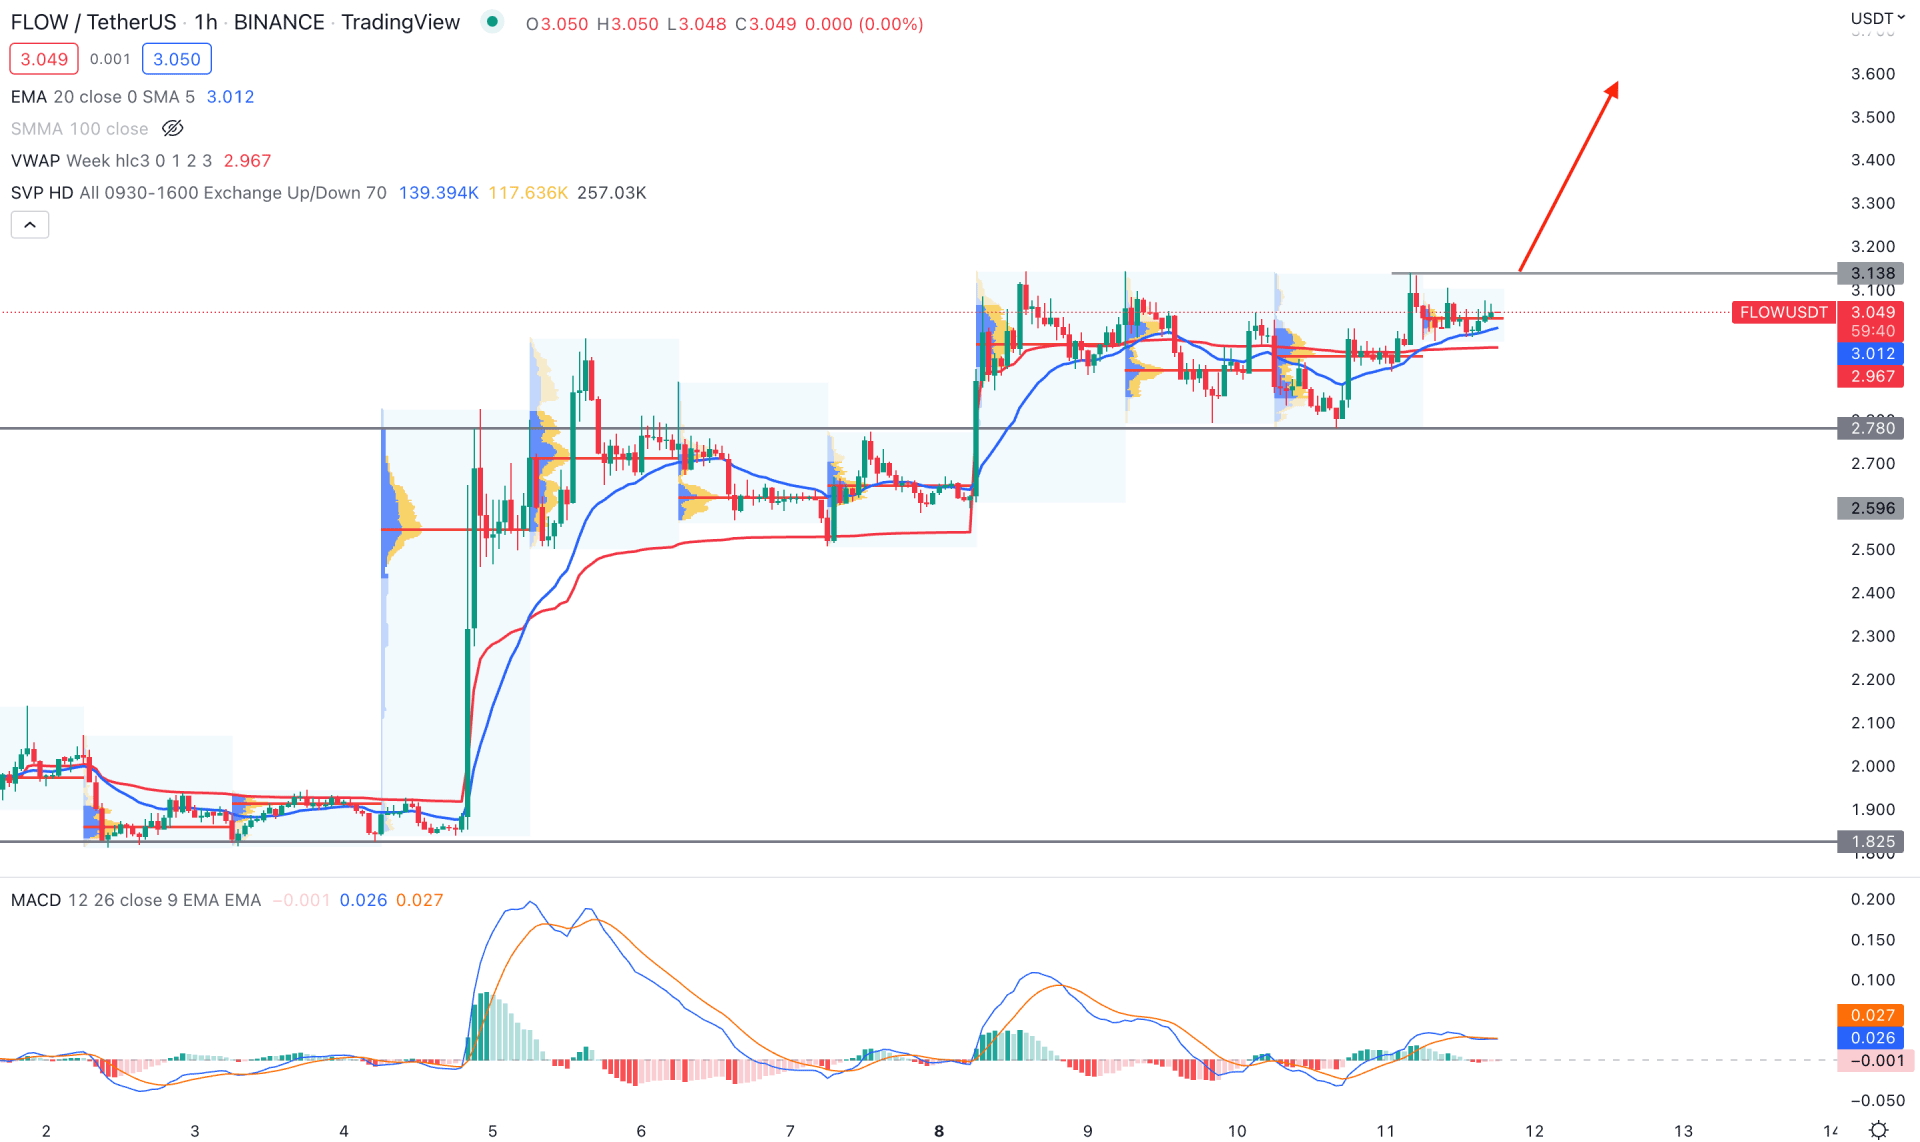
In the intraday chart, FLOW/USDT shows buying pressure as the price trades above the dynamic 20 EMA and weekly VWAP. The latest intraday high volume level is below the price, indicating that short-term bulls and scalpers support the current buying pressure.
The indicator window shows a neutral momentum on the MACD Histogram, where a bullish H1 candle above the 3.13 swing high with a positive Histogram could open a bullish possibility. In that case, the main aim is to test the 3.60 price level in the coming hours. On the other hand, the alternative approach is to wait for the price, breaking below the 2.78 level from where more selling pressure may come.
Based on the current multi-timeframe analysis, FLOW/USDT will likely move higher in the coming days, supported by daily and intraday price behavior. However, investors should monitor how the price trades at the intraday H4 Kijun Sen level to find a reliable trading position.


