
Published: November 29th, 2023
FLOW/USDT passed a devastating year in 2022 but eliminated the downside possibility with a consolidation formation in 2023. The early sign of buyers’ accumulation is present in the higher timeframe, where the latest monthly price suggests a remarkable 30% gain.
Flow is a cutting-edge blockchain for decentralized applications (dApps), digital assets, and high-performance applications (games). The principal aim of this initiative is to address the widespread scalability issues in numerous current blockchains. It proposes a platform that combines efficiency and usability with a strong emphasis on security.
The Flow architecture has been carefully designed to attain scalability while preventing the need for sharding. Adopting this blockchain guarantees data consistency, streamlines the system's complexities, and improves overall performance.
Flow originated from the inventive faculties at Dapper Labs, also the esteemed CryptoKitties' progenitors. Its inception was prompted by the scalability concerns brought to light during the CryptoKitties' height on the Ethereum network. The architecture of this platform is designed to support extensive applications while maintaining decentralization under alternative blockchain technologies.
Flow's notable architectural features and progressive outlook establish it as a substantial growth possibility for the native token FLOW. However, a reliable price direction might come after combining the growth possibility from the price chart.
Let’s see the upcoming price direction of this instrument from the FLOW/USDT technical analysis:
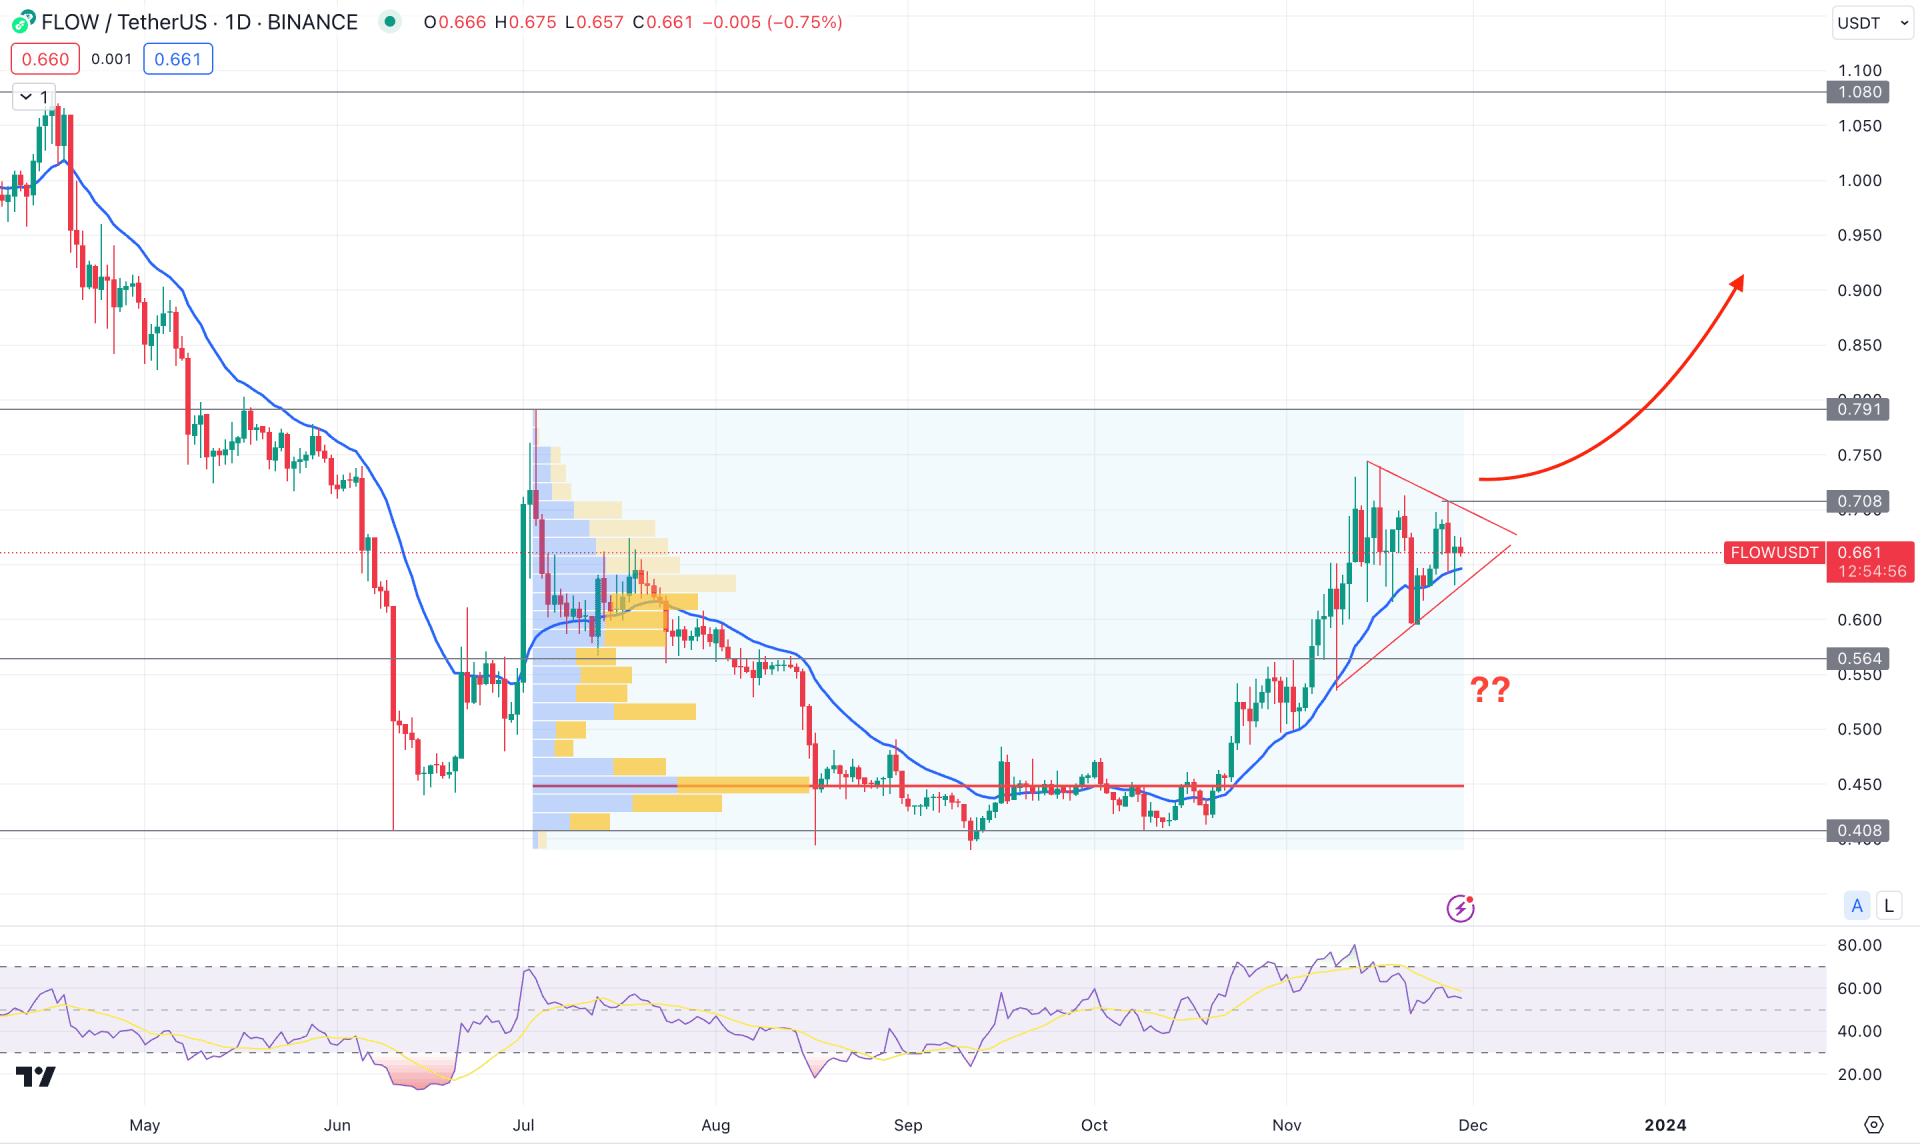
In the FLOW/USDT daily chart, the recent price showed a recent bullish recovery before moving sideways within the symmetrical triangle formation. As the current price stalls above the dynamic 20 EMA, a bullish pennant breakout could be a strong bullish factor for this token.
In the higher timeframe, the November close appears, where the price is more likely to hold the current 30% monthly gain. Moreover, the crypto winter with the holiday session appears, which could work as a confluence bullish factor for this coin. Moreover, the weekly price suggests a trend continuation as the last two candle stalls within the earlier long bullish body. In that case, a new swing high formation with a valid weekly close could be a strong, long opportunity for this coin.
In the volume structure, the highest activity level since the July 2023 peak is at 0.448 level, which is at the previous consolidation zone. It is a sign that the buying pressure is solid at the bottom, indicating buyers’ accumulation. In that case, the buying pressure is solid as long as the price trades above the existing high volume level.
Moreover, the dynamic 20 EMA works as a dynamic support, while the Relative Strength Index (RSI) hovers above the 50.00 line. In that case, a bullish reversal from the dynamic 20 EMA support is possible but the current position of RSI indicates a corrective momentum.
Based on the daily market outlook of FLOW/USDT, a bullish pennant breakout with a daily close above the 0.708 level could validate the long opportunity, targeting the 1.000 mark.
On the other hand, downside pressure with a stable price below the dynamic 20 EMA could indicate a short opportunity, targeting the 0.500 psychological level.
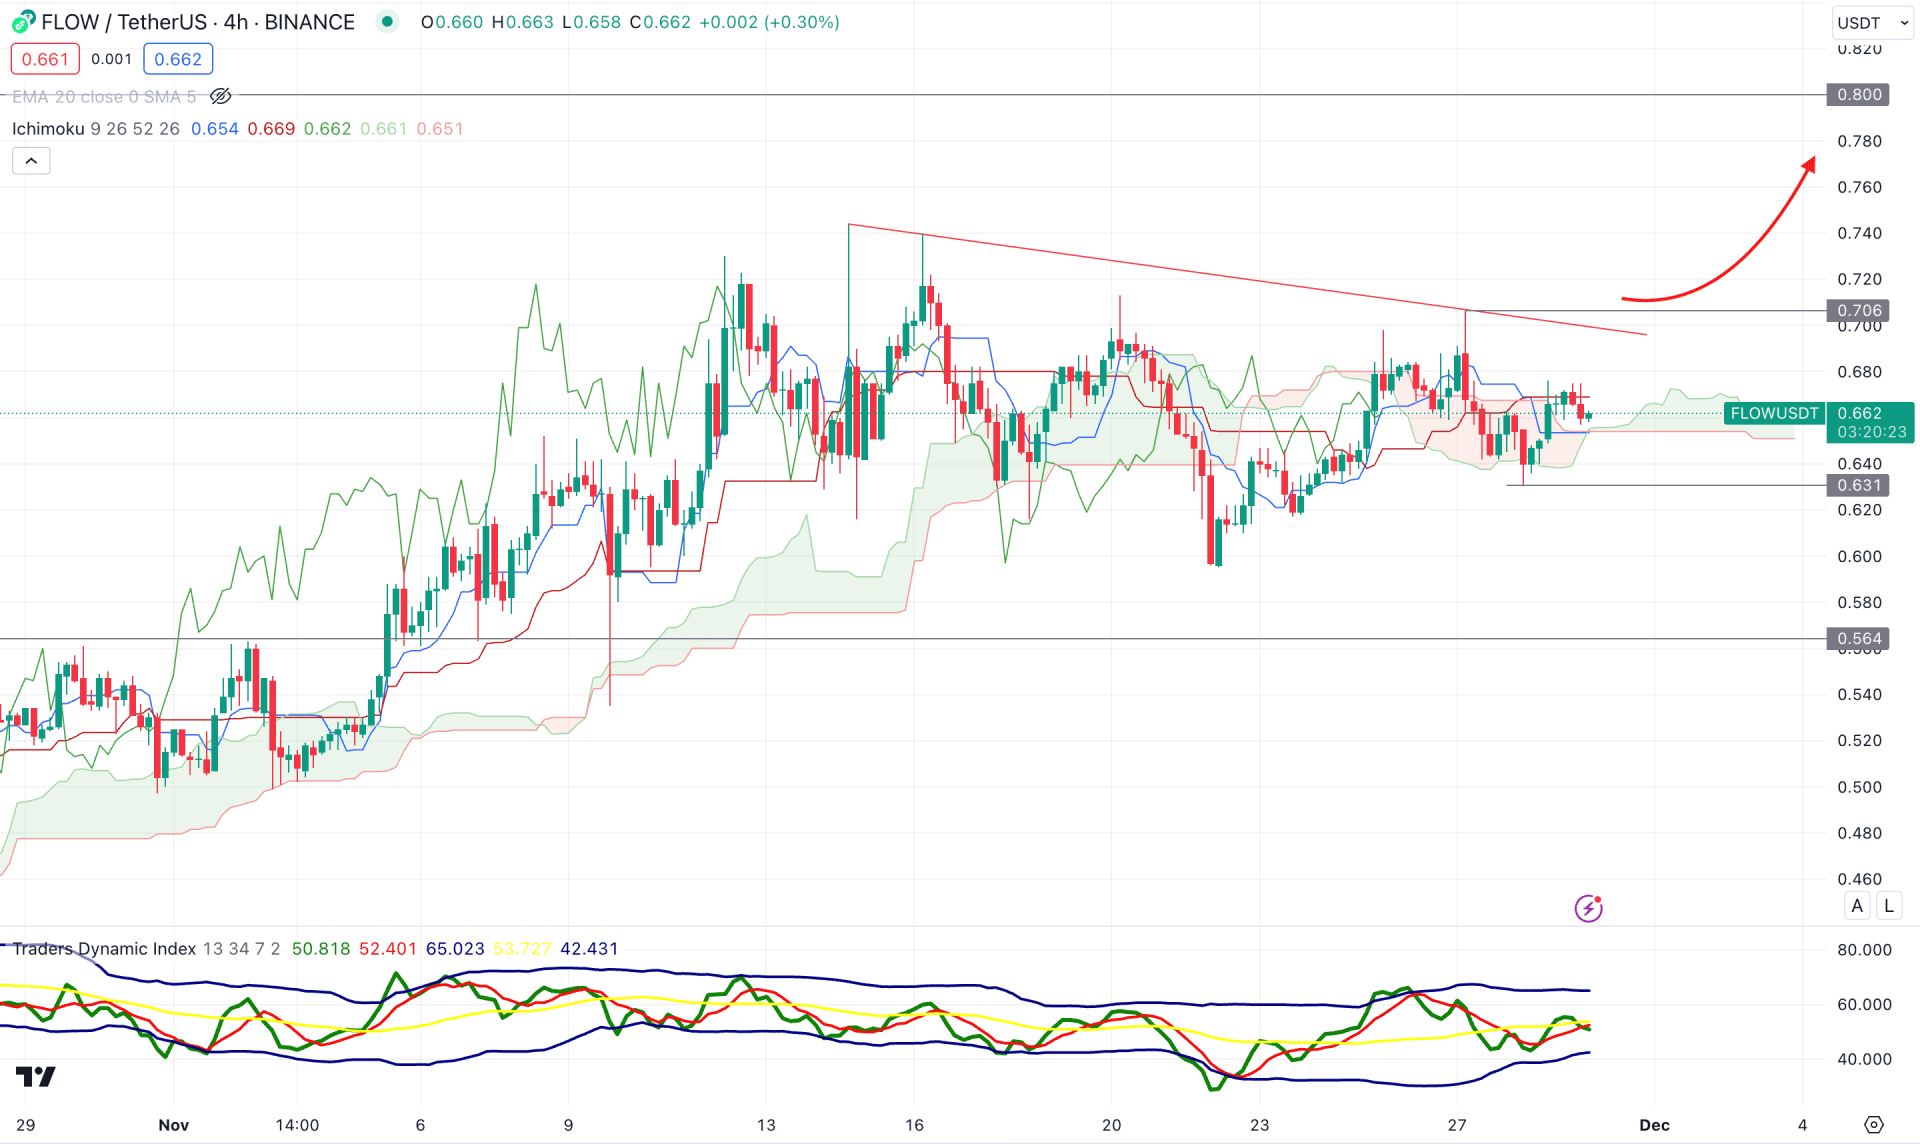
In the H4 chart, the current price consolidates at the Ichimoku Kumo Cloud zone, which indicates an indecisive momentum. Moreover, the future cloud suggests a bullish possibility as the Senkou Span A is above the Senkou Span B with an upward slope.
In the secondary window, the current Traders Dynamic Index (TDI) suggests a corrective momentum as it remains at the 50.00 neutral level. Moreover, the dynamic Tenkan Sen and Kijun Sen are closer together, which supports the existing correction.
Based on this structure, a bullish continuation with an H4 close above the previous trendline resistance could indicate a strong trend continuation opportunity. Moreover, the 0.706 level would be the near-term resistance, where a bullish break could work as a confluence-long signal.
On the bearish side, investors should monitor how the price reacts after moving below the Ichimoku Cloud level. In that case, a candle close below the 0.6300 level could be a short opportunity.
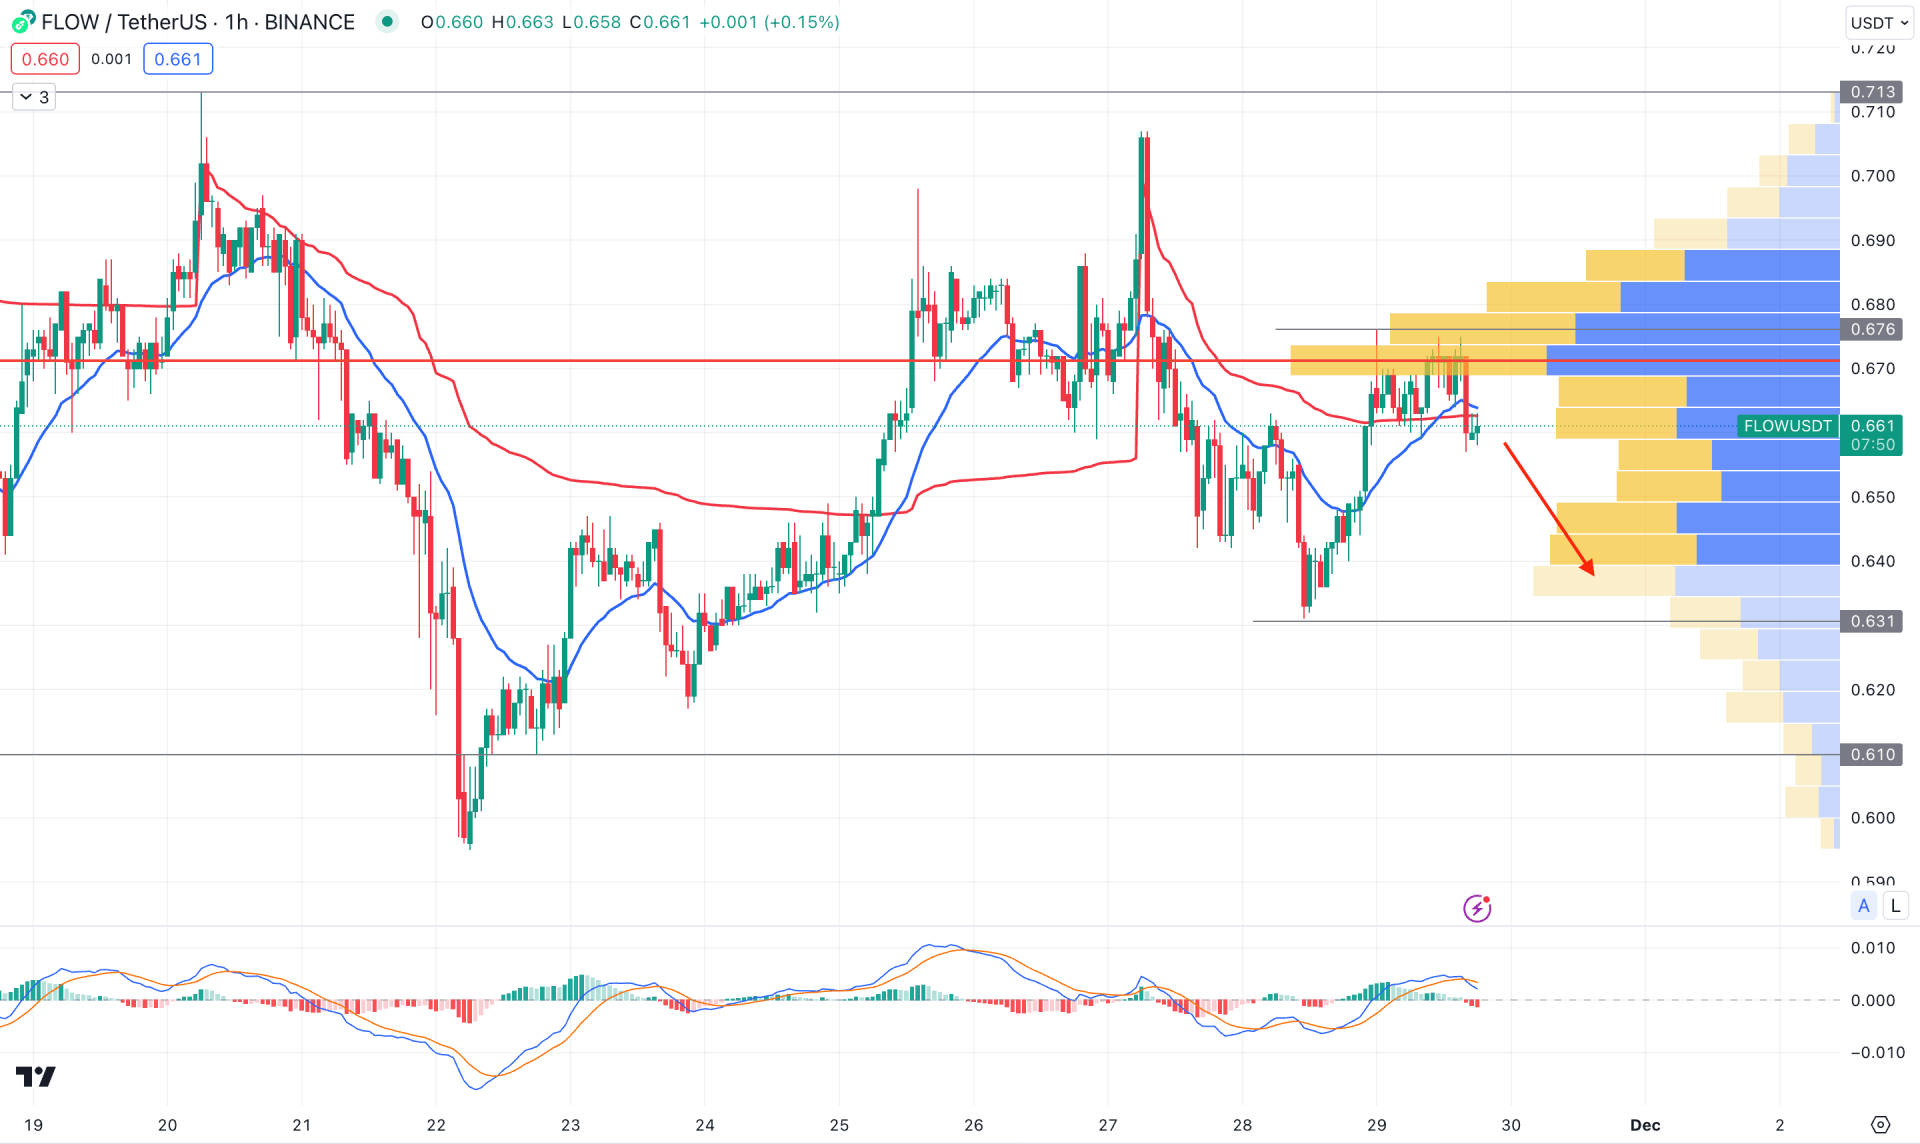
In the H1 chart, downside pressure is visible as the visible range high volume level is above the current price. Moreover, a bearish H1 candle is visible below the dynamic VWAP level, which indicates an additional downside signal.
In the secondary window, the MACD Histogram moved below the neutral zone, while the signal line formed a bearish crossover.
Based on this intraday structure, a bearish trend continuation is potent for the FLOW/USDT price, where the current aim is to test the 0.631 support level. On the other hand, a valid bullish pressure above the visible range high volume level is needed before anticipating a long movement. In that case, an H1 close above the 0.676 static level could be a long opportunity, targeting the 0.713 resistance.
Based on the daily market outlook, a bullish pennant breakout could be the first sign of a trend continuation. However, the earlier long opportunity might come with a valid bullish rejection from the H1 breakout.


