
Published: October 1st, 2025
The launch of FXRP by Flare Network is a significant event for FLR holders. They can now participate in DeFi operations on Flare's mainnet. The usage of XRP as liquidity and collateral has economic ramifications, with further repercussions expected in the DeFi and cryptocurrency trading industries.
Increased DeFi engagement results from the move's resonance with historical precursors like wBTC on Ethereum. Prospects for the future include further DeFi usage for XRP and wider token integration. Technology and market growth are suggested by insights, which point to strong growth prospects.
Moreover, the Flare Audit report said that it has a 91.0 economic score and an 85.2 social score, indicating both financial stability and great community traction. Although there is still opportunity for improvement in fundamentals (64.7) and in security (64.9), the project's argument is being strengthened by recent advancements in ecosystem acceptance.
Let's see the further outcome from the FLR/USDT market analysis:
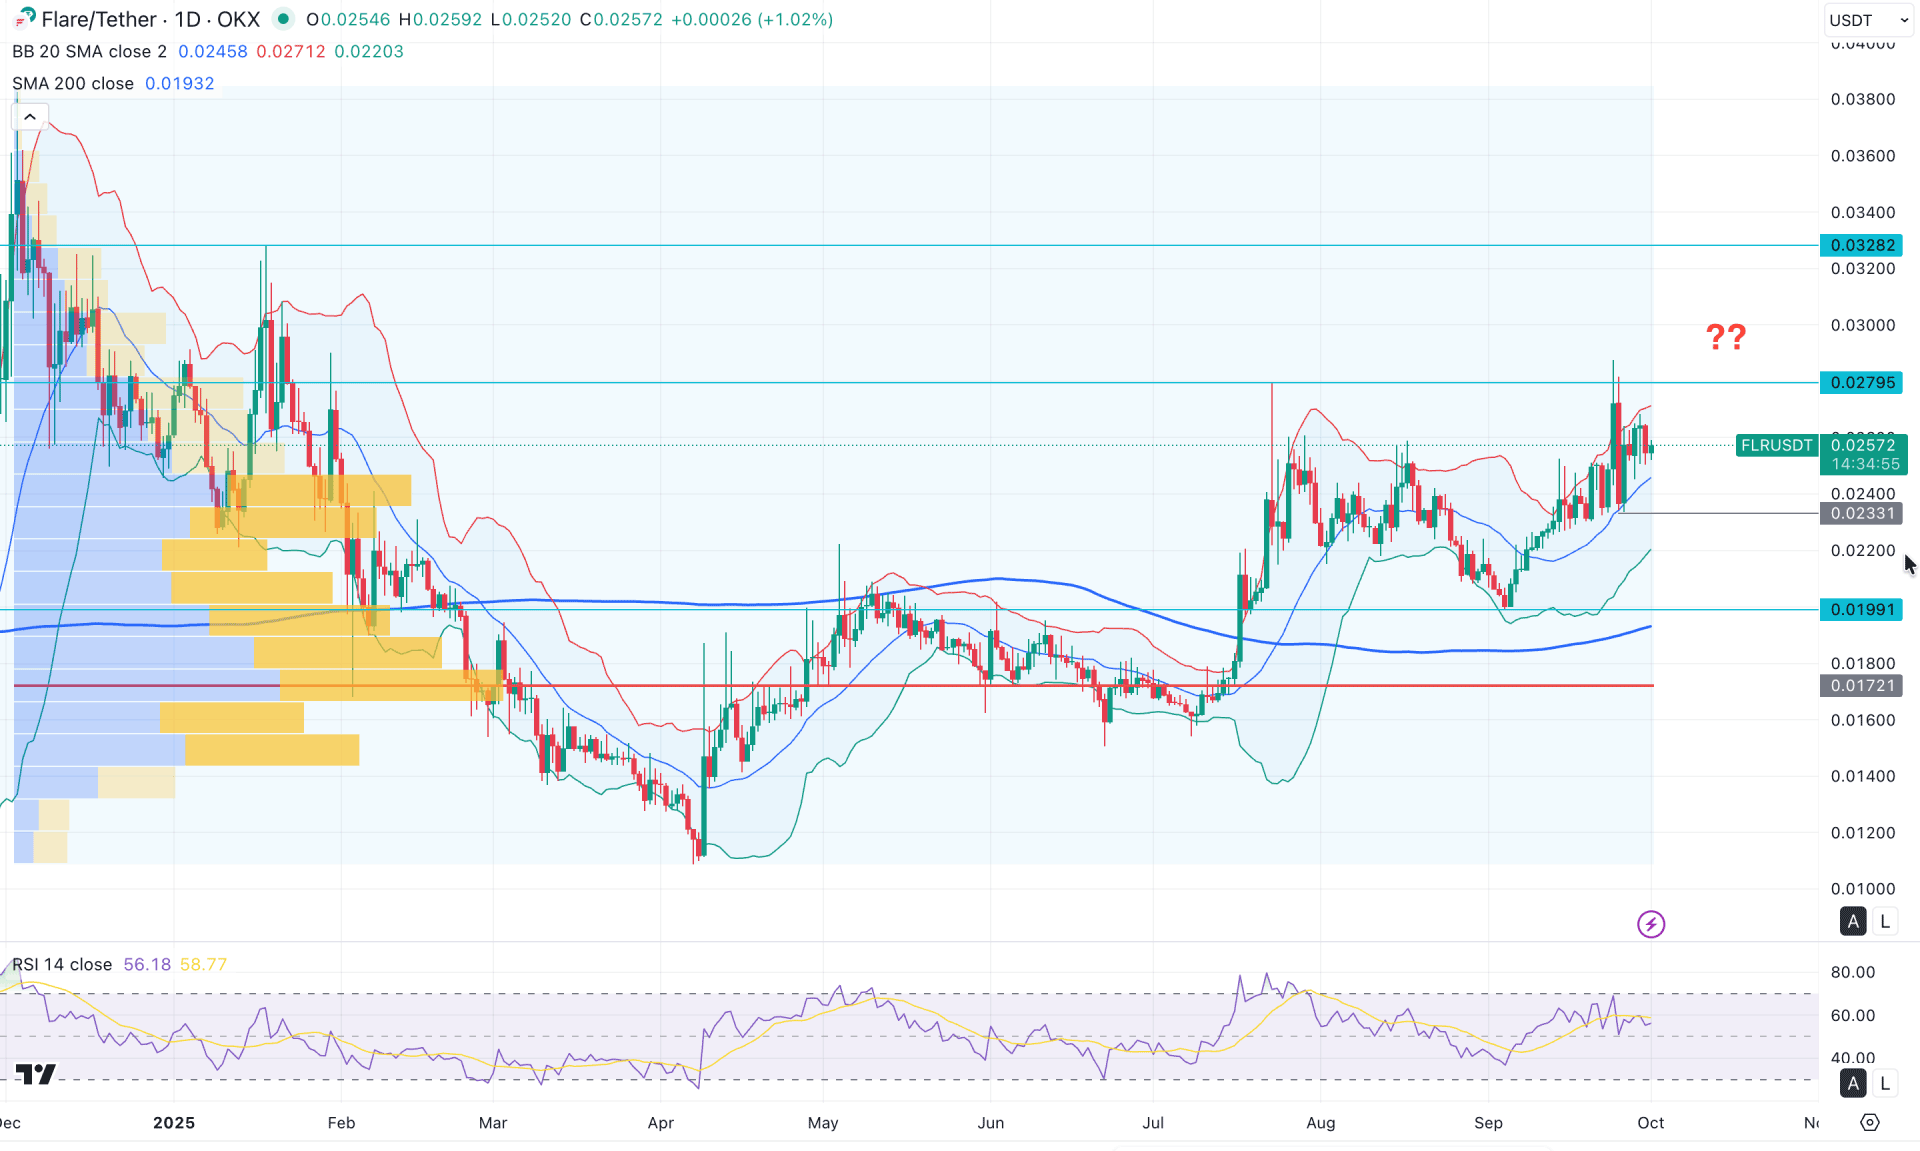
In the daily chart of FLR/USDT, a bullish continuation is observed following a solid bottom formation in April 2025. As a result, the price has continued moving higher, creating new swing highs. The most recent price action shows volatility around the existing high of 0.0279. This extended bullish move requires special attention from investors before anticipating further upside momentum.
In the monthly timeframe, the price is trading within a symmetrical triangle pattern, where a bullish breakout above the September 2025 high could trigger a long-term rally. As the price remains within a bullish inside bar breakout structure, the probability of continuation is high.
From a volume perspective, bullish momentum appears solid since the largest activity level from December 2024 lies well below the current price. Furthermore, as no significant high-volume area exists above the 0.0279 resistance, investors may face less selling pressure during a potential bullish breakout.
The main price chart presents a clear picture of market activity, showing multiple interactions above the mid Bollinger Band level. Initially, the price moved significantly higher beyond the Upper Bollinger Band but failed to maintain momentum. However, later bullish pressure weakened as the price failed to sustain above the mid Bollinger Band. As long as the price trades between the mid and upper Bollinger Band zones, we may expect a range breakout before identifying a trend-trading opportunity.
In the indicator window, the Relative Strength Index (RSI) has reached its peak, showing a mild recovery from the 70.00 overbought level. However, the RSI remains above the 50.00 neutral mark, signaling a corrective but still bullish market sentiment.
Based on the overall market structure, an extended correction is still possible since the 200-day SMA lies far below the lower Bollinger Band. A bullish rebound from the Bollinger Band line and a sustained price move above the 0.0240 level could offer a pre-breakout buying opportunity, targeting 0.0400.
Alternatively, a bearish break below the 0.0233 level, followed by consolidation, could open the path for a retest of the 0.0172 support zone.
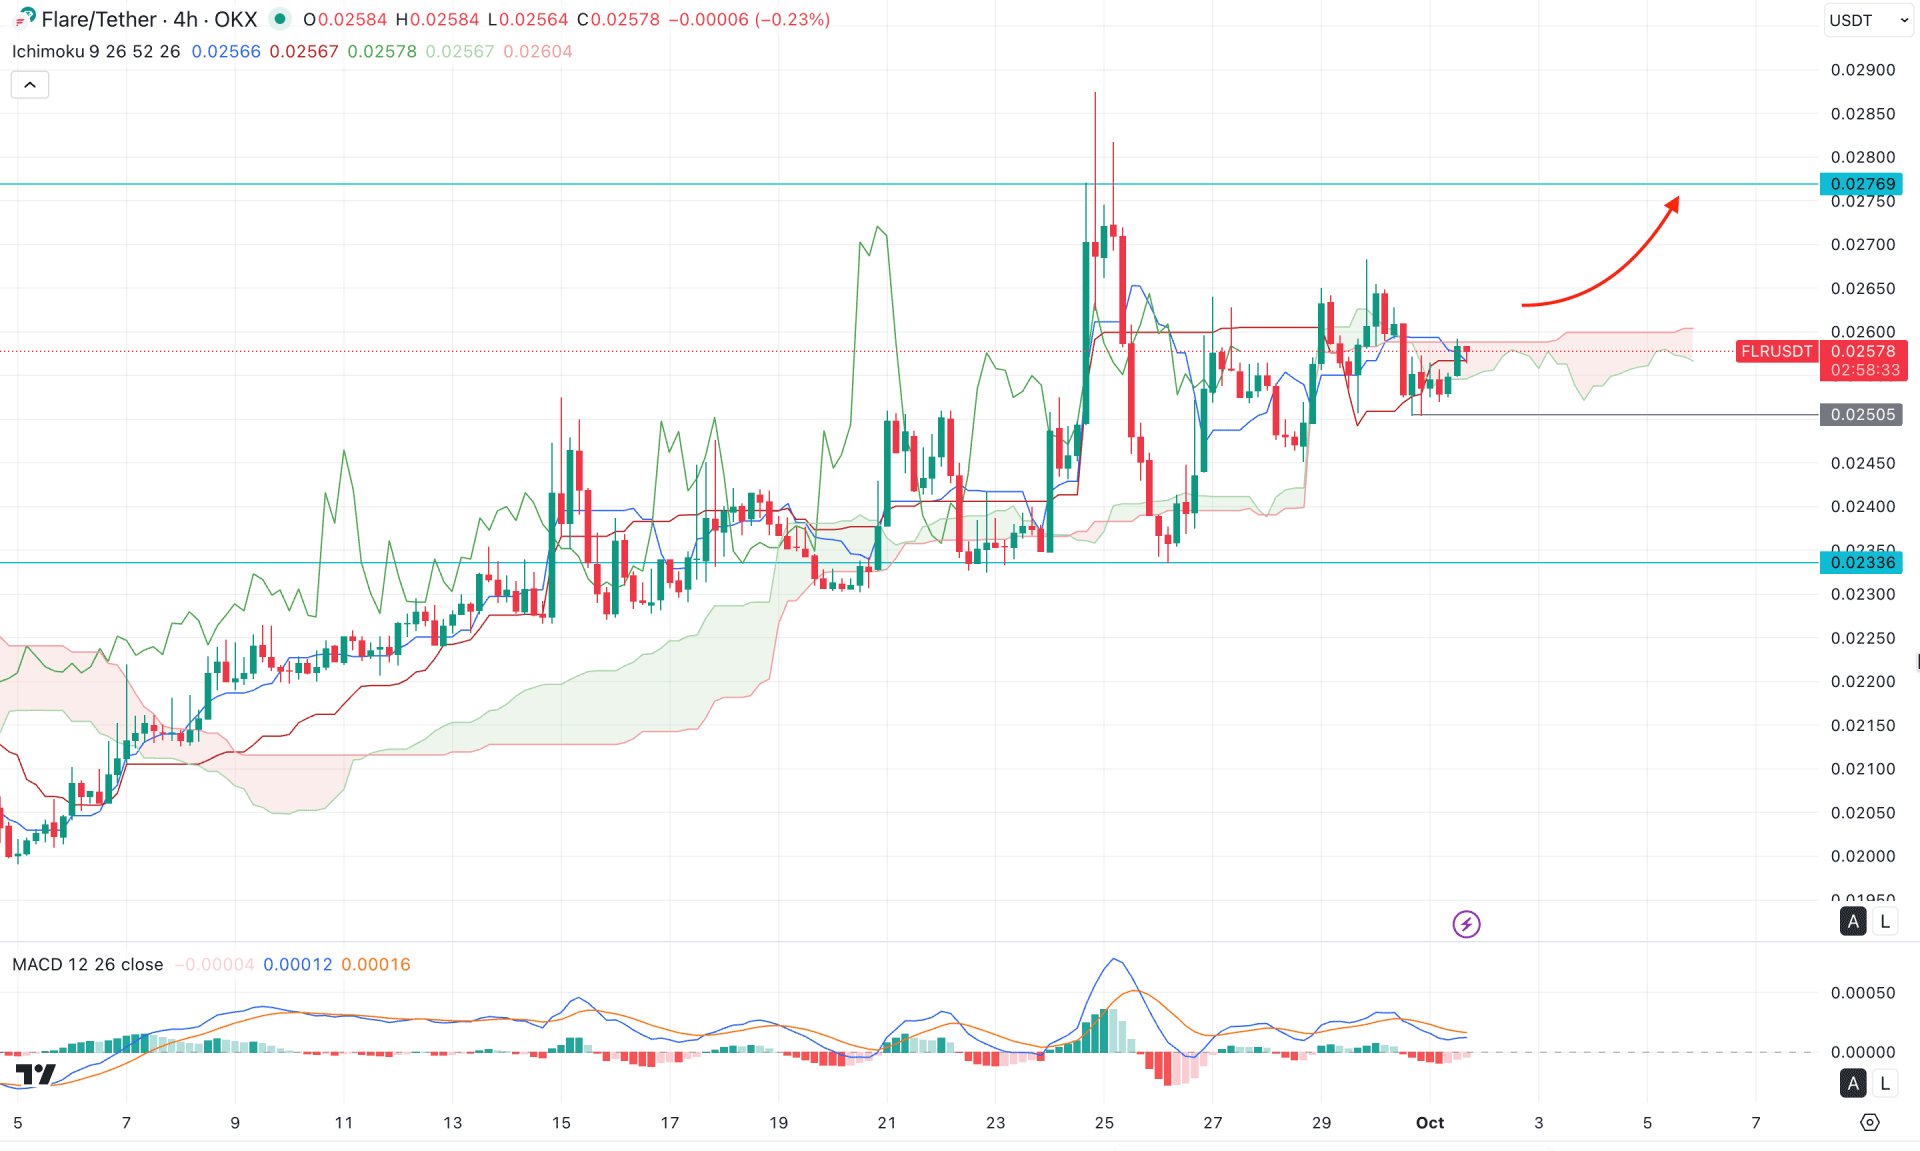
In the four-hour timeframe, the current price is trading sideways within the Ichimoku Cloud, while the future cloud remains flat. The base and conversion lines are close to the current price and are also moving sideways. This reflects a corrective market structure, where a potential range breakout is needed before anticipating a stable trend.
In the secondary indicator window, a bullish crossover is observed in the MACD signal line, while the histogram has failed to sustain bearish momentum.
Overall, market sentiment remains bullish, and a four-hour close above the 0.0260 level could offer a long opportunity, targeting the 0.0270 level.
On the other hand, a bearish opportunity may arise if the price fails to sustain bullish momentum above 0.0250. In that case, a short position could be considered, with immediate support at 0.0233, followed by a potential move toward 0.0210.
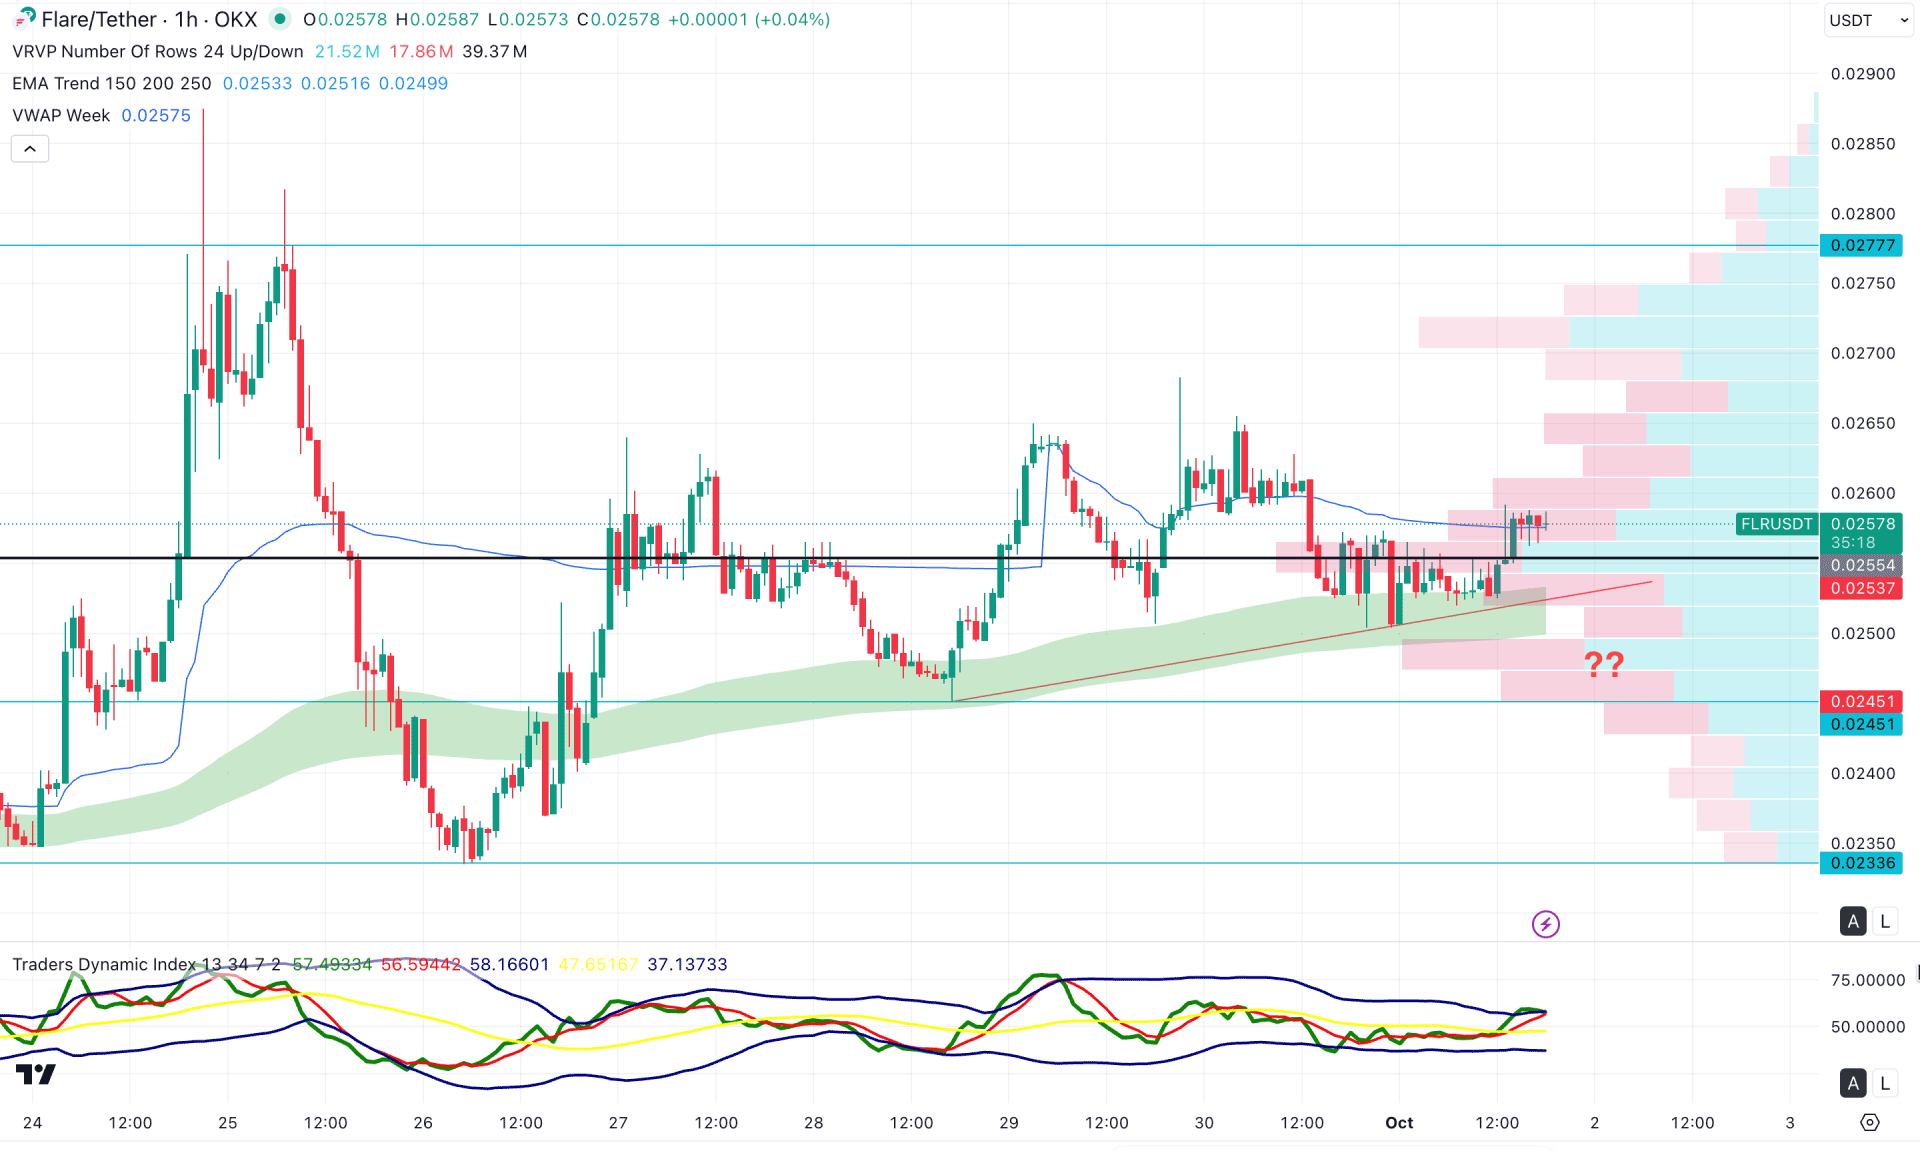
In the hourly timeframe, the recent price is trading above a rising trendline support, where the EMA wave is providing confluent buying pressure. Moreover, the static daily high-volume line is positioned just below the current price, acting as immediate support.
In the secondary indicator window, the bullish momentum remains solid as the Traders Dynamic Index (TDI) stays above the 50.00 neutral point.
Based on the overall market structure, the rising trendline support, combined with a breakout above the weekly VWAP line, indicates a bullish continuation opportunity. The primary objective would be to test the 0.0265 resistance level. A successful breakout above this zone could open the path toward the 0.0277 resistance area.
On the bearish side, sufficient liquidity exists below the trendline support, suggesting that a bullish shakeout (false breakdown) could occur within the 0.0265–0.0245 range. In such a case, a rebound confirmation with a stable price above the weekly VWAP would be required before entering a long position.
An extended breakdown below the 0.0245 level could offer a short opportunity, targeting the 0.0233 support zone.
Based on the overall market structure, FLR/USDT is currently trading in a premium zone, where a range breakout could present a long opportunity in alignment with the major bullish trend.
As the higher timeframe structure remains strong, investors should closely monitor how the bottom forms in the intraday chart before executing a long entry.


